MASS SPECTROSCOPY WITH DERIVATIZATION
Analisis Profil Metabolit Sekunder Ekstrak Etanol Lempuyang Gajah (Zingiber
zerumbet Smith) Menggunakan Kromatografi Spektroskopi Massa
Terderivatisasi
Dedi Hanwar, Mutia Sari Dewi, Andi Suhendi, Ika Trisharyanti D.K. Fakultas Farmasi, Universitas Muhammadiyah Surakarta
e-mail: [email protected]
ABSTRAK
Lempuyang Gajah (Zingiber zerumbet Smith) adalah salah satu spesies tanaman yang mengandung metabolit sekunder yang penting dalam pengobatan penyakit. Penelitian ini dilakukan untuk mengetahui metabolit sekunder yang terkandung dalam ekstrak etanol lempuyang gajah dari dua daerah (Solo dan Yogyakarta) setelah dideriva-tisasi dan menentukan tingkat zerumbon nya. Analisis profil metabolit dilakukan dengan kromatografi gas dengan detektor massa spektroskopi, sistem injeksi split, dan helium sebagai fase gerak dengan kecepatan konstan 3,0 mL/ menit dan diderivatisasi dengan BSTFA. Sementara zerumbon tingkat ditentukan dengan metode yang sama tetapi tanpa derivatisasi. Hasil penelitian menunjukkan bahwa terdapat perbedaan profil metabolit sekunder ekstrak etanol lempuyang gajah dari Solo dan Yogyakarta, namun tingkat zerumbon yang tidak berbeda dalam dua ekstrak adalah 13,00% (Solo) dan 13,35% (Yogyakarta).
Kata kunci: profil metabolit sekunder, GCMS, Zingiber zerumbet Smith, zerumbon, BSTFA
ABSTRACT
Lempuyang gajah (Zingiber zerumbet Smith) is one of the plants species that contain secondary metabolites that are important in diseases treatment. This study was conducted to determine the secondary metabolites con-tained in the ethanol extract of lempuyang gajah from two regions (Solo and Yogyakarta) after derivatized and
determine its zerumbon level. Metabolite profile analysis performed by gas chromatography with mass spec -troscopy detector, split injection system, and helium as the mobile phase at a constant rate of 3.0 mL/min and derivatized with BSTFA. While zerumbone levels determined by the same method but without derivatization.
The results showed that there were differences in secondary metabolite profiles of ethanol extract of lempuyang gajah from Solo and Yogyakarta, but its zerumbon levels did not differ in the two extracts were 13.00% (Solo) and 13.35% (Yogyakarta).
Keywords: profile of secondary metabolites, GCMS, Zingiber zerumbet Smith, zerumbone, BSTFA
INTRODUCTION
Zingiber zerumbet has been widely use in the preparation of traditional medicines. Its rhizome used as a slimming drug, appe-tite enhancer, body warmers, headache medi-cine, remedy dysentery, and helps remove gas (carminative) abdominal bloating. Its ethanol extract of the rhizome has analgesic and
an-tipyretic activity capable of inhibiting inflam -mation caused by induction of prostaglandin (Somchit et al., 2005), and antioxidants activity (Stanly et al., 2010; Rout et al., 2011). Zerum
-bone and α-caryophyllene contained in the
leaves and rhizomes, and these compounds at
high concentrations showed anti-inflammato -ry activity, antiulcus, antioxidant and
antimi-crobial (Jaganath and Ng, 2000; Somchit and Shukriyah, 2003; Mascolo et al., 1989; Agrawal
et al., 2000; Bhuiyan et al., 2009).
Zerumbone assay can be performed
with gas chromatography mass spectrometry
(GCMS) method for qualitative and quantita
-tive analysis. In addition, GCMS was also one of the technology for metabolite profiling (Ko -pka, 2006), because it has a good reproducibil-ity and wide applications for various types of classes of metabolites (Dunn et al., 2005; Fienh et al., 2000; Roessner et al., 2000; cit. Cha et al., 2008). Metabolite profiles are used for
relative quantitation of metabolites of a num
-ber of samples. GCMS can yield more accurate data on the identification of compounds that are equipped with molecular structure (Pavia,
2006).
GCMS for separation and detection, re
-quiring organic compounds volatile gases and
inorganic compounds in a mixture (Settle,
1997) and is stable at temperatures of testing, mainly of 50-300°C. If the compound is not
volatile or unstable at the test temperature, the compound must be derivatized in order to
be analyzed by GCMS (Mardoni et al., 2007).
Therefore Zingiber zerumbet raw material
har-vested from different areas of each unknown secondary metabolite profiles were
analyzed using GCMS with derivatization, this
study is to provide an overview of each of the
chromatographic profiles of secondary metab -olites Zingiber zerumbet Smith from different regions.
MATERIALS AND METHOD Materials
Materials used in this research were Lempuyang gajah and methanol. The
instru-ment used were a set of Gas Chromatography Shimadzu GC-2010 equipped with a Shimadzu GC-Mass Selective Detector 2010s with Rxi TM-1MS column, micropipette, refrigerators.
Methods
Sample Preparation
A total of 10.0 mg of lempuyang gajah
extract weighed accurately and dissolved with methanol and then inserted into the
measur-ing flask and 5 mL of methanol was added to
the limit (Solution A). Derivatization Process
A 100 µL solution was taken and evap -orated to dryness under nitrogen gas. Then
added 100 μl BSTFA and heated at 70 oC for 10 min and then injected at GCMS (Solution B). Analysis of Secondary Metabolites Profiles Us
-ing GCMS
Solution B in eppendorf tubes ready
to be injected into GCMS. Analyses were per
-formed using a Shimadzu GC-2010 equipped with a Shimadzu GCMS-2010s mass selective detector and RxiTM-1ms capillary column
(30m x 0.25 mm, film thickness 0.25 lm). Used
helium carrier gas with a constant rate of 3.0
mL/min, injected as much as 1 mL (split ra-tio 10:1), the injector temperature of 280 °C,
column temperature of 70 °C (5 min) - 270 °C (15 min) with a temperature rise of 10 °C/min.
and the solvent cut time 3 minutes. Ionization
energy of 70 eV with a scan range of 0.5 sec
-onds with the weight of fragment 35-550 m/z. Components were identified by comparing the
mass spectra of samples with internal Willey Library.
Quantitative Test
a. Preparation of Standard Curve
Taken 100 mL, 150 mL, 200 mL, 400 mL, and 800 mL of stock solution isolates zerum -bon, then inserted into the Eppendorf tube
and added to 1.0 mL of methanol, to obtain a concentration of 0.02%; 0.03%; 0.04%; 0.06%; 0.08%. Then each concentration was analyzed by GCMS system. The area acquired is made proportional to the concentration equation as
X-axis and Y-axis area as.
b. Sample Preparation
A total of 10.0 mg of lempuyang gajah
extract weighed carefully and dissolved with methanol and then inserted into the
measur-ing flask and 5 mL of methanol was added to
the limit.
RESULTS AND DISCUSSION
Metabolite profile analysis using GCMS
Rhizomes were taken from lempuyang
gajah (Zingiber zerumbet Smith) from two dif-ferent regions, namely Solo and Yogyakarta. Analysis using gas chromatography for non-volatile polar compounds, such as phenolic and acidic compounds, the assay is less sensi-tive and there is peak tailing, the derivatization method used to improve the accuracy of gas chromatography, reproducibility, and sensitiv-ity (Nakashima et al., 2004).
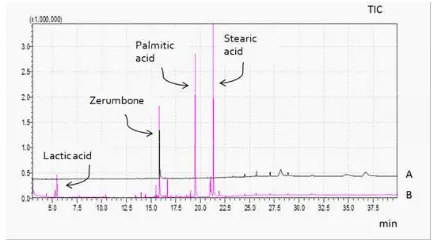
After derivatization and analyzed
us-ing GCMS, there are significant differences be -tween the sample and the sample of non de-rivatization with dede-rivatization, as seen that
many peaks appear (Figure 1). In the non-po -lar volatile components such as phenolic com-pounds and acidic comcom-pounds detected after many derivatized, for example, lactic acid,
acetic acid, formic acid, citric acid and oxalic acid.
Derivatization will differ among plant
species and depends on the genetic
composi-tion (endogenous enzyme activity) (Pierce, 1968). According to Kaufman et al. (1999), the environment is one factor that is important in the biosynthesis of metabolites in plants.
Plants can regulate metabolite production in
accordance with changing factors that exist in the environment.
According to Gupta (1994), a medicinal plant that grows in the soil and different sea -sons will produce chemical compounds and
different therapeutic effects. This suggests that the environment influence the chemical
constituents of plants.
Derivatization method for gas chroma-tography mass spectroscopy is the method of
Silylation (BSTFA + 1% TMCS) because it cov -ers a broad range in variety of applications, excellent thermal stability, and good
chro-matographic characteristics (Pierce, 1968). In
addition, because it is easy to prepare and use,
time efficient, and a variety of reagents are
available.
Silylation reagents are generally sensi-tive to moisture. It can be controlled by drying using nitrogen to prevent deactivation. BSTFA reagent was used because of its availability,
easy to use, faster reaction, and efficient time (Kuo and Ding, 2004) (Shin et al., 2001).
Figure 1. GCMS Profiles of Lempuyang Gajah (Zingiber zerum bet Smith) Extract. (A) non derivatization and (B) with derivatization
Menggunakan Kromatografi Spektroskopi Massa Terderivatisasi
Silylation reagents are generally sensi-tive to moisture. It can be controlled by drying using nitrogen to prevent deactivation. BSTFA reagent was used because of its availability,
easy to use, faster reaction, and efficient time (Kuo and Ding, 2004) (Shin et al., 2001).
The compounds can be derivatized us-ing BSTFA were alcohol, phenol, carboxylic
acids, amines, and amides (Evershed, 1993). TMCS is silylation catalysts, to increase the re -activity of the BSTFA reagent.
Gas chromatography is used because
it has good reproducibility and wide applica-tions for various types of classes of metabolites (Dunn et al., 2005; Fienh et al., 2000; Roessner
et al., 2000; cit. Cha et al., 2008). GCMS shown to increase the sensitivity and ideal for many
applications in the field of health.
GCMS can yield more accurate data in the identification of compounds that are equipped with molecular structure (Pavia, 2006). Both
samples were analyzed using gas chromatog-raphy with a integration area 50000. Replica -tion 3 times produce chromatograms are al-most similar to each other (Fig. 2). Although
the plants from different regions,
Figure 2. C GCMS Profiles of Lempuyang Gajah (Zingiber zerumbet Smith) Extract. (A) Yogyakarta and (B) Solo
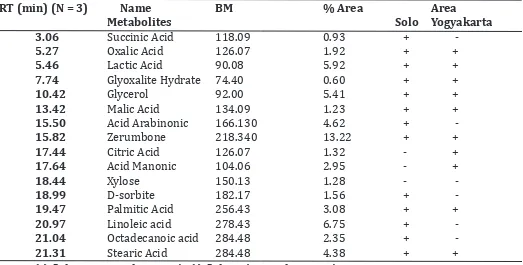
The analysis resulted in several
subse-quent peaks of each peak compared with Wil-ley Library database version 7 so it can be ex -pected that the compounds contained in the
extract (Table 1). The main criteria for the se
-lection of a suitable ion for compound identifi
-cation should have a high peak areas (> 0.05%)
(Jiang et al., 2006).
(Solo and Yogyakarta) but both areas the
dis-tance is not too far away so that differences in
location, climate, rainfall, and intensity of sun light may not vary much.
Table 1. Comparison of qualitative secondary metabolite lempuyang elephants from areas Solo and Yogyakarta with a
minimum area of 200,000
RT (min) (N = 3) Name BM % Area Area
Metabolites Solo Yogyakarta
3.06 Succinic Acid 118.09 0.93 + -
5.27 Oxalic Acid 126.07 1.92 + +
5.46 Lactic Acid 90.08 5.92 + +
7.74 Glyoxalite Hydrate 74.40 0.60 + +
10.42 Glycerol 92.00 5.41 + +
13.42 Malic Acid 134.09 1.23 + +
15.50 Acid Arabinonic 166.130 4.62 + -
15.82 Zerumbone 218.340 13.22 + +
17.44 Citric Acid 126.07 1.32 - +
17.64 Acid Manonic 104.06 2.95 - +
18.44 Xylose 150.13 1.28 - -
18.99 D-sorbite 182.17 1.56 + -
19.47 Palmitic Acid 256.43 3.08 + +
20.97 Linoleic acid 278.43 6.75 + -
21.04 Octadecanoic acid 284.48 2.35 + -
21.31 Stearic Acid 284.48 4.38 + +
The results of each of the extracts
showed peak differences and differences in
the amount of metabolites contained. The re-sults of gas chromatography mass spectrosco-py analysis with a minimum area of 200,000, the extract from the Solo and Yogyakarta, there
were 13 and 12 compounds were identified re -spectively. While the compounds owned by the
both area were 8 compounds.
Secondary metabolites contained were xylose, palmitic acid, stearic acid, zerumbone, octadecanoic acid, oxalic acid, and malic acid. The results obtained from these two regions indicates that zerumbone is a major compo-nent contained in lempuyang gajah rhizome.
Average % area of zerumbone of the Solo and Yogyakarta were 13.44.
The differences content on the two dif -ferent regions of lempuyang gajah can be
in-fluenced by genetic factors and environmental factors, such as regional differences. The re
-gional differences may cause the availability of difference nutrients in the soil for theplant.
Each region has differences on nutrient content resulting differences in the results of
the metabolic processes of plants, so that the secondary metabolites produced was also
dif-ferent. In addition to the differences in location,
climate, rainfall, and sunlight intensity can also
affect secondary metabolite produced.
Determination of Levels of Zerumbone Using GCMS
GCMS method has been applied to the
analysis of lempuyang gajah plants. Based on
research Chane-Ming et al. (2003), the larg-est component in lempuyang gajah rhizome is zerumbone, which is the pharmacologically
active compounds of the plant. Zerumbon as -say was conducted to determine the levels of compounds responsible for pharmacological
activity and can be used as a quality control. Zerumbone assay using SIM (Selected Ion Mon -itoring) GCMS method. Usefulness of the SIM method is to monitor the selected peaks asso-ciated with a particular substance.
This was done with the assumption that at a given retention time, certain ions are charac-teristic of a particular compound. This is a fast
and efficient analysis, especially if the analyst
has previous information about a sample or
just looking for some specific substances.
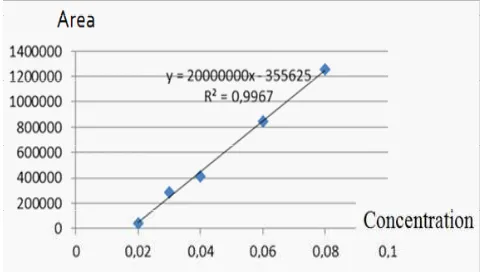
Figure 3. Standard curve of zerumbone
From the above-mentioned standard
curve, equation Y = 20000000 X - 355 625 with a correlation coefficient (r 2) of 0.9967. The equation used to determine the estimated
value of Y at a particular level of X, where Y is the area and X is the concentration. Based on
the linear regression equation obtained an av
-erage grade of zerumbon Solo area by 13% w / w, and from the Yogyakarta at 13.35% w / w.
Table 2. Zerumbone Level of Lempuyang Gajah Extract
Area Levels of Zerumbone
(% w/w)
Solo 13.00
Yogyakarta 13.35
Zerumbone levels using GCMS were around 13.00% w/w and these result showed
that zerumbone is a major compounds on lem-puyang gajah extract.
CONCLUSIONS
There were significant differences in the chromatographic profiles of secondary metabo -lites between the Solo and Yogyakarta after deriva-tized.
Menggunakan Kromatografi Spektroskopi Massa Terderivatisasi
Zerumbone level of the Solo was 13.00% w/w, and from the Yogyakarta was 13.35%
w/w.
REFERENCES
Pierce AE. 1968. Silylation of Organic
Compounds (a technique for gas-phase analysis), Pierce Chemical Co. Rockford, III
Agrawal AK.,Rao CV.,Sairam K.,dan Joshi V.K.
2000. Antipyretic dan Analgesic Activi-ties of Zingiber zerumbet Extracts.
In-dian J Exp Biol., 38: 994-998.
Bhuiyan NI., Chowdury JU. and Begum J. 2009. Chemical Investigation of the Leaf and Rhizome Essential Oil of Zingiber
zerumbet (L.) Smith from Bangladesh. Bangladesh J Pharmacol, 4: 9-12.
Boris A.2012. Toward the Complete Character
iztion of Atmospheric Organic Particulate
Matter: Derivatization and Comprehen
-sive Two-Dimensional Gas Chromatog
-raphy/ Time of Flight Mass Spectrom
-etry as a Method for the Determination of Carboxylic Acids, theses, Master of
Sci-ence in Chemistry Portland State Uni -versity
Chane-Ming J., Vera R. and Chalchat JC. 2003. Chemical composition of the essential oils from rhizomes, leaves and flowers of Zingiber zerumbet Smith from Re -union Island. J Essent Oil Res, 15:
202-05.
Cronquist A. 1981. An Integrated System of
Classfication of Flowering Plants. Colum
-bia University Press: New York. p 447 Dai JR.,Cardellina JHII.,Mc Mahon JB, Boyd MR.
1997. Zerumbone, an HIV-inhibitory and cytotoxic sesquiterpene of Zingiber aromaticum and Z. zerumbet. Nat.Prod. Lett., 10:115-118.
Desbrosses G., Steinhauser D., Kopka J. &
Udvardi M. 2005. Metabolome Analysis Using GC-MS, Lotus japonicus Handbook.
Max-Planck-Institute of Molecular Plant Physiology, Plant Nutrition Group, Ger
-many. p. 166
Dunn WB., Bailey NJC. & Johnson HE. 2005.
Measuring the metabolome: current analytical technologies. Analyst, 130:
606-625.
Knapp DR. 1979. Derivatisation Handbook of
Analytical Reactions. John Wiley & Sons,
New York
Ellis DI., Dunn WB., Griffin JL., Allwood JW. and Goodacre R. 2007. Metabolic Fin -gerprinting as a Diagnostic Tool.
Phar-macogenomic Review, 8(9): 1243-1266. Evershed RP. 1993. Advances in Silylation, in:
Blau, K., & Halket, JM (Ed.), Handbook
for Derivatives for Chromatography, 2nd ed. John Wiley & Sons, Chichester.
Fancy SA., and Rumpel K. 2008. GC-MS-Based metabolomics, in Methods in Pharmacol
-ogy and Toxicol-ogy: Biomarker Methods
in Drug Discovery and Development.
Hu-mana Press. Totowa, pp. 317-340. Fiehn O., Kopka J., Dormann P., Altmann T.,
Trethewey RN. and Willmitzer L. 2000. Metabolite profiling for plant function -al genomics. Natur-al Biotechnology, 18:
1157-1161.
Fowlin IA. 1995. Gas Chromatography. 2nd ed.
Chichester: John Wiley & Sons. Gohlke RH and McLafferty FW. 1993. Early
gas chromatography/mass spectrom-etry. J Am Soc Mass Spectrom.,
4:367-371.
Hanafi M., Sutedja L., Mulder R. and Braybook C. 2001. Isolation and identification of chemical Constituents of Zingiber zerumbet the rhizome. Proceedings of the International Seminar on Natural
Harrigan GG. and Goodacre R. 2003. Introdu tion. Di in: Harrigan GG, Goodacre R,
editors. Metabolic Profiling: Its Role inBiomarker Discovery and Gene Func-tion Analysis. Dordrecht: Kluwer Aca
-demicPb. p. 1-8.
Hasnah MS. 1991. Chemical Constituents of some medicinal plants of Zingiberace -ae. Proceedings of the conference on the medicinal products from tropical rain forest; Forest Research Institute of Ma
-laysia, Kuala Lumpur; 2: 299-304.
Jaganath IB. dan Ng LT. 2000. Herbs: The
Green pharmacy of Malaysia. Vinpress Sdn. Bhd. and Malaysia Agricultural Re -search and Development Institute, pp
95-99.
Kopka J. 2006. Current Challenges and Devel opments in GC-MS metabolite profiling
Based Technology. Journal of Biotech-nology, 124: 312-322.
Mascolo N., Jain R., Jain SC. dan Capasso FJ. 1989. Ethnopharmacologic Investiga
-tion of Ginger (Zingiber officinale). Eth -nopharmacology, 27: 129.
Murakami A., Takahashi M., Jiwajinda S.,
Koshimizu K., Ohigashi H. 1999. Iden
-tification of Zingiber zerumbet zerum-bone in Smith as a potent inhibitor of
12-Otetradecanoylphorbol-13-acetate-induced Epstein-Barr virus activation. Biosci Biotechnol Biochem,
63:1811-1812.
Murakami A., Takahashi D., Kinoshita T.,
Koshimizu K., Kim HW., Yoshihiro A.,
Nakamura Y., Jiwajinda S., Terao J.,
Ohi-gashi H 2002. Zerumbone, a Southeast Asian ginger sesquiterpene, markedly
suppresses free radical generation,
proinflammatory protein production,
and cancer cell proliferation accompa-nied by apoptosis: the alpha,
beta-un-saturated carbonyl group is a prerequi -site. Carcinogenesis, 23(5) :795-802.
Pavia DL., Lampman GM., Kritz GS., Engel RG.
2006.’s Introduction to Organic
Labo-ratory Techniques (4th Ed.). Thomson
Brooks / Cole. pp. 797-817.
Perry LM. 1980. Medicinal plants of East and South East Asia: Attributed properties
and uses. MIT Press, Cambridge.
Perkins ND. 2007. Integrating cell-signaling pathways with NF-kappaB and IKK
function. Nat Rev Mol Cell Biol, 8(1) :49-62.
Rout KK., Mishra SK., and Sherma J. 2009. Development and Validation of an
HPTLC Method for Analysis of Zerum
-bone, the Anticancer Marker from Zin-giber zerumbet. Acta Chromatographi -ca, 443-452.
Settle F. (Editor). 1997. Handbook of Instru
mental Techniques for Analytical Chem -istry. Prentice Hall PTR, New Jersey, USA.
Somchit N., Hareet M., Nur Shukriyah MH.
2003. Anti-inflammatory property of
ethanol and water extracts of Zingiber zerumbet. Indian J Pharmacol, 35:
181-82.
Stanly C., Bhatt S. and Keng CL. 2010. A
comparative study of Curcuma zedoaria and Zingiber zerumbet plantlet
produc-tion using different micropropagaproduc-tion
systems. African Journal of Biotechnol-ogy, 9(28): 4326-4333
Sakinah SSA., Handy ST. and Hawariah LPA. 2007. Zerumbone induced apoptosis in
liver cancer cells via modulation of Bax/ Bcl-2 ratio. Cancer Cell Int., 7: 4.
Basak ST., Sarma GC. and Rangan L. 2010. Ethnomedical Zingiberaceous the uses
of plants of Northeast India. J. Ethnop -harmacol., 132: 286-296.
Villas-Boas SG., Mas S.,Åkesson M.,Smedsgaars J. & Nielsen J. 2005. Mass. Spectrofo -tometry in metabolome Analysis. Mass. Spectrofotometry Review, 24: 613-646.
Menggunakan Kromatografi Spektroskopi Massa Terderivatisasi
Sun Y., Irie M., Kishikawa N., Wada M., Kuroda
N. and NakashimaK. 2004.Biomed.Chro