Managing maize production in shifting cultivation
milpa
systems in Yucata´n,
through weed control and manure application
David Parsons
a,*
, Luis Ramı´rez-Aviles
b, Jerome H. Cherney
c, Quirine M. Ketterings
d,
Robert W. Blake
d, Charles F. Nicholson
eaSchool of Agricultural Science, University of Tasmania, Private Bag 54, Hobart, TAS 7001, Australia bFacultad de Medicina Veterinaria y Zootecnia, Universidad Auto´noma de Yucata´n, Mexico cDepartment of Crop and Soil Sciences, Cornell University, United States
dDepartment of Animal Science, Cornell University, United States
eDepartment of Applied Economics and Management, Cornell University, United States
1. Introduction
The system of milpa shifting cultivation has existed in the
Yucata´n Peninsula for more than three millennia (Turner et al.,
2003). Although it is unclear to what extent the system has
changed over time, there is evidence to suggest that its basic
structure has persevered since pre-Columbian days (Teran and
Rasmussen, 1995). Milpacultivation involves cutting an area of
forest, burning, and planting maize mixed with squash (Cucurbita
spp.) and beans, such as ‘ib’ (Phaseolus lunatus) and ‘xpelo´n’ (Vigna
unguiculate). Slashing and burning clears the soil for planting, releases nutrients from slashed vegetation for crop growth, and
reduces the population of weed seeds.Steggerda (1941)
hypothe-sized thatmilpawas the only method available to people farming
in such a forested landscape without the availability of draft animals. The extremely rocky soils and the distinct wet and dry seasons could perhaps be added to the list of factors molding the development of the agricultural system.
The sustainability of an agricultural system like milpa is
dependent on regeneration of the forest resource, which is actively maintained during the fallow period. Low stature tropical forest, such as found in the northern Yucata´n Peninsula, Mexico, is a
Agriculture, Ecosystems and Environment 133 (2009) 123–134
A R T I C L E I N F O
Article history:
Received 5 November 2008 Received in revised form 6 May 2009 Accepted 18 May 2009
Available online 11 June 2009
Keywords: Manure Milpa
Shifting cultivation Weed control
A B S T R A C T
Milpacultivation involving cutting an area of forest, burning, and planting crops has existed in the
Yucata´n Peninsula for more than three millennia. Fallow periods are short and decreasing, leading to a productivity collapse of the system. Technologies that increase yield and maintain plots under cultivation have the potential to decrease the land area needed for family food production, resulting in more mature forests. This study was undertaken to examine the relative importance and potential interactions of declining fertility and increasing weed pressure in reducing maize (Zea maysL.) yields, and to examine the effectiveness of combinations of weed control and sheep manure fertilization rates in sustaining productivity. The study sites were located near Merida, Yucata´n, Mexico. The experimental design with three replicates consisted of two sites, 2 cultivation years (1 or more than 1 year of cultivation), three sheep manure application rates (none, 4 Mg DM ha 1, and 8 Mg DM ha 1), and three weed control treatments (none, traditional hand weeding, and herbicide). Measurements included labor required for weed control, weed cover, and maize leaf, stem, and grain harvest and quality. Considerably more labor was needed for hand weeding than for chemical control. At harvest, grass and woody weed cover was greatest for plots with hand or no weed control. Herbicide and, to a lesser extent, hand weeding were effective in controlling herbaceous weeds after the first year of cultivation. Manure applications of 4 Mg DM ha 1and 8 Mg DM ha 1increased grain yields by one half (415 kg DM ha 1and 425 kg DM ha 1), stem yields by 36% (549 kg DM ha 1) and 50% (758 kg DM ha 1), and leaf yields by 40% (386 kg DM ha 1) and 45% (431 kg DM ha 1). With increasing cultivation year, chemical weed control was more effective than hand weed control in maintaining yields. Treatments had minor effects on protein and fiber concentrations of leaf, stem, and grain. Modest manure fertilization combined with chemical weed control has the potential to maintain or increase yields in repeatedly cultivated plots. Manure application could be implemented and maintained on smallholder farms with sheep.
ß2009 Elsevier B.V. All rights reserved.
* Corresponding author. Tel.: +61 3 6226 2610; fax: +61 3 6226 2642. E-mail address:[email protected](D. Parsons).
Contents lists available atScienceDirect
Agriculture, Ecosystems and Environment
j o u r n a l h o m e p a g e : w w w . e l s e v i e r . c o m / l o c a t e / a g e e
globally threatened ecosystem (Gonzalez-Iturbe et al., 2002). We hypothesize that there is a critical reinforcing feedback mechanism involving agricultural production and forest use. As demand for forest land for cropping increases and less land becomes available, fallow periods shorten, negatively affecting crop yields and, in turn, further spurring demand for forest conversion. Fallow period is a critical variable in this feedback process. Although reliable data on current practices are scarce, there is general consensus that fallow periods in the Yucata´n Peninsula of Mexico are short and shrinking.
For example,Weisbach et al. (2002)estimated that the average
fallow period is about 12 years, and only 6–8 years in some areas.
Caamal-Maldonado et al. (2001)estimated that the average fallow period is less than 8 years. Earlier studies indicated lengthier fallow
periods of 25–30 years (Rico-Gray and Garcia-Franco, 1992) or>30
years (Lopez-Forment, 1998).Emerson (1953), whose observations
were in 1935, estimated a 25–30-year fallow period, but added that in some instances fallows were 15 or 20 years in length and occasionally as short as 4 or 5 years.
The other key variable affecting length of fallow is the time that an area is cultivated before it is abandoned because of low crop yield. The current average maize yield for Yucata´n, approximately
750 kg ha 1(Caamal-Maldonado et al., 2001), is about the same as
measurements taken 70 years ago (Steggerda, 1941). It is generally
accepted that yields are greater in the first than in the second year of cultivation, although there are no published reports confirming this. In Yucata´n, where land is typically abandoned after 2 years, there has been controversy concerning the reasons for letting land
revert to fallow.Lundell (1934)hypothesized that the problem was
soil fertility decline; however, Emerson (1953) ridiculed this
suggestion, proposing increasing weed pressure and associate weed control costs as the principle factor for yield decline and plot
abandonment. Other authors (Ku Naal, 1992; Mariaca-Me´ndez
et al., 1995; Pool-Novelo and Herna´ndez-Xolocotzi, 1995; Reyes-Guerrero and Aguilar-Castillo, 1992) hypothesized that weeds and
fertility may jointly contribute to yield declines in milpa
cultivation. However, due to difficulties in conducting experiments in the highly variable soils of Yucata´n, and past failures to concurrently assess weed control needs and fertility changes in
replicated field trials (Weisbach et al., 2002; Steggerda, 1941;
Morley, 1981), definite conclusions related to the main cause of
yield decline in Yucata´nmilpascannot be drawn.
Management practices are needed that increase yield in the first year of cultivation, and maintain yield with continued cultivation. Obvious solutions for achieving these outcomes, considering the hypothesized limitations from weed competition and nutrient depletion, are herbicides and fertilizers.
In milpa, weeds and pests were traditionally controlled manually; however, pesticide use has become more common (Caamal-Maldonado et al., 2001).Ku Naal (1992)gives an example of herbicide adoption in the village of Yaxcaba´, where usage increased from nil in 1968 to 90% adoption in 1982. In contrast, fertilizer use rose from nil to 90% in the period 1980–1982. Data are unavailable on the present state of herbicide and fertilizer use on
milpasin the state of Yucata´n.
A major limitation to agricultural production in the developing world is nutrient depletion. One method of providing nutrients for crop production is the use of manure from livestock. Horses, cattle, hogs, and fowl have long been a component of the agricultural
systems of Yucata´n (Steggerda, 1941). Ownership of hair sheep is a
more recent practice, likely driven by demand for lamb and mutton in the populous central region around Mexico City, which has
grown more than 6% annually in recent years (FAO, 2006).Parsons
et al. (2006) reported that sheep production became a more important source of household revenue in Yucata´n between 1989
and 2004. The survey ofParsons et al. (2006)also indicated that
although every participant corralled sheep to some extent
(resulting in manure accumulation), only one third of these producers reported fertilizing with manure, whether on crops, forages, or elsewhere. Yet, the majority of smallholder sheep
producers also cultivate a milpa(Parsons et al., 2006), and are
unable to apply high rates of costly commercial fertilizers. Farmers have only recently added sheep to their systems to increase household income, and opportunities may exist to develop greater complementarities between these two farming system compo-nents, particularly through manure use.
The objectives of this study were to (1) examine the relative importance and potential interactions of declining fertility and increasing weed pressure in reducing maize yields, and (2) examine the effectiveness of combinations of weed control and sheep manure fertilization rates in sustaining the productivity of
milpacultivation.
2. Materials and methods
2.1. Study areas
The study sites were located near the communities of
Dzununca´n (2085104600N, 89
83800900W, 15 m) and Xmatkuil
(2085203400N, 89
83700100W, 15 m), Yucata´n, Mexico, approximately
12 km south of the city of Me´rida. These sites will hereafter be referred to as farm 1 and farm 2, respectively. The climate is hot
and sub-humid with a mean annual temperature of 278C and an
annual average rainfall of approximately 980 mm (Trejo-Va´zquez,
1999), which falls predominantly from June to October. The
predominant vegetation is tropical deciduous forest (Miranda,
1958), most of which is secondary growth (Go´mez-Pompa et al.,
1987). Farm 1 is located on private land with forest cover that is
approximately 12 years old, and is periodically lightly grazed with
sheep and goats. Farm 2 is located on communal (ejido) property
originally cleared for sisal cultivation, with current forest growth approximately 50 years old.
The thin soils of the Yucata´n Peninsula are formed on tertiary limestone with shallow black Lithosols surrounding rock outcrops
and deeper red Rendzinas at slightly lower relief (Shang and
Tiessen, 2003). Lithosols are shallow and stony with limestone fragments making up a large portion of the soil matrix; Rendzinas
contain less gravel and are deeper (FAO-UNESCO, 1974). The study
area contained both red and black soils but experiments were conducted on the deeper and less stony red soils which offered the greatest potential for cropping. Average chemical characteristics of
the soils are shown inTable 1.
2.2. Experimental design
In March 2006 three 15-m15-m plots were identified at farm
1, where maize had been grown the previous year. These plots were designated cultivation year (CY) 2. At farm 2, plots were located where maize had been grown the previous 2 years; designated CY 3. Combined, these cultivation years are referred to
as CY>1. At each farm, three additional plots were identified in
the forest, close to the cleared plots. The forest on these plots was of maturity similar to the plots that were cleared 1 or 2 years ago. These plots, hereafter referred to as CY 1, were slashed and burned in 2006. Three manure fertilization rates (none, low, high) and three weed control treatments (none, hand weeded, chemical herbicide) formed nine factorial combinations. Treatment loca-tions within each plot were allocated using a spatially balanced
design (van Es and van Es, 1993; van Es et al., 2007). Thus, a total of
12 plots (15-m15-m) containing a total of 108 sub-plots
(5-m5-m) were obtained from two farm sites, 2 cultivation years,
2.3. Preparation of plots
Trees were fell and vegetation slashed in CY 1 plots between February and April 2006, and subsequently burned in May 2006, with the exception of one plot; plot 4 (farm 1) was accidentally ignited in April by sparks from a neighboring farm. The CY 3 plots at farm 2 were cleared by slashing and burning stover and weed biomass in May 2006. Burning was unnecessary on farm 1 because sheep and goats had already consumed most of the standing biomass.
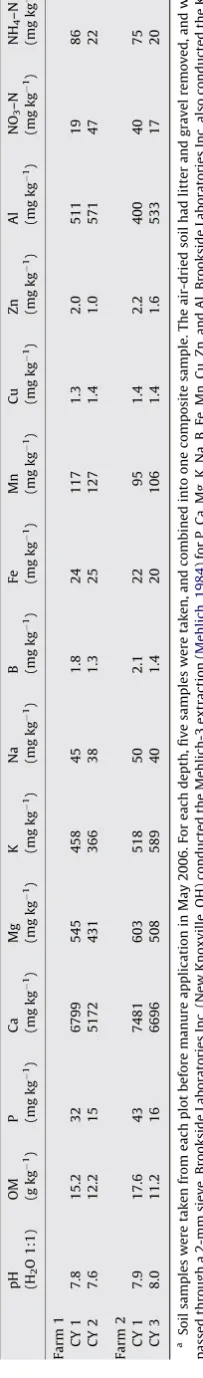
Soil samples were taken from each plot before manure application in May 2006. For each depth, five samples were taken, and combined into one composite sample. The air-dried soil had litter and gravel removed, and was passed through a 2-mm sieve. Brookside Laboratories Inc. (New Knoxville, OH) conducted the
Mehlich-3 extraction (Mehlich, 1984) for P, Ca, Mg, K, Na, B, Fe, Mn,
Cu, Zn, and Al. Brookside Laboratories Inc. also conducted the KCl
extraction (Gelderman and Beegle, 1998) for NO3–N and NH4–N.
The extracts were analyzed using an ICAP 61E trace analyzer emission spectrometer (Thermo Electron Corp., Waltham, MA). Soil pH was measured in a 1:1 water extraction (wt:vol). Soil organic matter was estimated using the loss-on-ignition method (Storer, 1984).
A mixture of sheep and goat manure was obtained from the small ruminant unit at the Autonomous University of Yucata´n and further mixed to assure uniform composition. Air-dried samples analyzed at the Dairy One Forage Testing Laboratory (Ithaca, NY) contained on average 3.34% organic-N, 0.08% ammonium-N, 0.51% P, and 1.6% K on a dry matter (DM) basis.
Manure was hand-applied in May 2006 at the rates of
4 Mg DM ha 1(low) and 8 Mg DM ha 1(high). Thus, the
equiva-lent fertilization rates were: 137 kg total N, 20 kg P, and
64 kg K ha 1(low); and 274 kg total N, 40 kg P, and 128 kg K ha 1
1 (high). Manure was applied to the inner 16 m2of each plot (18
plant spaces), and each plot was surrounded by a 0.5-m unmanured buffer zone to further reduce the risk of plot-to-plot movement of manure.
2.4. Weed assessment and control
Weed density was assessed at planting from seedling counts and percentage cover estimates. Weed cover groups included grasses, herbaceous species and woody species. Seedling count
was the average of three randomly placed 0.23-m0.47-m
quadrats per plot. Grass cover at planting was estimated by the foliar area covered. A single estimate per plot was agreed upon from visual observation by two evaluators using the following
categories: 0, >0–5, 5–15, 15–25, 25–50, 50–75, and 75–100%.
Weed cover was re-assessed during the growing season (mid-July 2006) and just before harvest (mid-October 2006).
Plots receiving hand weed control were cleared in a traditional manner using a ‘coa’, a small curved machete. Weeding was performed pre-planting (May 2006), early (mid-July 2006), and later in the growing period (mid-August 2006). Weeding at
pre-planting was performed only on the CY>1 plots because weeds in
the CY 1 plots were too small to effectively control by hand. The total man-hours required for each weeding was recorded for each plot.
Plots receiving chemical control were sprayed pre-planting (May 2006) and once during the growing period (late-July 2006). Although attempts were made to uniformly apply herbicide to all plots, the differences in weed cover and biomass, particularly between plots in different cultivation years, invited unequal outcomes. At pre-planting the farm 2 plots were sprayed with
Tordon 101TM (10.2% Picloram: 4-amino-3,5,6-trichloropicolinic
acid, and 39.6% 2,4-D: 2,4-dichlorophenoxyacetic acid) in a
Table
backpack sprayer at 7.8 L ha 1. During the growing period the
amount of herbicide used varied from event to event in an attempt to obtain uniform coverage across differing weed densities, and because of the difficulty of controlling the rates of application with a backpack sprayer. During the growing season farm 2 was sprayed
with Tordon 101TMat 3.6 L ha 1on CY 1 plots and 5.3 L ha 1on CY
3 plots.
Due to the dominance of grasses in the CY 2 plots of farm 1, all chemical weed control plots on farm 1 were sprayed at pre-planting with glyphosate [N-(phosphonomethyl) glycine] at
5.6 L ha 1. During the growing season plots at farm 1 were
sprayed with Tordon 101TM at 3.6 L ha 1 for CY 1 plots and
8.9 L ha 1 for CY 2 plots. The time required for spraying was
recorded for each plot.
2.5. Planting procedure
A local variety of maize (‘Xnucnal’) was sown in early June 2006. Seeds were sown by hand, two per planting position, with 50 cm between positions, and 1 m between rows, resulting in 50 plant
positions per plot (40,000 plants ha 1). Vacant plant positions
were re-sown in late-June 2006.
2.6. Maize harvest and chemical analyses
The crop was harvested in mid-October 2006. In each plot a buffer row at each side and two plant positions at the end of each row were left un-harvested. Consequently, a total of 18 plant positions per plot were harvested. The total number of cobs per plot was recorded, and grain was hand separated from the shanks and husks. The number of cobs with grain eaten or partly eaten by animals (e.g. birds and rodents) was recorded. Grain DM yield per
plot was determined by oven drying at 608C until a constant
weight was obtained. Grain yields were adjusted for the effect of animal consumption using the number of affected cobs and an average grain weight per cob. For each plot the wet weight of husks was recorded, but husk DM yield was not obtained due to limited oven space.
The remaining plant biomass was harvested from the same 18 plant positions per plot in early November. First, six sample positions were harvested, based on a randomly generated pattern, and separated into stem (comprising stem and inflorescence) and leaf (comprising leaf, leaf sheath, and remaining husk) fractions. Wet weights were recorded. The stem fractions were chopped using an electric chopper and sub-samples (approximately 400 g)
of the leaf and stem fractions were oven dried at 608C until a
constant weight was obtained. The remaining 12 positions per plot were then harvested and the wet biomass was recorded only. Leaf-to-stem ratios from the sub-samples were used to estimate the additional DM yields of leaves and stems. All plants were cut approximately 5 cm above ground level.
Leaf, stem, and grain sub-samples were ground to pass through a 1-mm screen. Leaf and stem samples were analyzed for neutral detergent fiber (NDF) concentration using the procedure described byvan Soest et al. (1991)with an ANKOM (Macedon, NY) fiber analyzer with filter bags. Total N concentration was determined by dry combustion (Leco Instruments, Inc., St. Joseph, MI) at the Dairy One Forage Testing Laboratory, Ithaca, NY.
2.7. Continuation of the experiment
To assess the effect of continuing cultivation on yield, the farm 2 plots were again planted to maize the following year (2007). Plots were managed in a similar manner as during 2006, but with reduced sampling and measurement. Plots were designated CY 2 and CY 4.
2.8. Statistical analysis
The experimental design contained three levels. For each of the two farms, six main plots (three of each cultivation year) were arranged in a completely randomized design. Each plot contained nine sub-plots, with combinations of manure and weed control treatments applied factorially. Results from the 2 trial years were analyzed separately. Weed and maize yield data were analyzed (both farms together), using mixed model procedures with PROC
MIXED (SAS Institute, 2003). All response variables were analyzed
using a mathematical model containing the fixed effects of cultivation year, manure rate, and weed control practice, and a random effect due to farm. Third and higher order interactions
were dropped from the model if non-significant atP0.05. For
repeated measurements, the fixed effect of time was included in
the model. Tukey’s statistic was used to test differences (P0.05)
among means. Additionally, grain yield differences between each manure-weed combination and the control practice (no manure, hand weeded) were evaluated for each cultivation year using Dunnett’s one-sided test.
3. Results
3.1. Treatment effects on weed dynamics
Manure application rate did not influence the amount of labor required to control weeds. However, farm, cultivation year, weed control method and time each affected (often with interactions)
the amount of labor required to control weeds (Table 2). Least
squares means are shown inTable 3. Labor requirements depended
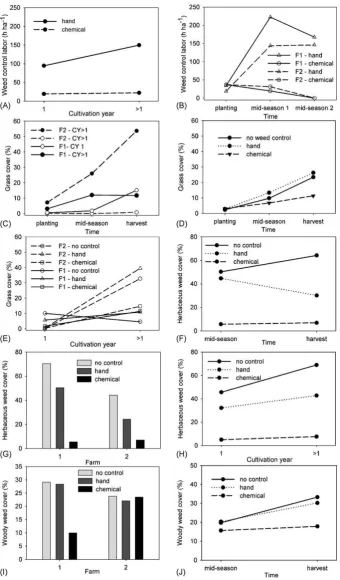
on cultivation year and method of weed control (Fig. 1a). More
labor was needed with hand weeding on CY>1 than for CY 1 plots,
while labor inputs were the same when weeds were chemically controlled.
Labor requirements also depended upon the farm, time, and the
method of weed control (Fig. 1b). At planting the labor input for
weed control was low, and there was no difference between hand and chemical weed control for either farm. For the first weed control period after planting, labor for hand weeding exceeded that for chemical control, and labor for hand weeding was greater on farm 1 than on farm 2. For the second weed control event after planting, labor for hand weeding was high for both farms (chemical control was performed twice only).
The number of seedlings at planting did not differ between
cultivation years (P>0.05; data not shown in tables). However,
farm 1 had more (P<0.05) seedlings (323 seedlings m 2) than
farm 2 (76 seedlings m 2).
The rate of manure application did not affect grass weed cover (Table 2). However, there was a significant interaction of farm,
cultivation year, and time (Fig. 1c). Grass cover did not increase
with time for CY 1 plots, but did increase with time for older plots. There was a significant interaction of type of weed control and time (Fig. 1d). Differences were undetectable among any weed control treatments at planting or at mid-season. However, grass cover at harvest was greater for plots with hand weed control or without weeding compared to chemical control, where grass cover did not significantly change with time. There was a significant interaction
of farm, cultivation year, and type of weed control (Fig. 1e). For CY 1
there was no difference in grass cover among plots. For CY>1,
there was no difference in grass cover for farm 1. For farm 2 the plots with hand or no weed control had greater weed cover than the chemical weed control plots.
There were no main effects of manure or time on herbaceous weed cover, although time was significant in the presence of an interaction. Farm, cultivation year, and weed control were all
Herbaceous cover was dependent upon an interaction of time and
type of weed control (Fig. 1f). At mid-season there was a greater
level of herbaceous weed cover for hand or no weed control than for chemical control. From mid-season to harvest, herbaceous weed cover increased without weed control, decreased with hand weed control, and remained constantly low for chemical weed control. As a result, at harvest herbaceous weed cover was greatest in the no control treatment, less in the hand weeding treatment, and least in plots under chemical weed control.
Herbaceous cover was dependent upon an interaction of farm
and type of weed control (Fig. 1g). Herbaceous weed cover was
greatest without weed control, less upon hand weeding and least with chemical control on both farms. Farms did not differ in herbaceous weed cover under chemical control; however, herbaceous weed cover on farm 1 was greater than on farm 2 for hand weeding and no weed control. Herbaceous cover was also dependent upon an interaction of cultivation year and type of weed
control (Fig. 1h). For both cultivation years, herbaceous weed cover
increased from chemical, to hand, and no weed control. Cultivation year did not affect herbaceous weed cover when controlled chemically or by hand; however, with no weed control, herbaceous
weed cover was greater for CY>1 than CY 1.
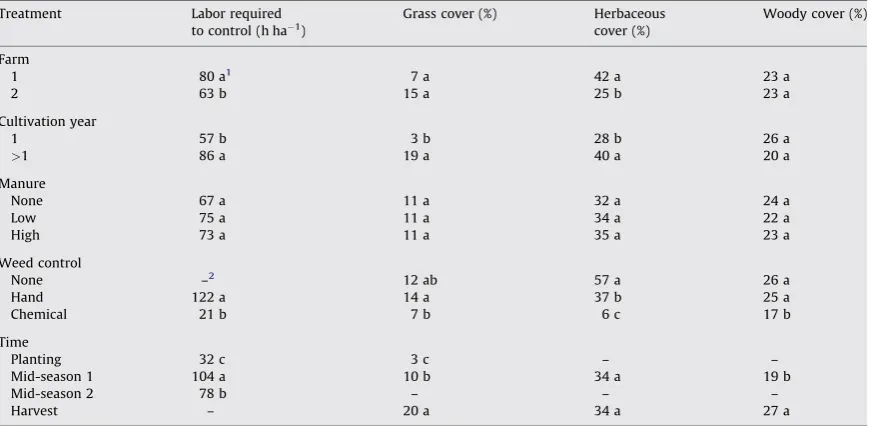
Table 2
Significance for weed characteristics under 2 cultivation year treatments (CY 1 and CY>1), three manure application treatments (0, 4, and 8 Mg ha 1), and three weed control treatments (none, hand weeding, chemical herbicide), at two farm locations over time. Farms were located in Yucata´n, Mexico. Random effects and non-significant third- and higher order interactions are not shown.
Labor required for control (h ha 1)
Grass cover (%) Herbaceous cover (%)
Woody cover (%)
Cultivation year (CY) *** ** ** NS
Farm (F)CY NSa * NS NS
Manure (M) NS NS NS NS
FM NS NS NS NS
CYM NS NS NS NS
Weed control (W) *** * *** ***
FW *** NS *** ***
CYW *** NS ** NS
MW NS NS NS NS
Time (T) *** *** NS ***
FT * ** NS NS
CYT NS *** NS NS
MT NS NS NS NS
WT *** ** *** *
FWT *** NS NS NS
FCYW NS *** NS NS
FCYT NS *** NS NS
a NS: not significant atP0.05. * Significant atP0.05. ** Significant atP0.01. *** Significant atP0.001.
Table 3
Main effect least squares means for weed characteristics under 2 cultivation year treatments (CY 1 and CY>1, reflecting first year of cultivation and consecutive years, respectively), three manure application treatments (0, 4, and 8 Mg ha 1), and three weed control treatments (none, hand weeding, chemical herbicide), at two farm locations over time, in Yucata´n, Mexico. Means for random effects (farm) are not shown.
Treatment Labor required to control (h ha1)
Grass cover (%) Herbaceous cover (%)
Woody cover (%)
Farm
1 80 a1 7 a 42 a 23 a
2 63 b 15 a 25 b 23 a
Cultivation year
1 57 b 3 b 28 b 26 a
>1 86 a 19 a 40 a 20 a
Manure
None 67 a 11 a 32 a 24 a
Low 75 a 11 a 34 a 22 a
High 73 a 11 a 35 a 23 a
Weed control
None –2 12 ab 57 a 26 a
Hand 122 a 14 a 37 b 25 a
Chemical 21 b 7 b 6 c 17 b
Time
Planting 32 c 3 c – –
Mid-season 1 104 a 10 b 34 a 19 b
Mid-season 2 78 b – – –
Harvest – 20 a 34 a 27 a
1 In each column and for each main effect, means followed by the same letter are not significantly different (P<0.05) according to Tukey’s test. Note that where interactions exist (Table 2), plots of the interactions (Fig. 1) should be examined rather than main effects.
2 Weed control was not undertaken or data were not recorded.
Woody weed cover was dependent upon an interaction of farm
and type of weed control (Fig. 1i). For farm 1, woody weed cover
was greater with hand or no weed control than for chemical weed control; however for farm 2 there was no difference between the three weed control treatments.
Woody weed cover was also dependent upon an interaction of
time and type of weed control (Fig. 1j). At mid-season there were
no significant differences between weed control treatments; at harvest, woody weed cover was greater for hand weeding or no weed control than for chemical weed control.
Fig. 1.Interactions of 2 cultivation year (CY) treatments (CY 1 and CY>1, reflecting first year of cultivation and consecutive years, respectively), three manure application
Table 4
Significance for maize characteristics under 2 cultivation year treatments (CY 1 and CY>1, reflecting first year of cultivation and consecutive years, respectively), three manure application treatments (0, 4, and 8 Mg ha 1), and three weed control treatments (none, hand weeding, chemical herbicide), at two farm locations in Yucata´n, Mexico. Random effects and non-significant third- and fourth-order interactions are not shown.
Source of variation df Grain yield (kg DM ha 1)
Cobs per plot (cobs plot 1)
Cob yield (g DM cob1)
Stem yield (kg DM ha1)
Leaf yield (kg DM ha 1)
Leaf-to-stem mass ratio (g g 1)
Stem protein (g kg 1)
Leaf protein (g kg 1)
Grain protein (g kg 1)
Stem NDF (g kg 1)a
Leaf NDF (g kg 1)
Cultivation year (CY) 1 NSb * NS NS * NS NS NS ** ** NS
Farm (F)CY 1 *** NS *** NS NS NS ** ** ** NS NS
Manure (M) 2 *** *** NS ** * NS NS NS NS * NS
CYM 2 NS NS NS NS NS NS * NS NS NS NS
FM 2 NS NS NS NS NS NS NS * NS NS NS
Weed control (W) 2 *** *** NS *** * * NS * NS NS **
MW 4 NS NS NS NS NS NS NS NS NS * NS
FW 2 NS NS NS NS NS NS ** NS NS * NS
CYW 2 *** ** ** ** NS NS NS NS NS * NS
aNDF–neutral detergent fiber. bNS: not significant atP0.05. *Significant atP0.05. **Significant atP0.01. *** Significant atP0.001.
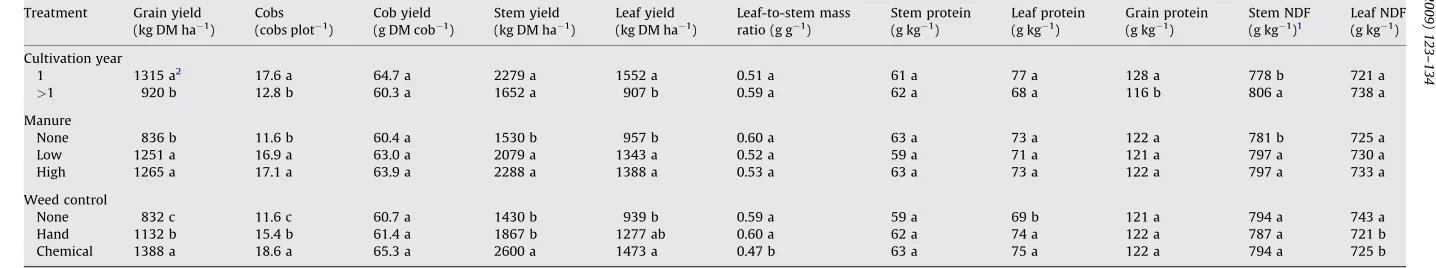
Table 5
Main effect least squares means for maize characteristics under 2 cultivation year treatments (CY 1 and CY>1, reflecting first year of cultivation and consecutive years, respectively), three manure application treatments (0, 4, and 8 Mg ha 1), and three weed control treatments (none, hand weeding, chemical herbicide), at two farm locations in Yucata´n, Mexico. Means for random effects (farm) are not shown.
Treatment Grain yield (kg DM ha 1)
Cobs (cobs plot 1)
Cob yield (g DM cob 1)
Stem yield (kg DM ha 1)
Leaf yield (kg DM ha 1)
Leaf-to-stem mass
[37_TD$DIFF]
ratio (g g1)
Stem protein (g kg 1)
Leaf protein (g kg 1)
Grain protein (g kg 1)
Stem NDF (g kg 1)1
Leaf NDF (g kg 1)
Cultivation year
1 1315 a2 17.6 a 64.7 a 2279 a 1552 a 0.51 a 61 a 77 a 128 a 778 b 721 a
>1 920 b 12.8 b 60.3 a 1652 a 907 b 0.59 a 62 a 68 a 116 b 806 a 738 a
Manure
None 836 b 11.6 b 60.4 a 1530 b 957 b 0.60 a 63 a 73 a 122 a 781 b 725 a
Low 1251 a 16.9 a 63.0 a 2079 a 1343 a 0.52 a 59 a 71 a 121 a 797 a 730 a
High 1265 a 17.1 a 63.9 a 2288 a 1388 a 0.53 a 63 a 73 a 122 a 797 a 733 a
Weed control
None 832 c 11.6 c 60.7 a 1430 b 939 b 0.59 a 59 a 69 b 121 a 794 a 743 a
Hand 1132 b 15.4 b 61.4 a 1867 b 1277 ab 0.60 a 62 a 74 a 122 a 787 a 721 b
Chemical 1388 a 18.6 a 65.3 a 2600 a 1473 a 0.47 b 63 a 75 a 122 a 794 a 725 b
1 NDF—neutral detergent fiber.
2 In each column and for each main effect, means followed by the same letter are not significantly different (P<0.05) according to Tukey’s test. Note that where interactions exist (Table 4), plots of the interactions (Fig. 2) should be examined rather than main effects.
D.
Parsons
et
al.
/A
griculture,
Ecosystems
and
Environment
133
(2009)
123–134
3.2. Treatment effects on maize yield
There was a main effect of manure on grain yield per hectare (Table 4). Without manure, 836 kg DM ha 1of grain was produced
(Table 5). Manure addition increased grain yield by
415 kg DM ha 1 with 4 Mg ha 1 and by 429 kg DM ha 1 with
8 Mg ha 1(Table 5). Farm, cultivation year, and weed control were
significant in the presence of interactions (Table 4). The interactive
effect of farm and cultivation year on grain yield is shown inFig. 2a.
Grain yield was substantially greater for farm 2 (1741 kg DM ha 1)
than for farm 1 (889 kg DM ha 1) for CY 1 plots. However, yield
differences were undetectable between farms for CY>1 plots.
There was no difference in grain yield between cultivation years for
farm 1. However, grain yield was greater for CY 1 than CY>1 for
farm 2.
The interactive effect of weed control and cultivation year on
grain yield is shown inFig. 2b. Weed control did not affect grain
yield from CY 1 plots, but yields in CY>1 plots were greater with
chemical control than with hand weeding or without weed control. In addition, there was no difference in grain yield between CY 1 and
CY>1 with chemical weed control whereas with hand or no weed
control, grain yield was lower for CY>1 than for CY 1.
The results for the number of cobs per plot were similar for those of grain yield. With no manure, 11.6 cobs per plot were
produced (Table 5). Manure addition increased cob production by
5.3 cobs per plot with 4 Mg ha 1applied and by 5.6 cobs per plot
when 8 Mg ha 1had been applied. Farm 2 produced 3.4 more cobs
per plot than farm 1 (Table 5). The interactive effects of type of
weed control and cultivation year on cobs per plot (Fig. 2c) were
similar to the corresponding interaction for grain yield shown in
Fig. 2b.
Grain yield per cob was not affected by manure addition (Table 4). The effect of farm and cultivation year on cob yield (Fig. 2d) was similar to the corresponding interaction for grain
yield per hectare (Fig. 2a). Also, the interactive effect of type of
weed control and cultivation year on cob yield (Fig. 2e) was similar
to the corresponding interaction for total grain yield (Fig. 2b).
Stem yield did not vary between farms (Table 4). There was a
main effect of manure on stem yield (Table 4). With no manure,
1530 kg DM ha 1 of stem was produced (Table 5). Manure
application increased stem yield by 549 kg DM ha 1 and by
759 kg DM ha 1 with 4 and 8 Mg ha 1 applied, respectively
(Table 5). The mean stem yields of the two manure application treatments were not significantly different. Stem yield was dependent upon an interaction of cultivation year and weed
control (Table 4). The interaction, shown inFig. 2f, was similar to
the corresponding interaction for grain yield (Fig. 2b).
There were main effects of cultivation year, manure, and weed
control on leaf yield, but there was no farm effect (Table 4). Leaf
yield was greater for CY 1 plots (1552 kg DM ha 1) than for CY>1
plots (907 kg DM ha 1) (Table 5). Without manure, leaf yield was
957 kg DM ha 1. Manure application increased leaf yield by
386 kg DM ha 1with 4 Mg ha 1of manure and by 431 kg DM ha 1
1 with 8 Mg ha 1. Leaf yields resulting from the two manure
treatments were not significantly different. Without weed control,
939 kg DM ha 1of leaf yield was produced. Chemical weed control
Fig. 2.Interactions of 2 cultivation year (CY) treatments (CY 1 and CY>1, reflecting first year of cultivation and consecutive years, respectively), three manure application
resulted in 535 kg DM ha 1more leaf yield than no weed control
(Table 5), while other contrasts were not significant.
The leaf-to-stem mass ratio was impacted by weed control method only; chemical control resulted in a ratio that was
0.13 g g 1lower (Table 5) than for hand or no control treatments.
3.3. Cultivation year-targeted management
For producers considering manure and/or weed control options for maintaining or increasing grain yields, the pertinent comparisons are the typical practice (hand weed control and no manure application) versus other potential combinations. The mean yields and results of these comparisons, averaged across
farms, and separated by cultivation year, are shown inFig. 3. The
control grain yields were 1148 kg DM ha 1 for CY 1 and
556 kg DM ha 1 for CY
>1. Averaged across cultivation years
the control yield was 852 kg DM ha 1. For CY 1 (Fig. 3a), only the
hand weed control and high manure treatment combination
resulted in a significantly greater grain yield (1890 kg DM ha 1)
than the control.
For CY>1 (Fig. 3b) the combinations of chemical weed control
and low or high manure resulted in greater yields than the control
(P<0.001). In contrast to the CY 1 plots, where most treatment
combinations resulted in high yields, high yields could only be
achieved in the CY>1 plots with a combination of manure and
chemical control.
The results from the additional year of maize cultivation in the
farm 2 plots in 2007 are shown inFig. 4. Farm 2 benefited from a
long fallow period, which likely explains the higher control yield in
CY 2 (1017 kg DM ha 1) (Fig. 4a). There were no differences in yield
due to treatment combinations. For the CY 4 plots the control yield
was 792 kg DM ha 1(Fig. 4b). Yields significantly greater than the
control were achieved with manure and chemical control, and with the high rate of manure and hand weed control.
3.4. Treatment effects on feeding quality of maize
Although there were a number of statistically detectable
treatment effects on plant protein and fiber (Table 4), the
magnitudes of most of these differences in relation to the expected
feeding value for livestock (Table 5) were inconsequential.
Mean protein concentration across treatments was 67 g kg 1
for stem and 81 g kg 1 for leaf, and neutral detergent fiber was
775 g kg 1for stem and 721 g kg 1for leaf.
Grain protein was dependent upon an interaction of farm and
cultivation year (Table 5). Grain protein concentrations for CY 1
and CY>1 were not significantly different for farm 1. However, the
protein concentration for CY 1 (136 g kg 1) was greater than that
for CY>1 (110 g kg 1) for farm 2. Mean grain protein
concentra-tion across treatments was 122 g kg 1.
4. Discussion
4.1. Treatment effects on weed dynamics
For any cultivation year, labor requirements were much greater for hand control than for chemical control. The mean time input for
hand weeding (122 h ha 1,Table 3) was similar to the findings of
Fig. 3.Mean 2006 maize grain yields resulting from combinations of three manure treatments (0, 4, and 8 Mg ha 1) and three weed control treatments (none, hand weeding,
chemical herbicide). Yields are averaged across farms, and separated by cultivation year (CY 1 and CY>1, reflecting first year of cultivation and consecutive years, respectively). Farms were located in Yucata´n, Mexico. The control is labeled, and treatment combinations where the yield is greater than the control are indicated with ‘*’ or ‘***’ (significant atP0.05 orP0.001, respectively).
Fig. 4.Mean 2007 maize grain yields resulting from combinations of three manure treatments (0, 4, and 8 Mg ha 1) and three weed control treatments (none, hand weeding,
chemical herbicide). Yields are from farm 2 and are separated by cultivation year (CY 1 and CY>1, reflecting first year of cultivation and consecutive years, respectively). Farms were located in Yucata´n, Mexico. The control is labeled, and treatment combinations where the yield is greater than the control are indicated with ‘*’ or ‘**’ (significant atP0.05 orP0.01, respectively).
Pascual (2005), where approximately 100 h ha 1was observed. If
chemical control can be implemented effectively it represents an opportunity for farmers to reduce labor input, and continue to cultivate the same land for a longer period.
Grass weed cover increased rapidly through the growing season, except where chemical control was implemented. Farm differences in grass cover probably reflect herbicide use at planting. Because grass weeds were not noticeable at farm 2
pre-planting, Tordon 101TMwas used on, which is ineffective against
grasses. Because these grasses were not controlled, for farm 2
CY>1 grass cover increased over time. In comparison, grasses
were more evident pre-planting for farm 1, and thus glyphosate was used which was effective in controlling grass weeds through the season. The results suggest that even when grasses can appear to be a minor component of plant cover, they can rapidly become significant during the growing season. If herbicides are used it would seem worthwhile to use a broad-spectrum herbicide pre-planting such as glyphosate, that is effective on grasses. We hypothesize that a single pre-planting spray of glyphosate may be sufficient to control grass weeds, and would be a useful area for further investigation.
The greater level of herbaceous weed cover for hand or no weed control than for chemical control in mid-season was not surprising as the cover estimate was made just before weeding, and only limited hand weeding took place at planting. At harvest, herbaceous weed cover was much less following chemical control than with hand or no weeding and with chemical control, there was no increase in weed pressure between cultivations years suggesting that chemical weed control could enable cultivation of the same land for an extended period.
Woody weed cover was often a significant component of total weed cover. It is unclear why chemical weed control reduced woody weed cover for farm 1, but not for farm 2; however, a difference in dominant species is possible. The benefit of chemical application on woody weeds during the growing season was not evident until harvest time, when cover was less than with hand or no weed control, possibly due to a slow growth rate. In general, chemical application on woody weeds was less effective than on
grass and herbaceous weeds (Table 3). It is unclear whether
chemical application could successfully control woody weeds for an extended period.
4.2. Treatment effects on maize yield
Manure application increased yields indicating manure addi-tion is effective in overcoming nutrient deficiencies. In comparison, interactions showed that the other factors affecting grain yield were less linear in nature. The interactions between cultivation year and farm can to some extent be explained by differences in farm characteristics. The longer fallow of farm 2 portended greater first year yields. In addition, if yields decrease with time under cultivation, the 2-year yield decline between the first- and third-year plots on farm 2 would be expected to exceed the decrease between first- and second-year plots on farm 1.
The interactive effect of weed control and cultivation year on grain yield suggests that the type of weed control in the first year of cultivation does not affect grain yield. However, with hand weed control, grain yield declined with continuing cultivation while grain yield did not decline with continuing cultivation when chemical control was implemented. Thus, hand weed control may be adequate in the first year of cultivation, after which chemical control may be a more effective (and less labor intensive) option. It is possible that type of weed control affects weed seed production and hence grain yields in subsequent years but this study could not
address this hypothesis because all CY>1 plots had been hand
weeded the previous year.
Manure addition affected the number of cobs per plot in the same manner as grain yield; it did not affect grain yield per cob. Determination of cob numbers is generally thought to occur during the vegetative growth stage, whereas cob weight often reflects conditions in the latter half of the growth cycle. Thus, the results suggest that maize was able to respond to increased fertility early in the growing season through increased cob numbers, but not later in the growing season. In comparison, the type of weed control and cultivation year affected both cob number and cob yield in a similar manner to grain yield. This suggests that maintaining weed control through chemical application benefits the crop throughout the growth cycle.
The factors affecting stem and leaf yield were similar to those affecting grain yield. Thus, for farmers who apply manure and weed control treatments, more biomass could be expected as a result, either for retention in the field or for feeding livestock.
4.3. Cultivation year-targeted management
Caamal-Maldonado et al. (2001)reported average maize yields
in Yucata´n to be approximately 750 kg ha 1 (approximately
660 kg DM ha 1 assuming 12% moisture), and thus the control
yields in this experiment are slightly higher but comparable. Although weed pressure was not limiting yield in the first year of cultivation, and fertility was of a sufficiently high level for attaining typical yields, the results showed that there is potential for greater yields with added manure. In comparison, for ongoing cultivation a combination of manure fertilization and chemical weed control was needed to maintain or to increase yields. Weed control was essential, but insufficient without manure, for attaining high yields. The decline in yield between first and subsequent years when weed control but not manure was used suggests that fertility becomes limiting over time. It is clear that as plots are continually used, both weed pressure and fertility are important factors to address in order to achieve a high yield.
4.4. Treatment effects on feeding potential of maize
Because the magnitudes of most of the differences in treatment effects on plant protein and fiber are inconsequential in relation to the expected feeding value for livestock, we limit discussion to effects of biological significance. Although leaf was of slightly better feeding value than stem, the low protein and high fiber characterize both as poor quality feeds. Thus, the most important treatment effects were on stem and leaf quantity rather than on quality.
The interaction of farm and cultivation year on grain protein could reflect a decreased quantity of soil nitrogen available in the third year of cultivation for farm 2. The mean grain protein levels
found in this study were greater than the 83–113 g kg 1(mean of
92 g kg 1) found byMendez-Montealvo et al. (2005), in a study
involving 20 diverse varieties of maize. The elevated grain protein levels found in our study may be related to the maize variety used, and offer benefits in grain consumption for both humans and livestock.
4.5. Feasibility of manure use
A limiting factor is the ability of smallholder farmers to access
enough manure to fertilize a typical area ofmilpa. In a survey of
sheep producersParsons et al. (2006)reported that the average
flock size of a smallholder farmer was 35 sheep, including 10 ewes of an average weight of 28 kg. A lactating 28 kg ewe, fed a diet of
700 g DM day 1Napier grass (Pennisetum purpureumSchumach.),
350 g DM day 1of Leucaena (Leucaena leucocephala(Lam.) de Wit),
350 g of manure per day (predictions based on the Cornell Net
Carbohydrate and Protein System for sheep as described inCannas
et al., 2004). For a flock of 10 ewes this equates to approximately 1280 kg of manure per year, enough manure to apply to 0.3 ha at
the 4 Mg ha 1(low) manure application rate used in this study.
These calculations only consider manure production from ewes, not the entire flock, and are only a guide to possible manure production rates. However, these predicted manure production rates are in the right order of magnitude, considering that an
average milpaarea is one hectare (Pascual, 2005), with a usual
range of 0.5–2.5 ha (Lopez-Forment, 1998), and that farmers might
only use manure on the better soils. In this study, manure was spread evenly across the plot, whereas farmers are more likely to place manure around the plants, potentially increasing its benefits. In addition, a doubling in yield per ha with manure use could in theory reduce the required production area by half, further increasing the likelihood that these farms produce enough manure
to fertilize amilpa.
A second consideration is the increase in labor required to collect, transport, and apply the manure. Feasibility depends on the distance between the location of the sheep corral and the field. It is obvious that farmer motivation to transport manure would
decrease with distance to the milpa. However, potential labor
savings due to a yield-increase driven reduction in land area and/or increased number of years of cultivation should also be considered.
Pascual (2005)reported a typical labor input of 420 h ha 1to clear
land for amilpa. Thus, a technology such as manure fertilization
that increases yield and reduces the amount of labor required for land clearing could result in improved household status.
Another consideration is the likelihood of farmers applying manure to land that they do not own. Producers may be averse to investing potentially valuable manure in land that they might not cultivate in the future. Formal land agreements usually exist that enable farmers to maintain control over a designated area of land.
For example,Pascual (2005)reported that in the municipality of
Hocaba´ (Yucata´n, Mexico) 88% of the milpa was cultivated on
communal land under the ejido system. Under this system, a
farmer is entitled to maintain use of the clearedmilpa. In addition,
there is a general preference for conversion of land under mature forest, rather than land with short fallow, reducing the likelihood that other farmers would desire cleared land. Other land tenancy
agreements less formal thanejidoalso exist and could provide a
disincentive for intensification.
4.6. Issues relating to herbicide use
The most commonly used herbicides in Yucata´n, paraquat (10
-dimethyl-4,40-bipyridinium) and 2,4-D, are applied after maize
emergence, reducing the success of companion cropping of squash
and beans (Caamal-Maldonado et al., 2001). Based on observations
made during this study, we hypothesize that a mid-season herbicide application may not have been necessary. A single effective application at planting may be sufficient, which would enable the traditional cultivation of companion crops. Use of
pre-emergence herbicides in Yucata´n was suggested bySprague et al.
(1978). However, it is not a common practice. Further experi-mentation with herbicide timing and rates would be worthwhile, particularly as the rates used in this experiment were deliberately high.
This study suggests that glyphosate was effective, and may provide a favorable alternative to 2,4-D and paraquat, both chemicals that should be handled with great care due to their
elevated toxicity (Extension Technology Network, 2009). Toxicity
of agricultural chemicals used in the region is particularly pertinent considering that most spraying is done without the use of protective gear.
Another issue relates to the potential for groundwater contamination of these herbicides. Because glyphosate and paraquat are highly absorbed to most soils they do not present a high risk of groundwater contamination, although incidents have
occurred (Extension Technology Network, 2009). 2,4-D has been
included in an EPA list of compounds that are likely to leach from the soil, and despite its short half-life in soils has been detected in
groundwater supplies (Extension Technology Network, 2009),
including in Yucata´n (Pacheco et al., 1997).
It is unclear how repeated herbicide use over time affects weed populations and species diversity. It is conceivable that with zero-tillage, continual herbicide use could exhaust the seed bank, thus reducing the need for chemicals over time. This could potentially
affect eventual successional return to forest following milpa
abandonment. However, tropical seed banks are generally assumed to be small, with a large proportion of viable seeds from
pioneer species (Skoglund, 1992). Miller (1999) found that in
Western Mexico the contribution of the seed bank to forest regeneration is limited due to the paucity of tree seeds in the seed pool, and that coppicing appears to be more important than
seedling establishment. Rico-Gray and Garcia-Franco (1992)
speculated that in Yucata´n following the colonization of initial fire-stimulated species, the development of coppicing from shoots and root stocks, and the arrival of arboreal species in the seed rain are important. If repeated cultivation practices reduced the capacity of trees to coppice, forest regeneration may be negatively affected, and thus further work on the effect of the length of the cultivation period on succession is needed.
4.7. Potential integration with other technologies
Caamal-Maldonado et al. (2001)demonstrated the benefits of
velvet bean (Mucuna pruriens Bak.) as a cover crop for weed
control. Velvet bean cultivation is compatible with weed control and manure application treatments, adds nitrogen to the soil, and
provides a valuable protein source for livestock (Castillo-Caamal
et al., 2003). Other practices such as the use of improved varieties, removal of rocks from selected areas with deeper soils, tilling and planting in rows, increasing plant densities, and applying animal manure have previously been combined to form the ‘intensive
milpa’ system (Lopez-Forment, 1998). Although this was success-ful in an experimental setting, adoption of the practice has been limited, mainly due to the initially large labor costs involved (Gu¨ndel, 1998). The treatments assessed in this study could face the same problems. However, the management changes are less
radical than those proposed for the ‘intensivemilpa’ of
Lopez-Forment (1998). Another problem with the ‘intensive milpa’ is that farmers do not generally eat velvet bean. In an integrated crop–livestock system sheep can consume the velvet bean,
resulting in improved animal weight gains (Castillo-Caamal et al.,
2003).
5. Conclusions
The study suggests that both enhanced weed pressure and
declining fertility are important factors for yield decline inmilpas.
Chemical weed control required much less labor than hand weeding, effectively reduced weed cover, and increased grain and biomass yield. Grass weeds were not problematic in the first year of cultivation. However, continued cultivation led to problems such as yield decline unless chemical control was used. With increasing cultivation years, chemical weed control was more effective than hand weed control in controlling herbaceous weeds. Manure fertilization increased grain and biomass yields. For first year plots, there was less variation in yield, but results were suggestive of small increases in grain yield with weed control and
manure application. In third and fourth years, high yields could only be achieved with a combination of manure and weed control. Maize stover quality was poor, and treatments had a greater effect on quantity (which increased with fertilization and weed control) than quality. The protein content of maize grain was high,
and was greatest in first yearmilpas.
Smallholder sheep flocks could theoretically provide a
suffi-cient quantity of manure to fertilize amilpa, potentially allowing
fertility to be maintained beyond the normal 2 years. Technologies that increase yield and maintain plots for a longer period have the
potential to change elements of the current milpa system.
Ultimately the success of such practices will depend on livelihood needs and aspirations of the households and the communities in
which they live (Burgers et al., 2005).
Acknowledgements
The authors would like to thank Leonardo Coco´m, A´ngel Pool, and Vı´ctor Casanova, who offered their land and time for the field experiments; and UADY students who helped with the field work, particularly Yuliana Herrera. The study was supported financially by Cornell University Department of Crop and Soil Sciences, a Richard Bradfield Research Award, an Andrew Mellon Student Research Grant, and funding from The Einaudi Center, The Latin American Studies Program, and CIIFAD.
References
Burgers, P., Ketterings, Q.M., Garrity, D.P., 2005. Fallow management strategies and issues in Southeast Asia. Agric. Ecosyst. Environ. 110, 1–13.
Caamal-Maldonado, J.A., Jimenez-Osornio, J.J., Torres-Barragan, A., Anaya, A.L., 2001. The use of allelopathic legume cover and mulch species for weed control in cropping systems. Agron. J. 93, 27–36.
Cannas, A., Tedeschi, L.O., Fox, D.G., Pell, A.N., van Soest, P.J., 2004. A mechanistic model for predicting the nutrient requirements and feed biological values for sheep. J. Anim. Sci. 82, 149–169.
Castillo-Caamal, J.B., Jimenez-Osornio, J.J., Lopez-Perez, A., Aguilar-Cordero, W., Castillo-Caamalm, A.M., 2003. Feeding Mucuna beans to small ruminants of Mayan farmers in the Yucata´n peninsula, Mexico. Trop. Subtrop. Agroecosyst. 1, 113–117.
Emerson, R.A., 1953. A preliminary survey of the milpa system of maize culture as practiced by the Maya Indians of the northern part of the Yucata´n Peninsula (1935). Ann. Mo. Bot. Gard. 40, 51–62.
Extension Technology Network, 2009. Extoxnet pesticide information profiles. http://pmep.cce.cornell.edu/profiles/extoxnet/index.html(site accessed April 27, 2009).
FAO-UNESCO, 1974. Soil map of the world at 1: 5 000 000. Legend, vol. 1. UNESCO, Paris, p. 62.
Food and Agriculture Organization, 2006. FAOSTAT data for sheep numbers, offtake, and production, 2000–2005.http://faostat.fao.org/site/340/default.aspx(site accessed March 20, 2006).
Gelderman, R.H., Beegle, D., 1998. Nitrate-nitrogen. In: Recommended Chemical Soil Test Procedures for the North Central Region. Missouri Agricultural Experi-ment Station, Columbia, MO, USA, pp. 17–18 (NCR Publication No. 221). Go´mez-Pompa, A., Flores, J.S., Sosa, V., 1987. The ‘pet kot’: a man-made tropical
forest of the Maya. Interciencia 12, 10–15.
Gonzalez-Iturbe, J.A., Olmsted, I., Tun-Dzul, F., 2002. Tropical dry forest recovery after long term Henequen (sisal,Agave fourcroydesLem.) plantation in northern Yucata´n, Mexico. Forest Ecol. Manag. 167, 67–82.
Gu¨ndel, S., 1998. Participatory innovation, development and diffusion: adoption and adaptation of introduced legumes in the traditional slash-and-burn peasant farming system in Yucata´n, Mexico. Deutsche Gesellschaft fu¨r Technische Zusammenarbeit (GTZ), Germany.
Ku Naal, R., 1992. La milpa Yucateca y sus innovaciones tecnolo´gicas. In: Zizumbo-Villareal, D., Rasmussen, C.H., Arias-Reyes, L.M., Teran-Contreras, S. (Eds.), La modernizacio´n de la milpa en Yucata´n: utopı´a o realidad. Centro de Investiga-cio´n Cientı´fica de Yucata´n, Me´rida, Me´xico, pp. 267–277.
Lopez-Forment, I.S., 1998. Changes in diversity in the process of milpa intensifica-tion in the henequen zone in Yucata´n, Mexico. In: Meeting of the Latin American Studies Association, Chicago, Illinois.
Lundell, C.L., 1934. Preliminary sketch of the phytogeography of the Yucata´n Peninsula. Contribut. Am. Archaeol. 12, 257–321.
Mariaca-Me´ndez, R., Herna´ndez-Xolocotzi, E., Casillo-Morales, A., Moguel-Ordo´n˜ez, E. 1995. Ana´lisis estadı´stico de una milpa experimental de ocho an˜os de cultivo continuo bajo roza-tumba-quema en Yucata´n, Me´xico. In: Herna´ndez-Xolo-cotzi, E., Bello-Baltazar, E., Levy-Tacher, S. (Eds.), La milpa en Yucata´n, Colegio de Postgraduados, Me´xico, pp. 339–368.
Mehlich, A., 1984. Mehlich 3 soil test extractant: a modification of Mehlich 2 extractant. Commun. Soil Sci. Plant Anal. 15, 1409–1416.
Mendez-Montealvo, G., Solorza-Feria, J., Vela´squez del Valle, M., Gomez-Montiel, N., Paredes-Lopez, O., Bello-Perez, L.A., 2005. Chemical composition and calori-metric characterization of hybrids and varieties of maize cultivated in Mexico. Agrociencia 39, 267–274.
Miller, P.M., 1999. Effects of deforestation on seed banks in a tropical deciduous forest of western Mexico. J. Trop. Ecol. 15, 179–188.
Miranda, F., 1958. Estudios acerca de la vegetacio´n. In: Beltran, E. (Ed.), Los recursos naturales del sureste y su aprovechamiento, vol. 2. Instituto Mexicano de Recursos Naturales Renovables, Me´xico DF, Me´xico, pp. 213–272.
Morley, S.G., 1981. El origen de la agricultura en el nuevo mundo. In: Perez-Toro, A., Morley, S.G., Hernandez-Xolocotzi, E., Varguez-Pasos, L.A. (Eds.), La milpa entre los Mayas de Yucata´n. Universidad de Yucata´n, Me´rida, pp. 1–28. Pacheco, S.J., Cabrera, S.A., Marin, L.E., 1997. Nitrate and 2,4-D herbicide in the Karst Aquifer of Yucatan, Mexico. In: International Conference on Advances in Groundwater Hydrology. American Institute of Hydrology, pp. 47–51. Parsons D., Caldero´n-Quintal, A., Nicholson, C.F., Blake, R.W., Lo´pez-Cervantes, C.,
Torres-Acosta, F., Ca´mara-Sarmiento, R., Rı´os-Arjona, G., 2006. Diagno´stico y necesidades de investigacio´n en los sistemas de produccio´n ovinas en Yucata´n. Universidad Auto´noma de Yucata´n.
Pascual, U., 2005. Land use intensification in slash-and-burn farming through improvements in technical efficiency. Ecol. Econ. 52, 497–511.
Pool-Novelo, L., Herna´ndez-Xolocotzi, E., 1995. Bases de la experimentacio´n agrı´-cola bajo roza-tumba-quema: el caso de la milpa 1. In: Herna´ndez-Xolocotzi, E., Bello-Baltazar, E., Levy-Tacher, S. (Eds.), La milpa en Yucata´n, Colegio de Postgraduados, Me´xico, pp. 313–337.
Reyes-Guerrero, D., Aguilar-Castillo, G., 1992. Intensificacio´n de la milpa en Yucata´n. In: Zizumbo-Villareal, D., Rasmussen, C.H., Arias-Reyes, L.M., Teran-Contreras, S. (Eds.), La modernizacio´n de la milpa en Yucata´n: utopı´a o realidad. Centro de Investigacio´n Cientı´fica de Yucata´n, Me´rida, Me´xico, pp. 347–358.
Rico-Gray, V., Garcia-Franco, J.G., 1992. Vegetation and soil seed bank of succes-sional stages in tropical lowland deciduous forest. J. Veg. Sci. 3, 617–624. SAS Institute, 2003. The SAS system. v. 9.1. SAS Inst., Cary, NC.
Shang, C., Tiessen, H., 2003. Soil organic C sequestration and stabilization in karstic soils of Yucata´n. Biogeochemistry 62, 177–196.
Skoglund, J., 1992. The role of seed banks in vegetation dynamics and restoration of dry tropical ecosystems. J. Veg. Sci. 3, 357–360.
Sprague, M.A., Hanna, W.J., Chappell, W.E., 1978. Alternatives to monoculture of henequen in Yucata´n: the agriculture, climate, soil, and weed control. Inter-ciencia 3, 285–290.
Steggerda, M., 1941. Maya Indians of Yucata´n. Carnegie Institution of Washington, Washington, DC (Publication #531).
Storer, D.A., 1984. A high sample volume ashing procedure for determination of soil organic matter. Commun. Soil. Sci. Plant Anal. 15, 759–772.
Teran, S., Rasmussen, C.H., 1995. Genetic diversity and agricultural strategy in 16th century and present-day Yucatecan Milpa Agriculture. Biodivers. Conserv. 4, 363–381.
Trejo-Va´zquez, I., 1999. El clima de la selva baja caducifolia en Me´xico. Investiga-ciones Geogra´ficas 39, 40–52.
Turner II, B.L., Klepeis, P., Schneider, L.C., 2003. Three millennia in the Southern Yucata´n Peninsula: implications for occupancy, use, and carrying capacity. In: Gomez-Pompa, A., Allen, M.F., Feddick, S.L., Jimenez-Osornio, J.J. (Eds.), The Lowland Maya Area, Three Millennia at the Human-wildland Interface. Food Products Press, Binghamton, NY, pp. 361–387.
van Es, H., van Es, C., 1993. The spatial nature of randomization and its effects on outcome of field experiments. Agron. J. 85, 420–428.
van Es, H., Gomes, C., Sellmann, M., van Es, C., 2007. Spatially-balanced complete block designs for field experiments. Geoderma 140, 346–352.
van Soest, P.J., Robertson, J.B., Lewis, B.A., 1991. Methods for dietary fiber, neutral detergent fiber, and nonstarch polysaccharides in relation to animal nutrition. J. Dairy Sci. 74, 3583–3597.