Visualization of Information Based on Tweets from
Meteorological, Climatological, and Geophysical
Agency: BMKG
Mira Chandra Kirana1*), Amir2, Muhammad Nashrullah3 1,2,3Informatics Engineering Department, Politeknik Negeri Batam
1,2,3Jl. Ahmad Yani, Tlk. Tering, Batam Kota, Kota Batam, Kepulauan Riau 29461, Indonesia
email: 1[email protected], 2[email protected], 3[email protected]
Received: 30 Maret 2018; Revised: 12 Mei 2018; Accepted: 14 Mei 2018 Copyright ©2018 Politeknik Harapan Bersama Tegal. All rights reserved
Abstract Indonesia is a country with high rate of natural disaster, so any information about early warning of natural disaster are very important. Social media such as Twitter become one of tools for spreading information about natural disaster warning from account of Meteorology, Climatology and Geophysics Agency (BMKG), therefore, the effectiveness of this kind of method for providing information have not known yet. The statement becomes the reason that the visualization is needed to analyze the information spread of natural disaster early warning with Twitter. This study is performed in 3 steps, which is retrieving, preprocessing then visualization. Retrieving process is used to get the tweet data of BMKG account in twitter then save into database, while preprocessing is done to process tweet data that has been saved in database by grouping the data according to the category, which includes Meteorology, Climatology, and Geophysics according to existing keyword, also reduce tweet data that is unimportant like BMKG's reply tweet toward other user's question. Visualization stage uses the result of preprocessing data into line chart graphic, bar chart and pie chart. Highest information spreading from BMKG tweet happened in Geophysics at March with 25987 re-tweets, while the highest peak happened at 2 March 2016 with information about 8.3 SR earth quake in Mentawai islands, West Sumatera with total of 6145 re-tweets, dengan totl 6145 re-tweets.
Abstrak Indonesia adalah sebuah negara dengan tingkat bencana alam yang tinggi, sehingga setiap informasi tentang peringatan dini bencana alam sangat penting. Media sosial seperti Twitter menjadi salah satu media untuk menyebarkan informasi yang berasal dari Badan Meteorologi Klimatologi dan Geofisika (BMKG), oleh karena itu keefektifan metode semacam ini untuk memberikan informasi belum dapat diketahui. Alasan tersebut menjadi alasan bahwa penyebaran peringatan bencana alam dengan twitter. Penelitian ini dilakukan melalui tiga tahapan, yaitu retrieving, preprocessing, kemudian visualization. Proses retrieving dilakukan untuk mendapatkan data tweet dari akun BMKG di twitter kemudian disimpan dalam database, sedangkan preprocessing dilakukan untuk mengolah data tweet yang telah disimpan dalam database dengan mengelompokan data sesuai dengan kategori, yang meliputi meteorologi, klimtologi, dan geofisika menurut kata kunci yang ada, serta
mengurangi data tweet yang tidak penting seperti tweet balasan BMKG ke pertanyaan pengguna lain. Tahap visualisasi menggunakan hasil preprocessing data menjadi grafik charts, bar charts dan pie charts. Penyebaran informasi tertinggi dari tweet BMKG terjadi di Geophysics pada bullan Maret dengan 25987 re-twwets
Keywords Natural disaster, Twitter, Visualization, warning.
I. INTRODUCTION
Indonesia is a country that consists of several large islands and thousands of small islands, where there is a series of active volcanoes. It can trigger the occurrence of various natural disasters such as volcanic eruption, tsunami, and earthquakes [1]. The changing nature of nature also triggers the occurrence of many natural disasters which are the result of various factors, partly the result of human actions that do not preserve nature.
One of the biggest natural disasters in Indonesia is the Aceh Earthquake and Tsunami that occurred on December 26, 2004 where approximately 500,000 lives were not helped [2] [3]. One of the factors causing swallowed natural disaster victims is due to the lack of information on early warning of natural disasters and public awareness of warning information.
In Indonesia there is an institution that performs governmental tasks in the field of meteorology, climatology, air quality and geophysics namely the Meteorology, Climatology and Geophysics Agency (BMKG), where one of the tasks is to deliver information and early warning to the community about natural disasters that will Occurs due to meteorological, climatological, and geophysical factors [4]. Early warning of natural disasters is a warning to inform the public about natural disasters that will occur without delay and simultaneously through several channels [5].
Seeing the development of the times, the information spread through technology today is getting easier and faster. One way to spread information through technology today is through social media [6]. The development of social media today is so rapid, so easily users can share information, *) Corresponding author: Mira Chandra Kirana
communicate. It's so easy to share information so that information dissemination can happen quickly.
Dissemination of information is an important aspect that can accelerate the achievement of goals [7]. Various efforts made BMKG to disseminate information early warning against natural disasters have been done, one of which is through social media twitter.
Social media twitter can help BMKG in disseminating information early warning against natural disasters because the number of twitter users in Indonesia can be said very much and is ranked 5th largest in the world [8]. Based on data from PT Bakrie Telecom, Indonesia has 19.5 million Twitter users out of a total of 500 million global users [9].
By tweeting the news of a predicted natural disaster, people can make preparations for self-preservation and possessions as much as possible.
So it is necessary to visualize BMKG tweet information distribution statistics on twitter. BMKG tweet information distribution statistics on twitter can be used for certain purposes such as distribution level analysis, because the statistics in the form of data set have been neatly arranged in a list or graph.
Exploring or analyzing data is important but difficult to do if the data is large, therefore visualizing the information can help solve the problem [10]. Data mining visualization is very useful for exploring and analyzing data as needed [11], [12].
Data visualization is the process of changing the form of writing data or numbers into the form of meaningful images. The reason why visualization helps in data mining because the human brain is very effective to understand in the form of graphic images. Before doing the visualization will be categorization of data into several categories (Meteorology, Climatology and Geophysics) in advance so that data can be more easily understood.
II. RELATEDWORKS
Some researchers focused to build early warning system [5]. The other researcher focused on how to build visualization on large data [10]. The other researcher focused on how to classify the information and visualization the data based on the data type [11].
III. METHODOLOGY
The research is divided into three stages: data retrieval, prepossessing and data presentation. At the stage of data retrieval steps taken is to take data tweet BMKG on twitter account using python programming language [13] and help library tweepy then in the save into the database. At the prepossessing stage of the data step that is done is prepossessing data that classifies data into several groups of data retrieving results using python programming language and then stored into the database [14][15]. Data are grouped according to similarity of data based on tweet contents. Grouping done in the divide into several categories namely category Meteorology, Climatology and Geophysics. While at the stage of data presentation steps taken is to take prepossessing data that has been stored in the database at the prepossessing stage of the data and then visualized by category. Visualization is done with the help of j-query morris.js library to form a graph.
Figure. 1 Overall Process Stage
START
Retrieving Data
END BMKG Account Tweet Data
Save to Database
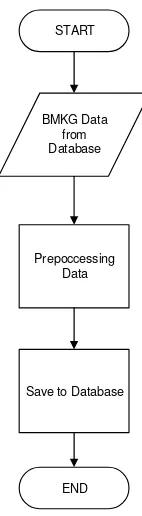
Figure. 2 Data Retrieval Stage
START
BMKG Data from Database
Prepoccessing Data
END Save to Database
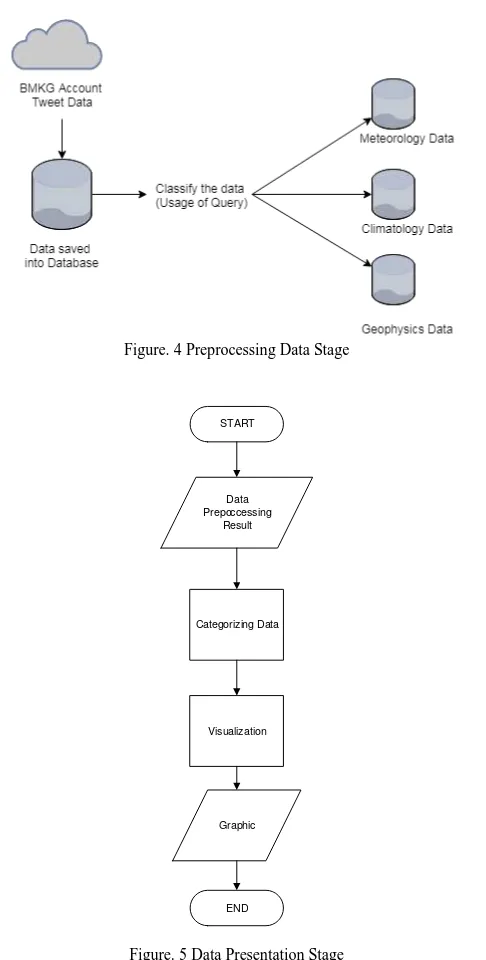
Figure 1 shows the overall stage done in the research process from the data retrieval phase, prepossessing the data until the data presentation stage. Figure 2 shows the stage in tweet data retrieval. At this stage is done taking data from BMKG account on twitter then stored into the database. Figure 3 shows the stage in prepossessing data tweet. At the prepossessing stage of the data step that is done is prepossessing data that grouping data into several groups from the results of data retrieving then stored into the database. Figure 4 shows the process classification the data using query into several group, which is Meteorology data, Climatology data and Geophysics data. Figure 5 shows the stage in tweet data presentation. The first step taken at the data presentation stage is to take the prepossessing data that has been stored in the database at the prepossessing stage of the data and then visualized by category into the form of the graph.
Figure. 4 Preprocessing Data Stage
START
Data Prepoccessing
Result
Categorizing Data
END Visualization
Graphic
Figure. 5 Data Presentation Stage
Algorithm 1 Classify Process 1. Start
2. Get tweets from BMKG then saved to database 3. Empty table prepossessing
4. Get keyword Meteorological, Climatological, and Geophysical from table category
5. Get data from table tweet which is match to keyword 6. Save result to table prepossessing with new label 7. End
IV. RESULTSANDDISCUSSION A. Data Retrieval And Analysis
The steps performed for data processing and data analysis are as follows:
1) Retrieve data tweets stored in the database
2) Preposessing data tweets that divide the data into several groGetups according to the similarity of data based on tweet content. Grouping is divided into categories ie Meteorology, Climatology and Geophysics. The prepossessing process also uses data reduction techniques to remove unnecessary data such as tweet data which is a reply from BMKG to other users on twitter.
3) Prepossessing data is done with python scripts that use sql syntax to group tweet data based on tweet content containing certain keywords and not reply BMKG tweet to other users, keywords used like for climatology category contains the word weather, rain, climate, typhoon , Storms, etc.
4) Visualization of data by changing the results of prepossessing data that has been grouped into graphical form. Visualization is done with the help of jquery library morris.js
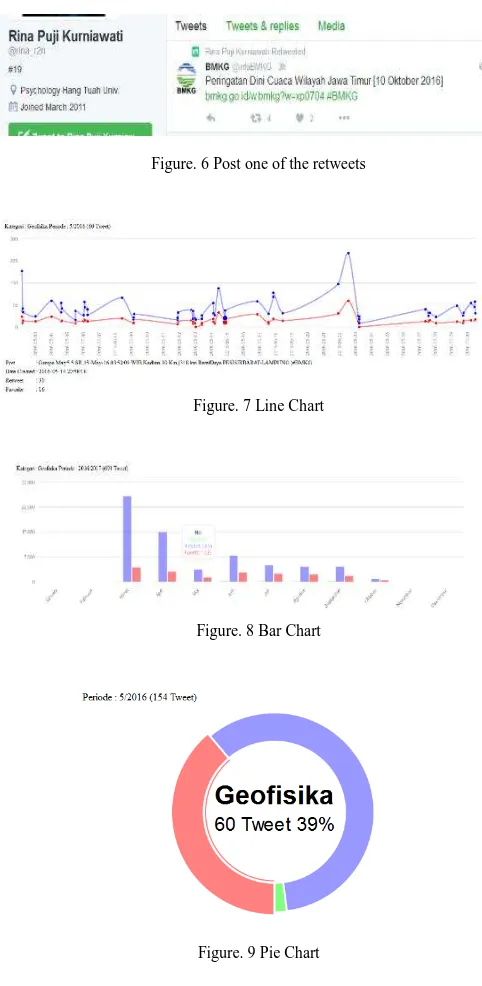
5) The visualization result is graphic line chart, bar chart and pie chart. Graphical results there are supporting variables such as post content, data period.
Chart line chart explains the spread of BMKG tweet data on twitter by category (Meteorology / Climatology / Geophysics). Period of every day on certain month and year period.
Bar chart chart explains the spread of BMKG tweet data on twitter by category (Meteorology / Climatology / Geophysics). Duration of 12 months in certain period of year.
Chart pie chart explains the spread of BMKG tweet data on twitter based on 3 categories (Meteorology, Climatology and Geophysics). Period of month in certain period of year. 6) From the graph can be analyzed comparison of BMKG
information dissemination on twitter
The procedures that can be used to analyze from the resulting graphs such as:
1) Compare the information distribution of each category on a monthly basis.
2) Knowing the amount of information dissemination each post
3) Know the contents of posts that have a certain number of deployments.
As for several ways that are done to ensure the validity and reliability of data such as comparing data obtained using python script that is created with data in direct access to BMKG account on twitter manually.
Figure 6 shows the examples of tweet posts from BMKG on twitter and the contents of tweets, the number of re-tweets, the number of favorites and the date the tweet was made.
Figure. 6 Post one of the retweets
Figure. 7 Line Chart
Figure. 8 Bar Chart
Figure. 9 Pie Chart
B. Data Presentation
Presentation of data used is visualize data into graphic form so that user more easy to understand. The presentation of data visualization is shown on figure 7, 8 and 9 by Line Chart, Bar Chart and Pie Chart in the period date until May 2016. The visualization results with certain categories and periods of the month/year. In this visualization when the mouse hovers to one of the points in the graph, the graphic will appear information related to the point in the hover (such as the contents of the post, the date of posting in the publication, the number of re-tweets and the number of
favorites). Visual variables are used like colors (differentiate between re-tweets and favorites), high low graphs and large small spherical graphs (differentiate between re-tweets and favorite).
C. Discussion
Based on the implementation and testing conducted to produce some important points against the dissemination of BMKG information on twitter, among others:
1) From March to November of 2016: the highest peak of BMKG information dissemination on twitter with Meteorology category was in July with tweet 2 and re-tweet 249 which has increased since May 2016.
Figure. 10 Visualization of Meteorology Category in 2016
Figure. 11 Visualization of Climatology Category in 2016
Figure. 12 Visualization Result of 2016 Geophysical Category
Visualization of meteorological category in the period 2016 as figure 10 could be concluded that the dissemination of BMKG information on twitter on the category and period is the highest rate in July.
5482 re-tweets. Dissemination of information in Climatology category from March to November 2016 level Its distribution is stable because of the increase and decrease not so far every month. Visualization of climatology category in the period 2016 that shown in figure 11 can be concluded that the dissemination of BMKG information on twitter on the category and period of the highest spread rate in September.
3) March to November 2016: is the highest peak of BMKG information dissemination on twitter with Geophysics category was in March with 66 tweets and 25,087 re-tweets. Dissemination of information in this Geophysics category shows drastic decline from March until November than performed the increase. Visualization of geophysical category in figure 12, the period of 2016 concluded that the dissemination of BMKG information on twitter on the category and period is the highest spread rate in March.
V. CONCLUSION
Spreading of BMKG tweet information on twitter in 2016 period March-November shows that the Meteorological category the highest peak of information dissemination occurred in July, with the number of tweets and 249 re-tweet. Then, the climatological category has the highest peak in September, with the number of 657 tweets and 5450 re-tweet. On the other hand, Geophysical category has the highest peak in March about 66 tweets and 25987 re-tweet.
Based on the analysis can be concluded the highest level of information dissemination twitter BMKG on twitter occurred in the Geophysics category in March about 25987 re-tweet with information about the earthquake in Indonesia whose peak occurred on 02-March-2016 with scale 8.3 SR in the Mentawai Islands of western Sumatra as much 6145 re-tweet.
REFERENCES
[1] Indonesia-investments.com, Indonesia Investments, https://www.indonesia-investments.com/business/risks/natural-disasters/item243?
[2] A. T. Chatfield and U. Brajawidagda, “Twitter tsunami early warning
network: A social network analysis of twitter information flows,” in
ACIS 2012 : Proceedings of the 23rd Australasian Conference on Information Systems, 2012.
[3] M. Sugimoto, H. Iemura, and R. Shaw, “Tsunami height poles and disaster awareness: Memory, education and awareness of disaster on
the reconstruction for resilient city in Banda Aceh, Indonesia,” Disaster
Prev. Manag., vol. 19, no. 5, pp. 527–540, 2010.
[4] BMKG.go.id, Badan Metereologi, Klimatologi, dan Geofisika, https://www.bmkg.go.id/
[5] A. T. Chatfield and U. Brajawidagda, “Twitter early tsunami warning
system: A case study in Indonesia’s natural disaster management,”
Proc. Annu. Hawaii Int. Conf. Syst. Sci., pp. 2050–2060, 2013. [6] Peary, B. D., Shaw, R., & Takeuchi, Y., “Utilization of social media in
the east Japan earthquake and tsunami and its effectiveness”. Journal of Natural Disaster Science, vol. 34(1), pp. 3-18, 2012.
[7] A. D. Laksono, “Melalui Jejaring Sosial ( Studi Kasus Pada ‘ Forum
Jejaring Peduli Aids ’),” vol. 14, no. 4, pp. 358–365, 2011.
[8] Jakartaglobe.id, The Jakarta Globe, http://jakartaglobe.id/news/indonesia-fifth-largest-country-in-terms-of-twitter-users/
[9] Kominfo.go.id, Kementrian Komunikasi dan Informatika Republik Indonesia,
https://kominfo.go.id/index.php/content/detail/3415/Kominfo+%3A+Pe ngguna+Internet+di+Indonesia+63+Juta+Orang/0/berita_satker [10] D. A. Keim, “Information visualization and visual data mining,” IEEE
Trans. Vis. Comput. Graph., vol. 8, no. 1, pp. 1–8, 2002.
[11] D. a Keim and H.-P. Kriegel, “Visualization techniques for mining
large databases: a comparison,” IEEE Trans. Knowl. Data Eng., vol. 8,
no. 6, pp. 923–938, 1996.
[12] S. Mulyana, E. Winarko, P. Studi, I. Komputer, and U. G. Mada,
“Teknik Visualisasi Dalam Data Mining,” Seminar Nasional Informatika 2009, pp. 100–106, 2009.
[13] S. Berkah, “Bahasa Pemrograman Python Di Platform Gnu/Linux,” Ultimatics, Universitas Multimedia Nusantara, Tanggerang, Indonesia. 2009.
[14] H. Dzacko, Basis Data (Database). Mangosoft. 2007.