Deutsches Institut für Wirtschaftsforschung
www.diw.de
Olaf J. de Groot • Tilman Brück •
Carlos Bozzoli
Berlin, November 2009
How Many Bucks in a Bang:
On the Estimation of the
Economic Costs of Conflict
948
Opinions expressed in this paper are those of the author and do not necessarily reflect views of the institute.
IMPRESSUM
© DIW Berlin, 2009
DIW Berlin
German Institute for Economic Research Mohrenstr. 58
10117 Berlin
Tel. +49 (30) 897 89-0 Fax +49 (30) 897 89-200
http://www.diw.de
ISSN print edition 1433-0210 ISSN electronic edition 1619-4535
Available for free downloading from the DIW Berlin website.
Discussion Papers of DIW Berlin are indexed in RePEc and SSRN. Papers can be downloaded free of charge from the following websites:
http://www.diw.de/english/products/publications/discussion_papers/27539.html http://ideas.repec.org/s/diw/diwwpp.html
How many Bucks in a Bang:
On the Estimation of the Economic Costs of Conflict
*Olaf J. de Groot
*, Tilman Brück, Carlos Bozzoli
DIW Berlin, Department of International Economics
Abstract
The estimation of the costs of conflict is currently receiving a lot of attention in the literature. This paper aims to give a thorough overview of the existing literature, first by addressing the history of case studies that address conflict costs and second by looking at the existing body of cross-country analyses for conflict costs. In addition to the existing cross-country literature, a number of studies that only concern themselves with particular elements of conflict costs are included as well.
In the end, this paper combines the insights from these previous analyses to explore how much room there is to further improve the existing studies. Specific recommendations are given how to proceed with the development of the field of conflict cost measurement.
Keywords: Conflict, costs of conflict, case studies
JEL classification: C20, F50, O11
*
We would like to gratefully acknowledge the funding provided by the German Foundation for Peace Research (DSF), through the Global Economic Costs of Conflict project. Additionally, we want to thank Zahbia Yousuf for her useful comments.
*
1. Introduction
The estimation of the costs of conflict is a relatively new field of research. Whilst the
discussion of the relationship between economics and conflict has a long history, this has
focused mainly on the creation of the economic capacity to wage war (e.g. Von Clausewitz,
1812) and the question as to whether the existence of adverse economic conditions will
improve the probability of conflict (Lenin, 1916). The analysis of the economic consequences
of violent conflict from a non-strategic perspective is more recent. This chapter aims to give a
thorough overview of the existing literature in conflict cost analysis. We are particularly
concerned with previously developed case studies and studies that look at cost sources not
included in those case studies. In the end, we aim to discuss the missing links in the literature
and suggest a future direction for research that is able to include the shortcomings we find.
This is a broad field that covers a wide range of topics and methodologies. There are several
noteworthy case studies that estimate the direct costs of specific conflicts, using a variety of
different techniques. One conclusion from these studies is that it is difficult to indicate what
the consequences are for a typical conflict, as the cost estimations vary wildly. Indeed, even
between different studies that address the costs of one particular conflict, the variability of
these cost estimations is much larger than one might expect beforehand1. This is due to the
difficulty of quantifying many of the costs involved, as well as the difficulty of choosing
which costs to include and which not to. One overlapping feature of most studies is that they
tend to express the economic consequences of conflict as a proportion of Gross Domestic
Product (GDP). Secondly, many case studies only include effects that are directly attributable
to the conflict and omit many non-direct effects that may significantly increase the burden of
conflict. Below, we discuss some of these studies and compare both the methodologies and
the outcomes. A thorough overview of the different studies is provided by Bozzoli et al.
(2008).
In addition to the case studies that look at the direct effects of conflict on the state of the
economy, there is another body of literature that addresses the indirect costs of conflict. These
are costs that are effectuated through other channels, and are often difficult to express in
monetary terms. This literature includes analyses of the effects of conflict on education,
inequality and investment. Additionally, there is another body of work that analyses the costs
of conflict for neighbouring countries and the influence of military expenditure on GDP.
1
In the following section, we discuss a number of case studies and compare their
methodologies and conclusions. We take a specific look at Sri Lanka to be able to compare
the methodologies and results regarding a specific conflict. In section 3, we examine the
literature on indirect effects, addressing in particular the influence of military expenditures on
economic growth, the international and intertemporal spillovers of conflict that affect
economic growth and the way human capital is affected by violent conflict. In the fourth
section, we address what should be the direction of future research and in the final section, we
conclude.
2. Case Studies for Direct Conflict Effects
In the literature on direct conflict costs, there are two main lines of research: one employs
so-called accounting techniques, while the other one uses counterfactual analysis (Lindgren,
2006). The first tries to calculate the total value of goods destroyed as a result of conflict,
whereas the latter estimates a conflict-free counterfactual outcome and considers the gap
between such counterfactual and the actual situation as a cost. The basic premise of
counterfactual analysis is that the conflict region is explicitly or implicitly artificially
replicated while leaving out the actual conflict. This can, for example, be done by generating
an artificial country on basis of conflict-free countries elsewhere, or by using underlying
economic fundamentals to estimate what the economic performance would have been like in
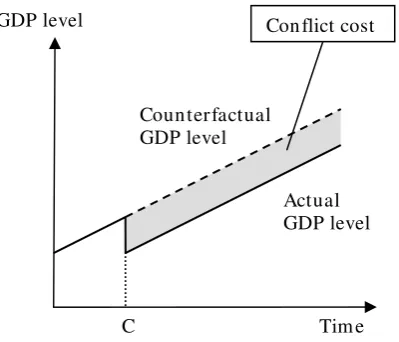
absence of conflict. Figure 1 shows an example country’s level of GDP over time, where at
time C a conflict occurs and GDP decreases (the solid line). The counterfactual analysis
attempts to replicate the country’s GDP in absence of conflict (the dotted line). In this
example, the economic costs of conflict in terms of GDP are equal to the shaded area between
the true and artificial outcomes. While this example is highly simplified, it provides an
illustration of the concept of counterfactual analysis.
<Figure 1 approximately here>
One of the first major case studies that looked at conflict costs is FitzGerald’s (1987) analysis
of the costs incurred during the Nicaragua conflict. He uses time series analysis for estimating
the overall costs of the conflict, as well as separate regressions to analyse the disaggregated
elements. FitzGerald looks at five years (1981-1985) and concludes that the total cost
resulting from the Nicaragua conflict amounts to 2.09 billion US$ (expressed in constant 2000
GDP for each year). The disaggregation shows that the output of the primary and secondary
sectors declines by around ten percent, export revenues decrease by up to thirty percent, the
fiscal deficit goes up by five percentage points of GDP and the annual inflation rate increases
by thirteen percentage points. However, it is noteworthy that other studies yield entirely
different results, varying between 0.08 billion US$ (Stewart et al., 2001) and 1.13 billion US$
(according to a 1988 study by the Instituto Latinoamericano de Planificacion Economic y
Social, as reported by DiAddario, 1997) per year, expressed in constant 2000 dollars.
Another worthwhile contribution comes from Nordhaus (2002) who uses both accounting and
counterfactuals when looking (ex ante) at the potential costs of a war in Iraq. He addresses
only the costs for the United States, and includes a) the direct military spending, b) the costs
of occupation and peacekeeping, c) reconstruction expenditures, d) humanitarian assistance
transfers, e) the impact on the oil markets and f) the macroeconomic impact in the USA. In
addition, it should be noted that his figures for a) and b) also include the associated healthcare
costs. Using two scenarios, the short and favourable one and the protracted and unfavourable
one, he estimates the potential costs to range from $121 to $1,595 billion, expressed in 2002
dollars. Naturally, Bilmes and Stiglitz (2008) have since shown that this was a gross
underestimation of the final costs, with their estimate that the total military costs of the
invasion and the occupation had already exceeded $3,000 billion; with Nordhaus estimating it
to be $640 billion even in the most unfavourable scenario. Bilmes and Stiglitz had the
advantage of hindsight for their calculations and include slightly different factors than
Nordhaus did, such as military pension costs and future debt servicing, but the difference is
still remarkable.
Lopez and Wodon (2005) take a different approach to the concept of counterfactual analysis.
They analyse a Rwandan GDP time series to look for the presence of outliers (using methods
based on the work by Tsay, 1988). If any outliers that are found can be associated with the
conflict, they argue it is possible to approximate Rwandan growth in the absence of conflict.
They argue outliers can be additive (single shot), lasting (level shift) or transitory. The three
different regression models used by Lopez and Wodon all conclude that 1994 contains a
negative outlier and 1995 contains a positive one. The negative shock amounts to between
37.4 and 39.9% of GDP, while the positive shock is between 28.9 and 31.0% and on basis of
these numbers, the authors conclude that in the absence of conflict, the level of GDP in 2001
would have been between 25 and 30 percent higher than it was in reality.
Finally, Abadie and Gerdeazabal (2003) use the counterfactual approach to look at the costs in
authors, in the sense that they formalise the foundation of their counterfactual region more
rigorously. They argue that the Basque conflict in Spain is limited to the Basque Region,
which they back up with convincing evidence. Following that argument, non-Basque regions
in Spain can thus be used as alternative regions in which no conflict takes place. However, as
there are obviously many differences between the different regions, in addition to the
presence of conflict in the Basque Region, this cannot be done straightforwardly. Instead,
Abadie and Gardeazabal match the pre-conflict economic fundamentals of the Basque Region
with a combination of the characteristics of other regions, in order to recreate a synthetic
pre-conflict Basque Region. They do so by searching for a combination of other regions that
minimises the difference between the weighed average of the fundamentals of those other
regions and those of the Basque Region2. This way, the authors are able to set up an artificial
region that has the same pre-conflict underlying characteristics as the true Basque Region.
The underlying assumption therefore is that, in the absence of conflict, the macroeconomic
evolution of the Basque region would be that of the artificial counterfactual. When comparing
the true Basque Region (in which conflict takes place) and the artificial (conflict-free) one, the
true Basque Region lags by approximately 10% of GDP compared to the artificial region.
Further evidence can be found in the fact that large increases in the GDP gap are associated
with increases in the intensity of the conflict.
Sri Lanka Studies
Sri Lanka is often used by conflict cost researchers due to the quality of the available data
and the intense conflict it has suffered. In this section, we discuss a number of these studies,
in order to compare how different authors use different methodologies to approach the same
problem. Additionally, the outcomes of the different contributions illustrate the large variation
in final conclusions.
Since 23 July 1983, Sri Lanka has been involved in a civil conflict causing an estimated
75,000 deaths (Fisas, 2009), in addition to numerous injuries and resulting disabilities. The
Western perception has been that this was a conflict only between the government and the
Tamil Tigers, who strived to establish their own independent nation. However, at the same
time, another high-intensity conflict took place as well between the government and the
Janatha Vimukthi Peramuna (Peoples’ Liberation Front). During the last fifteen years, five
different studies have been conducted to analyse the economic costs of the combination of
these two conflicts.
2 It turns out that the optimal synthetic region is formed by a combination of Catalunya and Madrid. All other
Methodology
Two of these studies use an economic model to estimate only the effect of the conflict on
GDP, while the other studies use a mixed methodological framework. A comparison of the
results of the different papers requires a comparison of the methodologies employed and of
which costs the authors aim to include.
Grobar and Gnanaselvam (1993) develop their model with the hypothesis in mind that
missing investment due to increased military expenditures hinders economic development.
Their basic idea is that military expenditures crowd out capital investment. In the long run,
this reduces the capital stock to a level below its peacetime potential. Using time series data,
the authors estimate coefficients for the impact of military expenditure on the investment rate.
Next, this coefficient is multiplied with the military expenditure increase during the conflict
and this is finally multiplied with an incremental-capital-output-ratio (ICOR) to measure the
(negative) GDP-growth-effect of lost capital investment. The ICOR is calculated as the
average of this coefficient during the decade before the initiation of the conflict. One
important caveat of this approach is its omission of the destruction of capital due to the
conflict. This would exacerbate the capital stock gap and thus increase the actual costs of the
conflict.
Harris (1997) also concentrates on savings and its impacts. He uses survey data from before
the onset of the conflict and up to a decade after the onset to estimate the difference between
ideal and actual consumption rates and links that back to the savings rate. He then uses the
previously mentioned ICOR to calculate the impact the conflict has on GDP through the
capital stock. This contribution suffers from a similar caveat as the previously mentioned
study by Grobar and Gnanaselvam’s (1993).
The three other studies use a larger number of channels through which conflict costs
accumulate. For example, Richardson and Samarashinghe (1991) account for the destruction
of physical infrastructure, costs for providing help to refugees, costs of migration (travel
tickets) and international capital migration. In addition to these accounting tabulations, they
also estimate forgone GDP growth by performing a counterfactual analysis using projections
of pre-conflict trends.
Kelegama (1999) calculates the costs of forgone investment and production opportunities
based on military expenditure in a similar way to Grobar and Gnanaselvam (1993). In
addition to that, he considers temporary losses in production and tourism as a result of
destruction and insecurity by calculating the service value of destroyed assets as well as
into account the rehabilitation costs of displaced persons: the costs of relief assistance, in
particular.
Finally, Arunatilake et al. (2001) include direct costs like war-related expenditure, and add
estimations using time series regressions based on a differentiated forgone-investment model.
In contrast with Grobar and Gananaselvam (1993) and Kelegama (1999), they use a
regression analysis to re-estimate separate values for ICOR for each year. Other regressions
are used to estimate tourism losses and forgone foreign investment. Lost lives and injuries are
calculated as forgone labour force, calculated using average unskilled labour wages multiplied
by the forecasted working-life expectancy.
Results
The results of the aforementioned studies can be found in table 1. In order to increase
comparability between the studies we have recalculated all the results in terms of costs per
year and expressed in constant 2000 US$.
<Table 1 approximately here>
Table 1 clearly shows there is a large variation in the estimated economic costs of the mass
violent conflict in Sri Lanka. In fact, the lowest and highest estimates differ by a multiple of
six. Where disaggregated data is available, the share that is attributed to forgone growth is
remarkable. This suggests that using only GDP time series may capture most losses due to
conflict. While the lack of a coherent framework of analysis makes a comparison across
studies difficult, the most recent study (Arunatilake et al., 2001) GDP losses due to forgone
investment and tourism account for more nearly 60% of the total costs.
3. Indirect Effects
Whilst the previous section looked at studies that aim to analyse conflict costs in a
comprehensive manner, this section focuses on studies that highlight specific channels of
conflict consequences. These are mostly studies that analyse how conflict affects a particular
attribute of economic wellbeing. These studies are highly relevant, as they highlight some of
the channels that may be underrepresented in previous analyses and that deserve to be brought
to our attention in a careful manner. It conveniently shows where some of the previous studies
may be lacking and suggests methods to fill the gap.
However, one must continue to keep in mind that one risks double-counting when addressing
channels separately and simply aggregate these separate costs. The literature focusing on
specific channels simply indicates what the nature is of the costs that one should integrate in a
unified framework of analysis.
The relevant papers are discussed in four different subsections. First of all, the literature on
military expenditure is examined. Previous contributions have focused on the economic costs
associated with military expenditure (such as the crowding out of investment), but we will see
that there are other elements that need to be taken into account as well. Second, only a small
number of papers have addressed the question whether conflict affects growth in other
countries as well. This issue of international spillovers can become highly relevant in terms of
total costs when conflict takes place in extremely poor countries (where even a significant
percentage of GDP may still be only a small cost), neighboured by wealthy ones. Third, the
intertemporal growth effects are discussed in conflict countries, looking at how
post-conflict development can be highly path-dependent and costly. Finally, there will be an
examination of studies that address channels through which human capital is affected by the
presence of conflict, by impacting on health and education. These are issues that are not
necessarily easy to express in monetary terms, but are important to include in any conflict cost
calculation.
Military expenditure
Smith (1989) estimates a demand function for military expenditure in the United Kingdom.
He argues in favour of the non-orthodox methodology of guesstimation to see which factors
are the most important. Among the most relevant factors, according to Smith, are political
factors, the military expenditures of the United States and the USSR and several measures of
inflation. Analyses like Smith's are highly relevant, as the costs of building and maintaining
militaries can have a major impact on the total cost of conflict. This was also illustrated by the
work of Bilmes and Stiglitz (2008), who estimated the total cumulative military costs of the
Iraq war to reached US$3,000 billion by 2008.
Dunne and Perlo-Freeman (2003) have a similar aim when estimating a military expenditure
function for a cross-section of developing countries. An important element in their analysis is
the idea of a security web, which represents the military expenditures of nearby nations that
can be considered either enemies or allies. They conclude that in the period after the Cold
War, increased military expenditure in the surrounding region, increased expenditure by
potential enemies, being involved in a large civil war and being located in the Middle East or
in proximity to China are factors that increase the military burden. Population size and
Neither Smith (1989), nor Dunne and Perlo-Freeman (2003) attempt to analyse the influence
of military expenditure on the growth of GDP, but there are authors who have attempted to do
so. Table 2 shows the different channels through which it is hypothesised that conflict can
influence the economy. It is important to note that there are both positive and negative
channels and it is not a priori clear whether the net effect should be positive or negative. The
earliest literature argued that the positive effects from military expenditures prevailed (Benoit,
1973), but recent literature often reveals the opposite (e.g. Dunne and Vougas, 1999).
<Table 2 approximately here>
A classic example with a cross-country point-of-view is by Cappelen et al. (1984), who use a
panel of OECD countries to conclude that defence spending has a generally negative effect on
economic growth. Interestingly, they find that this result is the outcome of two opposite
effects, where the negative effect on investment through crowding out mostly outweighs the
positive effect defence spending has on manufacturing output. The only region within their
sample that they consider to be an exception for its net positive influence of military
expenditure on GDP growth is the set of Mediterranean OECD member states.
Two specific country studies shed further light on the need to consider the impact of defence
spending on GDP. Firstly, Dunne and Vougas (1999) propose using more advanced
alternatives of the standard Granger causality analysis when analysing military expenditure in
South Africa. South Africa is interesting in that there has been a large variation in military
expenditure, as well as in the political landscape. Their results show that there is a significant
negative relationship going from military expenditures to economic growth. However, in the
case of Guatemala, Reitschuler and Loening (2005) actually find a positive effect at lower
ranges of spending. These authors use a factor productivity approach to show that there is a
strong non-linear effect of defence spending on economic growth. For ratios of defence
spending up to 0.33% of GDP the influence is actually positive, but beyond that it turns
negative, although insignificantly so.
International spillovers
The effect of conflict on growth in neighbouring countries is a topic that is surprisingly
underrepresented in the general conflict literature. It is surprising as spillovers can
significantly increase the costs of an individual conflict and should therefore be part of any
analysis of conflict costs, as well as studies that look at the cost-benefit analysis of
The topic was jumpstarted by Murdoch and Sandler (a.o. 2004), who use the basic Solow
growth model to analyse the influence of neighbouring conflict on growth. In their different
papers, they use different samples and definitions of contiguity, but the conclusion remains
the same: conflict affects growth in neighbouring countries as well as host countries. An
interesting element that Murdoch and Sandler highlight is the different ways of defining
contiguity. In their seminal paper (2004), they employ five different kinds of contiguity
matrices: direct contiguity, borderlength contiguity and dummies for whether the distance of
closest approach is within 100, 300 or 800 km. Using their 84-country sample over the time
period 1960-1995, they conclude that the negative effects of conflict are experienced by all
neighbours up to the 800 km limit of closest approach.
In response to their paper, De Groot (2009) proposes a different method for distance
measurement. In his method, the effects of conflict are no longer linear, and this leads to
different outcomes. On basis of data for Africa, he concludes that direct neighbours of conflict
countries do indeed suffer negative consequences from the presence of conflict, whereas
non-contiguous proximate countries actually benefit.
Intertemporal effects
In addition to the effects that take effect during the conflict, there are also effects that only
become relevant in the post-war period. When thinking about these intertemporal effects of
conflict, a clear evolution in the literature can be recognised. A classic contribution that has
long been considered the most influential is by Organski and Kugler (1977), who argue that
the occurrence of conflict does not significantly alter the growth potential of a country and it
will therefore reverse back to its long term trend3. Clearly, even if their conclusion that
conflict has no long-term effects is valid, it does not take into account that during the
transition period from low growth during conflict, back to the equilibrium growth path, there
are a number of years during which production is below potential, and thus wellbeing is
actually decreased during those years. Additionally, more recent contributions have not
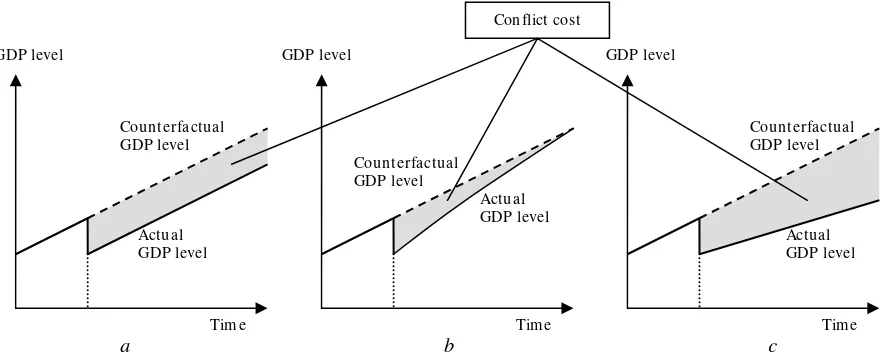
always reached the same conclusion as Organski and Kugler did. The different paths an
economy may follow are shown in figure 2. In panel a, a situation is shown in which the
conflict does not affect the growth rate, but only has a level effect. Organski and Kugler’s
convergence model is illustrated in panel b and panel c contains a situation in which for one
reason or another the post-conflict growth rate is lower and the gap between the true and
counterfactual levels of GDP further increases over time.
<figure 2 approximately here>
Van Raemdonck and Diehl (1989) provide a thorough overview of both the theoretical and
empirical results on how conflict influences post-conflict growth dynamics, even though they
acknowledge that up to that moment, “What have generally been ignored are the long-term
consequences of war” (p.249). In their extensive literature review, they show that many of the
channels through which post-conflict states are influenced by previous conflict can be positive
or negative, depending on policies implemented or one’s point of view4.
The first of a series of separate elements5 promoting either high or low growth rates in
post-conflict societies is related to the role of government. Conflicts tend to greatly increase the
role the government plays in the economy. If it continues to do so after the conflict ends, this
can be considered to be either positive or negative, depending on one’s perception of the role
of governments. Definite deadweight losses, however, are the military budgets that tend to
continue to be inflated for a long time and the servicing of debts run up during the conflict
period. Finally, during the conflict, the increased military output is likely to have led to an
increased demand for natural resources. If this has also led to an increased exploration, one
could expect positive effects for future growth. If, on the other hand, the stronger demand has
increased the government’s role in resource distribution, this is more likely to lead to
economic inefficiencies.
In the human capital channel, different perspectives are also likely to reach different
conclusions. The most obvious is the destruction of human capital on the battle field and, in
case of large-scale wars, the resulting demographic distortions. Additionally, demilitarisation
may increase the labour supply very rapidly, thereby causing further imbalances. On the other
hand, Van Raemdonck and Diehl argue that conflict can also lead to an improvement of
managerial and organisational capacities that benefit the economy. Finally, following in the
footsteps of the arguments on conditional convergence, it could be argued that the
population’s memories of the pre-war level of development will give an extra motivation to
rebuild the country and return to its pre-conflict growth path.
Finally, and possibly most importantly, there are the channels of capital and technology. At
first thought, the destruction of plants and equipment appears to be unequivocally bad for an
economy and a definite impediment to post-conflict growth. However, this destruction can
also be viewed as an opportunity to cross a technological threshold, when an economy was
4
Particularly when it concerns the role of government, some may argue that an increasing government role is by definition good, while others argue it is typically bad.
5
previously entrenched in obsolete technology6. If post-conflict reconstruction leads to the
construction of more productive industries, this can lead to a large improvement in the
economic fortunes of a population. Finally, conflicts and the increase in research and
development that accompany them may also lead to technological improvements that benefit
an economy’s development.
An important theoretical improvement for the empirical calculation of the size of the effect of
post-conflict economic growth is proposed by Collier (1999). His influential contribution that
calculates forgone growth resulting from the average conflict, introduces the concept of war
legacy. In addition to a post-war variable that describes the post-war period, legacy captures
the interaction between war duration and the post-conflict period, which together account for
the conflict overhang. He concludes that the growth rate of countries coming out of conflict
depends on the cumulative decrease the country has suffered during the conflict. Collier
argues that countries that have suffered strongly from long-lasting conflict are more likely to
receive a boost to their growth rate, whereas countries that have suffered only a little are more
likely to suffer reduced growth rates for a longer time. When one looks at the potential
influences described by Van Raemdonck and Diehl (1989), this fits rather well. After all,
short conflicts are not as likely to benefit from positive effects due to technological
innovation, replacement of obsolete infrastructure, improved managerial experience or
increased resource exploration. At the same time, debt overhang, permanently increased
military expenditure and trade disruptions are all likely to continue to affect a country.
Collier and Hoeffler (2004) shift focus to an important element of the post-war period: the
role of international aid. They show that aid is able to mitigate some of the caveats that
threaten post-conflict societies. In particular, they show empirically the best results in terms of
GDP growth is yielded when during the first four years after conflict, aid increases before
returning to its steady state level. In general, disregarding aid, the authors find that
post-conflict countries have a growth level that is higher than they would have had in the absence
of conflict7. Along the same lines, the World Bank (2003) published a report that also
highlights the importance of aid in the post-conflict arena. This shows the importance of the
role of international donors, which is yet another element that is going to be of major
importance for the overall calculation of conflict costs.
6
This is one of Organski and Kugler’s (1977) arguments in favour of the so-called phoenix effect, which refers to the phoenix rising from the ashes.
7
Human capital effects
The human capital effects of conflict are an important element of the calculation of conflict
costs that have so far been left out of the typical conflict-cost case studies. The influence of
conflict on GDP through the human capital channel takes several different forms. In addition
to the obvious effects in terms of the number of lives lost, the influence of conflict on trends
in morbidity, possibly due to the increasing presence of disease and reduced healthcare
quality is an important topic. Both of these effects fall within the theme of health. However,
there is a second human capital effect through which conflict can have a long-lasting impact
on growth, which is through education. Education is a important for long-term development
and the fact that school-age children are among the most vulnerable in conflict impacts
strongly on the educational achievements during those difficult times. The literature on health
and education effects will be discussed separately in this section, although there clearly are
interactions between the two as well (for example when children are unable to attend school
due to conflict-related health issues).
Health
Most people will argue that the foremost channel through which conflict affects health is
through battle-related mortality. However, this is not the only channel and even its importance
is debatable (Burnham et al., 2006). During conflict, battle-related deaths are important, but
so are the circumstances under which refugees survive in refugee camps, as well as the
increasing rates of violence and homicide during conflict episodes. Finally, conflict interrupts
ordinary economic transactions and infrastructure which is problematic and, as is the case for
education, government funds may be diverted away from healthcare. Interestingly, only the
direct battle-related mortality is likely to benefit immediately from the signing of a peace
agreement. In fact, it has been shown that these health effects can continue to be present for
up to ten years after a conflict ends (Ghobarah et al., 2003). The relationship between conflict
and health and mortality is a field of study on its own and we will discuss only a few
interesting research examples here.
Burnham et al. (2006) look at the total excess mortality in Iraq after the American invasion,
where they interview 1849 households containing 12,801 individuals to question them about
births and deaths. They are then able to construct an estimated pre-invasion mortality rate, and
compare that to the mortality rate after the conflict started. They find that the mortality rate
increased from 5.5 to 13.3 per 1000 people per year, with considerable variability over the
different years. Using this estimate, they go on to estimate that approximately 655 thousand
Ghobarah et al. (2003) use data on the disability-adjusted life years (DALY) lost due to
different causes, and analyse the impact of conflict on the DALYs lost by different population
groups and as a result of different diseases. They set out to show that conflict has a long-term
impact beyond its end, and therefore analyse a cross-section of countries to see what the effect
of civil conflict8 during the 1991-97 period on DALYs lost in 1999 is. Their conclusions are
impressive as they show that for the year 1999, more DALY’s are lost as a result of conflict
from the 1991-1997 period than from civil conflict actually taking place in 1999.
Furthermore, the authors show that the strongest effects are felt by women and children and
that residing in a country with contiguous conflict has a strongly negative impact as well. The
particular ways the population is affected by previous conflict include the increased incidence
of malaria, tuberculosis and respiratory diseases, but also due to increases in transportation
incidents and homicides. Li and Wen (2005) expand on Ghobarah et al. (2003) by showing
that, as expected, larger conflicts have a much stronger impact on the health outcomes of the
population. Additionally, they show that intrastate conflict particularly affects the population
during the conflict, whereas interstate conflict has more lingering consequences.
None of the authors above have made the step to express the health costs in terms of forgone
GDP. This is a missing link in the literature that needs to be addressed, because only once the
economic significance of the health outcomes as a result of conflict have been quantified, it is
possible to include them in overall conflict cost analyses. Of course, if one were to attempt
such an inclusion, it is important to take care of the double-counting problem; that is, the fact
that issues like increased mortality may already be included in the first stage of the analysis
looking at the way conflict affects GDP growth.
Education
One of the major contributions regarding the relationship between conflict and education is by
Lai and Thyne (2007), who use cross-sectional and time series methods to analyse the issue.
They consider two different channels: the first entails the fact that civil conflict is likely to
destroy a state’s education system through the loss of personnel and infrastructure, while the
second concerns the reallocation of resources away from education. Lai and Thyne use
UNESCO education data for all states between 1980 and 1997 and examine the percentage
change in educational expenditures for all education levels as a result of conflict. They find
evidence for their first claim, as both expenditures and enrolment decline during periods of
conflict, but they do not find any proof for the reallocation of education funds towards other
8
(military) spending. An important caveat is that the results are only valid for higher-level
conflicts.
Arrazola and De Hevia (2006) use the Spanish Civil War as an instrumental variable to
research the rates of return to education for men and women. They argue there are three main
reasons why educational attainment decreases during war periods:
1. Increasing difficulties in the physical access to schools.
2. A decline in financial means for school attendance.
3. Increasing need for school-aged children to leave school and contribute to family
earnings.
Both previous papers, however, consider mostly supply-side effects in the influence of
conflict on education. De Groot and Göksel (2009), on the other hand, analyse the Basque
conflict to consider what happens in a more low-profile conflict in which the channels
suggested by Arrazola and De Hevia (2006) are not relevant. De Groot and Göksel instead
examine how the presence of conflict affects the demand for education. When using a method
of analysis that is similar to that of Abadie and Gardeazabal (2003), they conclude that the
presence of conflict actually increases the demand for education. This effect is particularly
noticeable in the middle part of the educational distribution.
A final paper that looks at how conflict influences education is by Blattman and Annan
(2009), who interviewed a sample of 741 young men from northern Uganda, 462 of whom
had been abducted by the Lord’s Resistance Army (LRA) for some time. Whilst it is not
possible to compare the experience of conflict-affected children with another group of
children who have not suffered any conflict, it is possible to compare children who have been
abducted by the LRA and those who have not because in this particular situation abduction
was an apparently random treatment and thus the abducted and non-abducted children have
the same baseline characteristics. It turns out that those children who had been abducted had
approximately 10% fewer years of education, keeping everything else constant.
4. The Way Forward
In the previous section we reflected on how this topic has already been covered in the
literature, but it is also important to consider what still needs to be done in the future. Based
on the aforementioned literature, as well as other sources, we propose a number of concerns
that can be considered most pressing for researchers who wish to calculate the costs of
conflict. We divide this analysis into two separate subsections, addressing case-study analyses
costs of average conflicts or an aggregation of all conflicts. While case studies have been the
primary focus of this contribution, there are also important lessons to be learned for
cross-country analysis, and for that reason, it is included here.
Case Studies
Case studies can be particularly interesting to analyse, as the estimations are more precise
than those based on cross-country analyses (as one can take into account local conditions),
and they provide a good background for the ranking of priorities in addressing the
consequences of conflict. When one thinks about the reduction of conflict and its
consequences, analyses always need to be specifically tailored to the conflict under
consideration. However, as shown previously, most case studies address only a limited
number of elements that contribute to the total costs of a conflict. This is fine in the case of
e.g. Bilmes and Stiglitz (2008) or Reitschuler and Loening (2005), who specifically choose to
address one particular element (the military cost of intervention and the influence of military
expenditure on GDP growth respectively). However, when one sets out to analyse the total
costs of a particular conflict, one has to take all elements that may contribute to that total into
account.
There are two main approaches for this. One can be considered additive, and its biggest caveat
is double-counting. The other approach is a unified one and the biggest worry is the inclusion
of all relevant effects.
The additive approach
In the additive approach, one analyses the separate channels through which conflict influences
the state of the economy separately and tries to combine these separate channels afterwards.
This means that one has to consider what the conflict means in terms of lives lost, or
education forgone and then use these estimations to see what the consequences of that are in
monetary terms. This appears to be straightforward, but as seen in the Sri Lanka studies, it is
very difficult to quantify exactly what the actual losses are in terms of e.g. investment, lives or
tourism. One must therefore carefully consider how to construct the alternative non-conflict
scenario. The use of a well-defined and comparable counterfactual (like Abadie and
Gardeazabal, 2003) is an important way to solve that problem.
<Table 3 approximately here>
The second consideration is which separate effects to include, when one has to weigh the
Studies need to include all important channels that significantly contribute to the total costs
(comprehensiveness), but one must keep in mind that there has to be a cut-off for the amount
of effort it requires to include another channel (efficiency). Finally, only channels that
actually contribute significantly to a conflict and that are indeed important to the conflict
should be included (relevance).
Table 3 highlights the most important elements of such a study and why they are important.
The most important caveat in such an additive analysis is to avoid double-counting. For
example, when education decreases during conflict because all males aged 20-30 years old
(who tend to be relatively highly educated) die on the battle field, this is a cost that is already
included in the loss of life section. Similarly, the influence of military expenditures on public
investment in capital accumulation should only be included as an element of capital
accumulation and should not be repeated by the military expenditures discussion.
The unified approach
The unified approach, as opposed to the additive one, aims to include all conflict-related costs
in one analysis. A basic assumption for enabling the possibility of such an approach is that all
costs are expressed as an element of GDP. This means that one does not have to separately
account for losses in terms of e.g. education, because this loss already shows up as part of the
relevant GDP time series9. The most obvious method to go about this is similar to Abadie and
Gardeazabal (2003) and requires the construction of a reasonable (hypothetical) alternative for
the conflict region and looks at the differences between the conflict region and its
conflict-free counterpart. Such an analysis would include most elements that acutely affect GDP
growth. To be able to include the long-run effects (e.g. through education or through higher
debt servicing) of the conflict, long time series are needed though. This appears to make this
method unsuitable for the immediate calculation of conflict costs from particular conflict
cases. However, one already needs to forecast the hypothetical region, and using similar
methods it can also be reasonable to forecast the future development of the conflict country
itself. This enables the researcher to include conflict-related elements that only affect GDP
(growth) in the long term.
Another effect that is not included here are international spillovers. These are a special case,
because the inclusion of spillovers in the calculation of the costs of a specific conflict is
potentially questionable. We argue, however, that these costs are part of a conflict and should
thus be included. The way to do this is in fact a repetition of the original premise for this
method. One must replicate neighbouring states to create hypothetical ones that are not
9For the example of education, this is only true if education influences productivity, which seems a reasonable
affected by the conflict spillovers and analyse what the impact is on GDP (growth) in these
countries. Particularly when wealthy countries are neighbouring relatively poor and
conflict-affected ones, this cost type may be important.
An important challenge to be overcome in the unified approach is the construction of the
hypothetical region. In their study, Abadie and Gardeazabal (2003) can use different regions
from the same country, because the conflict is clearly contained in one part of the country.
This is optimal and using other countries to replicate the conflict host is fraught with
difficulty. A researcher wishing to employ the unified method of case-study conflict analysis
must keep this difficulty in mind.
Cross-country Analyses
While this paper mainly looks at case studies, there are important lessons to be learned for
cross-country analysis as well. An important element in cross-country analysis is the
assumption that all relevant costs will in fact be included in the development of GDP. So for
example, like with case studies, human suffering in itself is excluded from the analysis to the
extent that it does not affect GDP trends. For cross-country analyses, the basic premise is
based on a simple Solow growth model (Mankiw et al., 1992), to which one can
straightforwardly add a number of conflict-related dummies10 to analyse the impact of
conflict on economic growth. Or is the true solution of this problem more complicated?
The principal idea of cross-country analysis is exactly as described above, but the precise
execution takes more effort. The foremost thing is the question as to whether this estimation,
in the way it was executed by Collier (1999), is in fact correct. Put simply, this simple
treatment may likely lead to inconsistent parameter estimates and a more sophisticated
treatment is indeed necessary. Whereas the actual solution is beyond the scope of this
contribution, it suffices to say that using dynamic panel data techniques (Blundell et al., 2000)
will solve many of the problems involved in the consistent estimation of the coefficients,
although the method is not free of criticisms (Roodman, 2009).
However, apart from these econometric complexities, there is another range of issues that one
needs to address in order to find consistent estimates of the costs of conflict. The treatment of
data deserves a fair share of attention. There are two important facets to the discussion of data
treatment: data availability and data differentiation. Data availability is a large problem in the
estimation of conflict costs, due to the endogenous nature of data availability. After all, it is
those countries where basic infrastructures and livelihoods have broken down (due to conflict)
that are most likely not to report data. For that reason, a researcher must come up with an
10 Depending on one’s perspective, one may want to include conflict presence, as well as neighbouring conflict
appropriate technique for imputing missing data to make sure that missing values adhere to a
more random pattern. With data differentiation, we mean the amount of information contained
by certain data points. In particular, one should think of conflict data, where an observation
“dummy=1 if there is conflict” is often employed, while this underutilises the information
regarding the conflict’s typology, intensity and geographical spread. It is important to
recognise these different types of data in the simple framework of analysis, to guarantee the
consistency of the final estimation.
Another important caveat to keep in mind during the estimation of the cross-country impact of
conflict is the integration of control variables used in the growth equation. The simple growth
equation we propose to use here includes certain elements that have a direct influence on
growth, such as the growth of physical and human capital. While controlling for these
elements is important, the question remains whether the changes in these factors are
exogenous or not. If they are not, and are instead due to the presence of the conflict, then
controlling for them will lead to an incorrect estimation of the costs of conflict11. For that
reason, one should estimate what the impact is of conflict on the control variables used in the
equation and analyse what its impact is on growth.
The final component of the analysis that is important to draw attention to is the aggregation of
conflict costs over time. As pointed out in figure 1, conflict may have a lasting impact on the
economic development of a nation. In this case, it is not the drop of GDP occurring at the time
of the conflict that is the actual cost, but the Net Present Value of the stream of losses that will
happen in the future. Authors like Organski and Kugler (1977) may have argued that an
economy may converge back to its previous growth path, but they fail to recognise that GDP
is not a stock variable but a flow variable instead12. Decisions regarding the appropriate rate
of discount and how to estimate the future development of countries that currently suffer
conflict are other important questions the researcher needs to address and sensitivity analysis
is recommended to gauge the uncertainty surrounding the estimates.
11
This statement assumes that the control variables included in the original estimation are in fact relevant and significant. The direction of the error depends on the covariance between conflict and the control variables as well as the sign of the those variables, but an underestimation of the total costs of conflict is most likely.
12
5. Conclusion
Having reviewed the literature on the calculation of conflict costs, it becomes clear that there
is still a lot of room for further improvement. Case studies addressing the overall costs of
specific conflicts continue to come up with wildly varying estimates, as there is no clear
framework that indicates what the optimal estimation strategy is and as a result, studies risk
both double-counting and underestimation. As a result, different authors decide to address
different specific issues, instead of the overall costs. While this is interesting in its own right,
it does not address the question of what the exact costs of conflict are. In order to answer that
question, further research needs to be done. The answer to this question is not only relevant
from an academic perspective, but also for the proposal of policies regarding different
strategies to minimise or prevent the costs associated with conflict. Research on channels that
contribute to the costs of conflict together with variation in policies may additionally help to
allocate resources to specific types of post-conflict reconstruction policies.
Cross-country analysis regarding the average costs per conflict, or the total costs of all
conflicts has received the lion’s share of attention recently, but further strides will need to be
made. In particular, micro-level analysis based on economic and demographic household
surveys deserves further exploration, as well as the evaluation of policy interventions in
conflict-prone countries. Although these studies are country or even region specific, they are
very informative about the links between conflict and topics such as capital formation (human
and physical), migration and displacement, and coping strategies, all of which matter to
calculate the costs of conflict. These types of studies may also be informative about pockets
of vulnerable populations within countries, and thus are very informative to target policies at
6. References
Abadie, Alberto and Javier Gardeazabal (2003), “The Economic Costs of Conflict: A Case
Study of the Basque Country”, American Economic Review, Vol. 93 (1), pp. 113-132.
Arrazola, María and José De Hevia (2006), “Gender Differentials in Returns to Education
in Spain”, Education Economics, Vol. 14(4), pp. 469-486.
Arunatilake, Nisha, Sisira Jayasuriya and Saman kelegama (2001), “The Economic Cost
of the War in Sri Lanka”, World Development, Vol. 29(9), pp. 1483-1500.
Benoit, Emile (1973), Defense and Economic Growth in Developing Countries. Boston:
Heath, Lexington Books.
Bilmes, Linda J. and Joseph E. Stiglitz (2008), The Three Trillion Dollar War: The True
Cost of the Iraq Conflict, New York: W.W. Norton & Co.
Blattman, Chris and Jeannie Annan (2009), “The Consequences of Child Soldiering”,
forthcoming in Review of Economics and Statistics.
Blundell, R., S. Bond, and F. Windmeijer (2000), “Estimation in Dynamic Panel Data
Models: Improving on the Performance of the Standard GMM Estimator”, in Baltagi B. (ed.),
Advances in Econometrics, Vol. 15, Nonstationary Panels, Panel Cointegration, and
Dynamic Panels, Amsterdam: JAI Elsevier Science.
Bozzoli, Carlos, Tilman Brück, Thorsten Drautzburg and Simon Sottsas (2008),
“Economic Costs of Mass Violent Conflicts”, Politikberatung Kompakt N° 42, Berlin: DIW
Berlin.
Burnham, Gilbert, Rihadh Lafta, Shannon Doocy and Les Roberts (2006), “Mortality after
the 2003 Invasion of Iraq: a Cross-Sectional Cluster Sample Survey”, The Lancet, 368(9545):
1421-8
Cappelen, Ǻdne, Nils Petter Gleditsch and Olav Bjerkholt (1984), “Military Spending and
Economic Growth in the OECD Countries”, Journal of Peace Research, Vol. 21(4), pp.
361-373.
Collier, Paul (1999), “On the Economic Consequences of Civil War”, Oxford Economic
Papers, Vol. 51, pp. 168-183.
Collier, Paul and Anke Hoeffler (2004), “Aid, Policy and Growth in Post-Conflict
Societies”, European Economic Review, Vol. 48, pp. 1125-1145.
De Groot, Olaf J. (2009), “The Spill-Over Effects of Conflict on Economic growth in
Neighbouring Countries in Africa”, forthcoming in Defence and Peace Economics.
De Groot, Olaf J. and Idil Göksel (2009), “The Influence of Conflict on the Demand for
DiAddario, Sabrina (1997), “Estimating the Economic Costs of Conflict: An Examination
of the Two-Gap Estimation Model for the Case of Nicaragua”, Oxford Development Studies,
Vol. 25(1), pp. 123-142.
Dunne, J. Paul and Sam Perlo-Freeman (2003), “The Demand for Military Spending in
Developing Countries”, International Review of Applied Economics, Vol. 17(1), pp. 23-48
Dunne, J. Paul and Dimitrios Vougas (1999), “Military Spending and Economic Growth
in South Africa: A Causal Analysis”, Journal of Conflict Resolution, Vol. 43(4), pp. 521-537.
Fisas, Vicenç, 2009, 2009 Yearbook on Peace Processes, Barcelona: Icaria International.
FitzGerald, E.V.K. (1987), “An Evaluation of the Economic Costs to Nicaragua of U.S.
Aggression: 1980-1984”, in Rose J. Spalding (ed.), The Political Economic of Revolutionary
Nicaragua, Boston: Allen & Unwin, Inc., pp. 195-213.
Ghobarah, Hazem, Paul Huth and Bruce Russett (2004), “Civil Wars Kill and Maim
People – Long After the Shooting Stops”, American Political Science Review, Vol. 97(2), pp.
189-202.
Grobar, Lisa Morris and Shiranthi Gnanaselvam (1993), “The Economic Effects of the Sri
Lankan Civil War”, Economic Development and Cultural Change, Vol. 41(2), pp. 395-405.
Harris, Geoff (1997), “Estimates of the Economic Cost of Armed Conflict: The Iran-Iraq
War and the Sri Lankan Civil War”, in Jurgen Bruaer and William G. Gissey (eds.),
Economics of Conflict and Peace, Aldershot: Avebury, pp. 269-291.
Kelegama, Saman (1999), “Economic Costs of Conflict in Sri Lanka”, in Robert I.
Rotberg (ed.), Creating peace in Sri Lanka: Civil War and Reconciliation, Washington D.C::
Brookings Institution Press, pp. 71-87.
Lai, Brian and Layton Thyne (2007), “The Effect of Civil War on Education 1980-97”,
Journal of Peace Research, Vol. 44(3), pp. 277-292.
Lenin, Vladimir I. (1916 [1996]), Imperialism: The Highest Stage of Capitalism, London:
Pluto Press.
Li, Quan and Ming Wen (2005), “The Immediate and Lingering Effects of Armed
Conflict on Adult Mortality: A Time-Series Cross-National Analysis”, Journal of Peace
Research, Vol. 42 (4), pp. 471-492.
Lindgren, Göran (2006), “The Economic Costs of Civil War”, in Göran Lindgren (ed.),
Studies in Conflict Economics and Economic Growth, Uppsala: Uppsala University.
Lopez, Humberto and Quentin Wodon (2005), “The Economic Impact of Armed Conflict
Mankiw, N. Gregory, David Romer and David N. Weil (1992), “A Contribution to the
Empirics of Economic Growth”, Quarterly Journal of Economics, Vol. 107, pp. 31-77.
Murdoch, James C. and Todd Sandler (2004), “Civil Wars and Economic Growth: Spatial
Dispersion”, American Economic Review, Vol. 71(4), pp. 1347-1366.
Nordhaus, William D. (2002), “The Economic Consequences of a War with Iraq”, NBER
Working Paper N° 9361, Cambridge, MA: National Bureau for Economic Research.
Organski, A.F.K. and Jacek Kugler (1977), “The Costs of Major Wars: The Phoenix
Factor”, American Political Science Review, Vol. 71(4), pp. 138-151.
Reitschuler, Gerhard and Josef L. Loening (2005), “Modeling the Defense-Growth Nexus
in Guatemala”, World Development, Vol. 33(3), pp. 513-526.
Richardson Jr., John M. and S.W.R. de A. Samarasinghe (1991), “Measuring the
Economic Dimensions of Sri Lanka’s Ethnic Conflict” in S.W.R. de A. Samarasinghe and
Reed Coughlan (eds.), Economic Dimensions of Ethnic Conflict, London: Pinter Publishers,
pp. 194-223.
Roodman, David (2009), “A Note on the Theme of Too Many Instruments”, Oxford
Bulletin of Economics and Statistics, Vol. 71(1), pp. 135-158.
Smith, Ron (1989), “Models of Military Expenditures”, Journal of Applied Econometrics,
Vol. 25, pp. 821-846.
Stewart, Frances, Cindy Huang and Michael Wang (2001), “Internal Wars: An Empirical
Overview of the Economic and Social Consequences”, in Valpy FitzGerald and Frances
Steward (eds.), War and Underdevelopment, Oxford: Oxford University Press, pp. 67-103.
Tsay, R.S. (1988), “Outliers, Level Shifts and Variance Changes in Time Series”, Journal
of Forecasting, Vol. 7, pp. 1-20.
Van Raemdonck, Dirk C. and Paul F. Diehl (1989), “After the Shooting Stops: Insights on
Postwar Economic Growth”, Journal of Peace Research, Vol. 26(3), pp. 249-64.
Von Clausewitz (1812 [2004]), On War, Whitefish: Kessinger Publishing.
World Bank (2003), Breaking the Conflict Trap: Civil War and Development Policy,
Table 1. Results of previous studies regarding costs of Sri Lanka conflict
War years 1983-88 1983-88 1983-92 1983-87+
1990-94 1994-1996
Total costs 6.15b US$ 1.99b US$ 6.31b US$ 16.74b US$ 22.34b US$
Average p.a. 1.02b US$ 0.33b US$ 0.63b US$ 1.72b US$ 1.93b US$
% of GDP p.a. 2.2% 0.7% 1.3% 3.3% 3.5%
This table includes the results from five previous studies expressed in constant 2000 US$,
including the time period the studies concern, as well as the annual averages per study. The
exact calculations are our own, on basis of the studies mentioned.
Table 2. The different channels related to military expenditures
Channel direction Explanation
Crowding out - Crowding out refers to the reduction of useful investment due to its competition for limited resources with military expenditure. R&D + It is argued that an economy can benefit from the (civilian)
spin-offs from military research and development. Demand +/-
Military expenditure can be part of a Keynesian stimulus package using public demand to stimulate the economy. At the same time, increasing public demand when an economy is already growing can lead to overheating.
Competition for resources -
The military complex’s demand for limited resources drives up the prices of these resources for the private sector, thereby harming the economy
Exports + Having a productive military complex can be an important export
market. Debt/tax increase -
Military expenditures need to be paid for, either by current taxpayers through an increased tax burden or by future ones through larger debt servicing, both of which may be a deadweight loss to the economy.
This table includes the different sources through which military expenditure can impact on
Table 3. Important elements of an additive case study
Channel Explanation
Capital accumulation Estimate the influence conflict has on both domestic and foreign investment and its related impact on GDP growth.
Military expenditures
The approximate impact of military expenditure, including the macroeconomic stimulus (if domestically produced), potential as export market, deadweight loss of costs.
Effective cost in lives
Calculate the estimated number of lives lost and their future contribution to the economy. This can contribute to a number, although it is open to criticism for the quantification of the value of human life.
Education gap Particularly in the case of a long-lasting violent conflict, education acquisition may be disturbed leading to a legacy for a generation of reduced education.
Infrastructure The destruction of the capacity of the state, including both physical infrastructure (roads, bridges) and societal infrastructure (trust, cooperation).
Refugees
Analyse the impact of the conflict on individuals and their livelihoods. Masses of refugees are a) less productive and b) more costly to the state. So these numbers are important to keep in mind too.
Future losses
Use the previous factors to look at what the total impact is of the conflict on GDP and estimate the future recovery of these elements. This enables one to quantify the future impact in terms of lost GDP.
Debt servicing Related to the previous factors, what is the legacy of the conflict in terms of debt and what percentage of the economy the servicing of that debt requires.
This table highlights different elements that need to be part of a case study analysis aiming to
use additive techniques to come up with a realistic cost estimation.
Figure 1. Illustration of the concept of the counterfactual analysis of conflict cost calculation
Cou n ter factual
GDP level
Con flict cost
Actu al
GDP level GDP level
Figure 2. Illustration of the different possible post-conflict developments.
Actu al GDP level Cou n ter factu al GDP level
GDP level GDP level
Actu al GDP level Actu al
GDP level
Cou n ter factu al GDP level Cou n ter factu al
GDP level
Con flict cost
GDP level
Tim e Tim e
Tim e
a b c
Panel a shows the size of conflict costs in the case of a level shift. Panel b illustrates the
situation in which there is convergence and panel c shows a situation in which conflict causes