Estimated Formation Temperature On Oil Well Using Log
and Thermal Method in 'H' Region, Central Sumatra
Khodijah Hanun
1,a), Ordas Dewanto
1, b), Bagus Sapto Mulyatno
1, c), Rahmat Catur
Wibowo
1, d), Feni Priyanka
1, e)1Lampung University
a)[email protected] b)[email protected] c)[email protected]
d)[email protected] e)[email protected]
Abstract.
Rock temperature is an important parameter in the process of predicting the maturity of hydrocarbons in sedimentary rocks and also can be used as the basis studies related to geothermal reservoir. Direct measurement in well drilling is to determine the temperature at determined depth. This measurement was not done thoroughly on the well, some have only do a measurements on the bottom of wells (BHT). This study estimates the temperature at each depth on well that surface temperature and Bore Hole Temperature (BHT) known using the development of earth heat flow basic concepts, by calculating thermal conductivity of group formation, temperature gradients of group formation and heat flow. These three parameters used as a basic to determine the change in depth on temperature rising at 10OC or 5OC. The temperature in each formation can be used as a parameter to calculate the amount of heat in the reservoir rock and the resulting temperature in each depth can be used as a parameter to estimate the hydrocarbon maturity. The thermal conductivity of rocks in this study obtained by measuring core in the laboratory and calculation based on rock porosity. These two method show a slight different price causing kF, kGF, gradT, kW, and heat flow have the same price of the rock thermal conductivity measurement and calculation. The temperature on the A1 well ranges from 27OC (surface) to 127OC (basement), while the B1 well ranges from 30OC (surface) to 100OC (basement).
INTRODUCTION
Temperature affects the organic compounds in sediments. Temperature increasment transform hydrocarbon to crude oil, condensate and become only gas. Petroleum generated from lipid liberation of kerogen is a process that is related to the temperature, which is exponential and starts at temperatures around 93OC. The temperature in a rock is
an important parameter in the process of predicting the maturity of hydrocarbons in sedimentary rocks and also can be used as the basis studies related to geothermal reservoir. Heat flows from the bottom spread onto the surface affects the pore space of rock, thus every pore space of rock has a temperature. The temperature in each pore are different because the porosity and thermal conductivity were different, and the difference in the hydrostatic pressure of the rock. Direct measurement in well drilling is to determine the temperature at determined depth. This measurement was not done thoroughly on the well, some have only do a measurements on the basis of wells (BHT). This study estimates the temperature at each depth on the well that the surface temperature and Bore Hole Temperature (BHT) known using the development of earth heat flow basic concepts to determine the temperature at each depth, by: a. calculating the thermal conductivity of group formation; b. calculating the temperature gradients of group formation; c. calculating the heat flow. These three parameters (a, b, c) used as a basic to determine the change in depth on temperature rising at 10OC or 5OC. The contribution of this study are: 1. The temperature in each
temperature in each depth can be used as an important parameter to estimate hydrocarbon maturity (oil and gas). The thermal conductivity of rocks in this study obtained by measuring the core in the laboratory and calculation based on rock porosity.
LITERATURE
Thermal Conductivity
According to Eckman (1958), the heat transfer through three different ways, namely conduction, convection, and radiation. Conduction is the process of heat transfer in a substance that is not accompanied by mass transfer (commonly occurs in solids). The thermal conductivity of a substance is the heat conductivity in substances, which means the ability to conduct heat. The SI unit for thermal conductivity (k) is W/mOC. In 1982, Gretener researched
the thermal conductivity of rocks (solid), liquid and gas for different lithology below the surface at room temperature. It result that the thermal conductivity for each substances are different, while the thermal conductivity for one substance (same lithology), also different.
Thermal Conductivity of Group Formation
Thermal conductivity of group formation (kGF) is the ability of a group formation in the well to conduct heat. Thermal conductivity for group formation is determined by the calculation based on the formation thermal conductivity and the thickness of the group formation by summing the respective thermal conductivity formations that exist in groups (Dewanto, 2001);
1
formation-2 thermal conductivity (10-3cgs) and so on.
The thermal conductivity of group formation is for determining the well temperature. The determination of this group of formations adapted to the conditions of the formation at the well.
Thermal Conductivity of Well
Temperature Gradients
The temperature of oil and gas reservoir is primarily determined by the depth and geological position. Deeper depth has the higher temperature. On the other hand this temperature is determined by the temperature gradients. The temperature gradients (gradT) is stated in the OF/100 feet or OC/100 m. Heat that spreads flowing from the
bottom to the surface causing the porous of rock which the heat flow through has a temperature. The temperature at each rocks are different. The temperature gradients is defined as follows:
100 )
(
D Ts Tf dZ dT
3. where; dT/dZ= temperature gradients (oC/100m), Tf = formation temperature (oC), Ts = surface temperature
(oC), D = formation depth (m)
Heat Flow
Subsurface has a heat source located in the center of the earth. Heat flows from the bottom spread onto the surface. Heat flow is the amount of heat flowing from the earth to the surface by conduction. Heat flow (Q) affects the pore space of rocks thus every pore has a temperature. Temperature and thermal conductivity of each rock vary because the porosity that influence the heat coming from the heat flow (Dewanto, 2002). Heat flow rates can be obtained from the product of the thermal conductivity and temperature gradients over an interval and depth. In the form of formulas, geothermal heat flow can be expressed as;
dZ dT k
Q 4.
where; Q = heat flow (HFU or cal/cm2s or mW/m2 ), k = thermal conductivity (10-3 cal cm-1 dt-1 OC-1 or
W/mOC), dT/dZ= temperature gradients (OC/100 m), 1 HFU= 10-6 kal cm-2 dt-1
Implemented Study
Landes (1967) in his research on Eometamorphism, and Oil and Gas in Time and Space, concludes that the change in temperature can cause the onset of metamorphism and very influential in the organic compounds in sediments. According to Klemme (1972) in his research on Heat Influences Size of Oil Giants-Geothermal Gradients, petroleum generated from lipid liberation of kerogen is a process that related to the temperature was exponential. In this case, then the depth and temperature gradients are important factor.
Subono and Siswoyo (1995) in his study of Thermal Studies of Indonesian Oil Basin, provides an overview of the effect of thermal physical properties of the oil basin. The study is a continuation of Tamrin et al (1981) research about the heat flow determining method. Dewanto (2001) in his research on Analysis of the Relationship Between Porosity and Thermal Conductivity of Rock in Measurement and Calculation Results, give some conclusions, first: rocks porosity have variations value due to the rocks temperature and heat differences, second: thermal conductivity of rock influenced by pressure, thus the deeper depth, the thermal conductivity of rocks bigger.
METHODOLOGY
Required Data
1. BHT (Bore Hole Temperature) 2. Stratigraphy (lithology)
3. Thermal conductivity of rocks (kr)
4. Temperature gradients (gradT), heat flow (Q) 5. Well log data
Rock Analysis and Measurement
Rocks that used to be analyzed is a conventional plug core rock, rock samples from vertical log drilling 2. Rock Measurement
In this rock measurement, we measured kr using a tool called needle three needle device or control box.
Data Calculation
1. Determine the thickness formation
2. Determine the group formation and calculate its thickness 3. Calculating the formation thermal conductivity (kF)
1
lithology-2 thermal conductivity (10-3 cgs)
4. Calculating the group formation thermal conductivity (kGF) using equation 1
5. Calculating the well thermal conductivity (kW) using equation 2
6. Calculating the temperature gradients (gradT) using equation 3
7. Calculating the heat flow
Using equation 4 with using the k as kW
8. Calculating the temperature gradients of group formation (gradTGF)
using equation 4 with using the k as kGF
9. Create a model to determine the change in depth on each temperature rising at 10OC (dT = 10OC, dZ = …).
10. Determining the formation temperature at each depth
RESULTS AND DISCUSSION
This study estimated formation temperature of two wells using thermal methods. The first well is A-1 with 6443.4 ft (1963.9 m) depth and the second well is B-1 with 4606 ft (1403.8 m) depth that located in Central Sumatra Basin. Lithology and thermal conductivity of rock data shown in Table 1 and 2 as required data for this study.
Estimated temperature on each formation was done by measuring and calculating kr, Q and gradT. Heat flow is the flow of heat coming from the earth brought to the surface passes through a rock. Rock properties and density make the heat flow at each well in an area different though sometime it has the same value. The thermal conductivity of rocks can be determined by core direct measuring in the laboratory and also can be determined by calculation based on rock porosity. This study determine kr price by core measurment and calculation.
Measurement and Calculation Results
Thermal Conductivity of Rocks Calculation for A-1 and B-1 Wells
Based on the calculation of rock thermal conductivity, we will get formation thermal conductivity (kF), group formation thermal conductivity (kGF), well conductivity (kW), temperature gradients (gradT), heat flow (Q), and temperature gradients of group formation (gradTGF).
First, determining the thermal conductivity of rocks (kr) in well A-1 with calculation based on rock porosity (), using the equation k = kf×ks1-. Porosity that used in this equation is total porosity for each lithology at the formation
changes in depth (dZ) for temperature rising at 10 OC (10OC/Z). Calculation result of kGF, gradT
GF and dZ are shown
in Table 5.
The calculations of well B-1 has the same steps like well 1. The well B-1 has more shallow depth than well A-1. From the calculations, the price of the kr in wells B-1 are shown in Table 2. The calculations results of kW, gradTW, and Q are shown in Table 3. And the calculations results of kGF, gradTGF and dZ are shown in Table 7.
The Thermal Conductivity of Rocks Measurement for A-1 and B-1 Wells
The kr measurement results in well A-1 shown in Table 1 and well B-1 in Table 2. kr data processing based on the measurement is the same as data processing based on the calculation. From the data processing based on the measurement, Table 4 shows the results of kW, gradT, and Q in A-1 and B-1 wells, Table 6 shows kGF, gradTGF and
dZ in well A-1, and Table 8 shows kGF, gradTGF and dZ in well B-1.
Discussion
The Thermal Conductivity of Rocks
In wells A-1 and B-1, deeper depth has bigger kr (for sand and shale). The relationship between kr and depth (Z) show the exponential (Figure 1-4). These thermal conductivity difference influenced by many factors.
kr obtained by measuring the core laboratory has almost the same price to kr calculation by rock porosity (). k
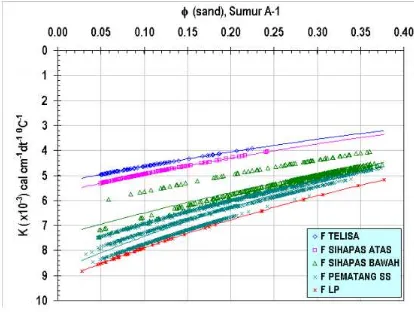
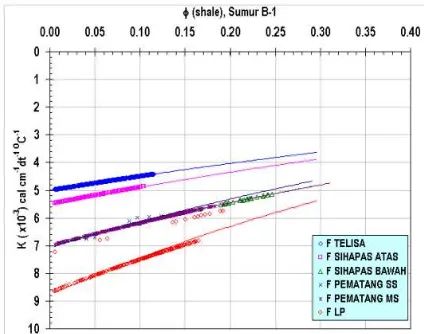
=kfks1- equation (Nakayama, 1987) shows that the greatly affect the kr. Figure 5-8 shows a relation graph
between and kr and the graph shows the exponential. Smaller has bigger kr. As we can see in the theory that show the increasing depth has the decrease exponentially (Sclater and Christie, 1980).
Porosity decreases exponentially in every increase of depth caused by the overburden pressure, which affects the pore space of rocks. So that the pore has the different shape and properties. Like the price of which becoming smaller every increasing depth (Nakayama, 1987, from Rubey and Hubbert, 1959). Because the getting smaller, then kr is getting bigger in every increasing depth. difference is also affected by temperature. We see in A-1 and B-1 wells, the price change of and kr are not big in every increased depth. It does not mean the pressure has no effect, beside the over pressure did not happen.
Formation Temperature
Minas Formation well A-1 (0-170 m) has kF = 4.1410-3 cgs and well B-1 (0-120 m) has kF = 4.5210-3 cgs. In
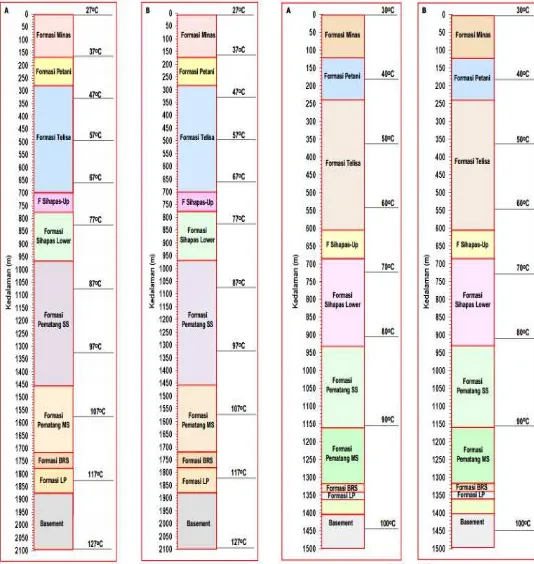
this formation, we see the kF price differences. Because in this formation, the well B-1 has only one kind of lithology is sand with a thickness of 120 m. While in well A-1, consisting of shale (75 m thick) and sand (95 m thick) lithology. Minas Formation lithology in well A-1 and B-1 have the same age. This fit the theory of thermal conductivity, that in the near surface, kSAND greater than kSHALE (Gretener, 1982). Formation temperature in Minas for well A-1 ranges from 27OC to 37OC, and the Well B-1 ranges from 30OC to 40OC (Figure 9 and 10).
Petani Formation well A-1 (170-284 m) has kF = 4.2610-3 cgs and well B-1 (120-240 m) has kF = 3.9710-3 cgs.
Each wells have shale and have the same age lithology. In this formation, well A-1 has the kr larger than well B-1 because the formation lithology in well A-1 located in deeper depth that has a bigger pressure and affects the space rocks that affect the price of . As a result, the kr change according to a graph vs kr and kr vs Z. Formation temperature in Petani for well A-1 ranges from 37OC to 47OC, and well B-1 ± 40OC (Figure 9 and 10).
Telisa Formation well A-1 (284-698 m) has kF = 4.2310-3 cgs and well B-1 (240-605 m), has kF = 4.2210-3
cgs. In this formation, well A-1 consists of shale or clay (394 m thick) and sand (20 m thick) lithology while well B-1 has only one lithology that is clay (365 m thick). And each well have the same age lithology. Telisa Formation well A-1 has kF larger than B-1 wells due to the formation lithology. In this formation, well A-1 is in deeper area and also have sand lithologily. Formation temperature in Telisa for well A-1 ranges from 47OC to 67OC and well
B-1 ranges from 50OC to 60OC (Figure 9 and 10).
Upper Sihapas Formation well A-1 (698-778 m) has kF = 4.9510-3 cgs and well B-1 (605-685 m) kF = 4.4710-3
greater kF because this well located in deeper depth and the lithology differences. Formation temperature in Upper Sihapas for well A-1 ranges from 67OC to 77OC, and the well B-1 ranges from 60OC to 70OC (Figure 9 and 10).
Lower Sihapas Formation well A-1 (778-969 m) has kF = 5.2510-3 cgs and well B-1 (685-930 m) has kF =
5.7910-3 cgs. Each wells have the same age lithology. Lower Sihapas Formation well A-1 has sand (111 m thick)
and shale (80 m thick) lithology, while the well B-1 also has sand (185 m thick) and shale (60 m thick) lithology. In this formation, well B-1 has a greater kF than well A-1 due to the lithology aspect where lithology in well B-1 dominant sand and the two wells located in almost in the same depth, cause the depth factor has a little effect on kF. Formation temperature at Lower Sihapas for well A-1 ranges from 77OC to 87OC and well B-1 ranges from 70OC to
80OC (Figure 9 and 10).
Pematang Sand Stone (Pematang SS) Formation well A-1 (969-1457 m) has kF = 6.6510-3 cgs and well B-1
(930-1160 m) has kF = 6.9010-3 cgs. Pematang SS Formation well A-1 has sand (368 m thick) and shale (120 m
thick) lithology. While well B-1 has sand (210 m thick) and shale (20 m thick) lithology. Each well has the same age lithology. If we look at the state of this formation, kF on well A-1 should have been greater than well B-1. But kF in well B-1 is greater than kF in well A-1. This happens because the thermal conductivity is determined by calculations based on where Pematang Formation SS well A-1 has a greater than well B-1. Formation temperature in Pematang SS for well A-1 ranges from 87OC to 97OC and well B-1 ranges from 80OC to 90OC (Figure 9 and 10).
Pematang Mud Stone (Pematang MS) Formation in well A-1 (1457-1719 m) has kF = 6.6010-3 cgs and well
B-1 (B-1B-160-B-13B-18 m) has kF = 5.5510-3 cgs. Pematang MS Formation lithology for both wells are mudstone or shale
where well A-1 lithology has younger age than well B-1. In this formation, well A-1 has bigger kF although the lithology age younger. This was due to the formation lithology depth where well A-1 located in deeper depth than well B-1. Formation temperature in Pematang MS for well A-1 ranges ±107OC and well B-1 ranges from 90OC to
100OC (Figure 9 and 10).
Pematang Brown Shale (Pematang BRSH) Formation well A-1 (1719-1780 m) has kF = 6.810-3 cgs and well
B-1 (1318-1342 m) has kF = 5.0810-3 cgs. Pematang BRSH Formation lithology for both wells are coal where well
A-1 lithology has older age than well B-1. In this formation, well A-1 has bigger kF despite its younger age. This is due to the formation lithology depth where well A-1 located in deeper depth than well B-1. Formation temperature in BRSH for well A-1 ranged from 107OC to 117OC where well B-1 ranges from 90OC to 100OC (Figure 9 and 10).
Pematang LP Formation well A-1 (1780-1880 m) has kF = 7.0110-3 cgs and well B-1 (1342 1362 m) has kF =
5.3010-3 cgs. LP Pematang Formation well A-1 has sand (25 m thick) and shale (75 m thick) lithology, while well
B-1 has only shale (20m) lithology. In this formation, the well A-1 has bigger kF than well B-1 dispite the same age lithology. This is due to the formation lithology where well A-1 located in deeper depth than well B-1. Formation temperature in Pematang Formation LP for well A-1 ranges from ± 117OC and well B-1 ranges from 90OC to 100OC
(Figure 9 and 10).
CONCLUSIONS
(1) The thermal conductivity of rocks obtained by measuring the core have almost the same price (slight difference) as the thermal conductivity of rocks calculation based on .
(2) It cause kF, kGF, GRADT, kW, and Q have almost the same price for both measurement and calculation. (3) The temperature based on the thermal conductivity of rocks calculation also have almost the same price to temperature based on the thermal conductivity of rocks measurement for each formations
(4) The temperature of well A-1 with 6443.4 ft (1963.9 m) depth, ranges from 27OC (surface) to 127OC
(basement), while well B-1 with 4606 ft (1403.8 m) depth, ranges between 30OC (surface) to 100OC (basement).
REFERENCES
1. Dewanto, O., “Analisa Hubungan Aliran Panas Bumi Terhadap Awal Maturasi Hidrokarbon pada Cekungan
Minyak di Jawa Barat-Utara,” Jurnal Sains dan Teknologi, Unila,2001.
2. Dewanto, O., “Analisa Hubungan Porositas Terhadap Konduktivitas Panas Batuan Hasil Pengukuran dan
Perhitungan pada Sumur Minyak,” Jurnal Sains dan Teknologi,Unila, 2002.
3. Dresser Atlas, “Well Logging and Interpretation Techniques,” The Course For Home Study, (Dresser Industries Inc., 1982), pp. 22-32, 39-94, 102-129, 165-178.
5. Gretener, P.E., “Geothermics: Using Temperature in Hydrocarbone Exploration,” in Short Course San Francisco Annual Meeting May 1981, The American Association of Petroleum Geologists Tulsa, (Oklahoma, USA, 1982), pp.1- 67.
6. Klemme, H.D., “Heat Influences size of oil giants-geothermal gradients,” The Oil and Gas J., (1972), Juli 17, pp. 136-144 (pt.I), and July 24, pp. 76-78 (pt.II).
7. Koesoemadinata, R.P., “Geologi Minyak dan Gas Bumi,” (ITB, Bandung, 1978), pp. 194-204.
8. Landes, K.K., “Eometamorphism, and oil and gas in time and space”, Am.Assoc. Petroleum Geol. Bulletin
v.44 n.10, (1967), pp. 1682-1691.
9. Nakayama, K., and Lerche, I., “Basin Analysis by Model Simulation: Effect of Geologic Parameters on 1D and
2D Fluid Flow Systems with Applications to an Oil Field,” Gulf Coast Assoc. Geol. Soc Trans, v.37, (1987),
pp.175-184.
10. Siswoyo dan S. Subono, “Heat Flow, Hydrocarbon Maturity and Migration in Northwest Java”, CCOP
Technical BulletinVol. 25, (March 1995), pp. 23-36.
11. Subono, S., dan Siswoyo, “Thermal Studies of Indonesian Oil Basin”, CCOP Technical Bulletin Vol. 25,
Attachment
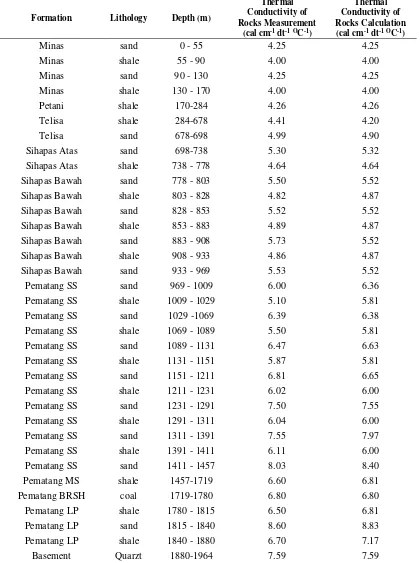
.TABLE 1. Lithology data, depth, and thermal conductivity of rocks based on measurement and calculation results in well A-1
Formation Lithology Depth (m)
Thermal Conductivity of Rocks Measurement
(cal cm-1 dt-1OC-1)
Thermal Conductivity of Rocks Calculation (cal cm-1 dt-1OC-1)
Minas sand 0 - 55 4.25 4.25
Minas shale 55 - 90 4.00 4.00
Minas sand 90 - 130 4.25 4.25
Minas shale 130 - 170 4.00 4.00
Petani shale 170-284 4.26 4.26
Telisa shale 284-678 4.41 4.20
Telisa sand 678-698 4.99 4.90
TABLE 2. Lithology data, depth, and thermal conductivity of rocks based on measurement and calculation results in well B-1
Formation Lithology Depth (m)
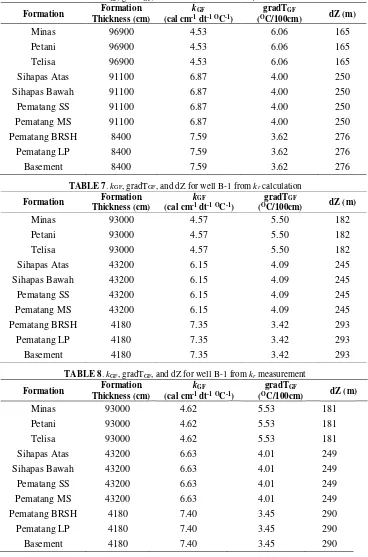
TABLE 6. kGF, gradTGF, and dZ for well A-1 from kr measurement
Formation Formation
Thickness (cm)
kGF
(cal cm-1 dt-1OC-1)
gradTGF
(OC/100cm) dZ (m)
Minas 96900 4.53 6.06 165
Petani 96900 4.53 6.06 165
Telisa 96900 4.53 6.06 165
Sihapas Atas 91100 6.87 4.00 250
Sihapas Bawah 91100 6.87 4.00 250
Pematang SS 91100 6.87 4.00 250
Pematang MS 91100 6.87 4.00 250
Pematang BRSH 8400 7.59 3.62 276
Pematang LP 8400 7.59 3.62 276
Basement 8400 7.59 3.62 276
TABLE 7. kGF, gradTGF, and dZ for well B-1 from kr calculation
Formation Formation
Thickness (cm)
kGF
(cal cm-1 dt-1OC-1)
gradTGF
(OC/100cm) dZ (m)
Minas 93000 4.57 5.50 182
Petani 93000 4.57 5.50 182
Telisa 93000 4.57 5.50 182
Sihapas Atas 43200 6.15 4.09 245
Sihapas Bawah 43200 6.15 4.09 245
Pematang SS 43200 6.15 4.09 245
Pematang MS 43200 6.15 4.09 245
Pematang BRSH 4180 7.35 3.42 293
Pematang LP 4180 7.35 3.42 293
Basement 4180 7.35 3.42 293
TABLE 8. kGF, gradTGF, and dZ for well B-1 from kr measurement
Formation Formation
Thickness (cm)
kGF
(cal cm-1 dt-1OC-1)
gradTGF
(OC/100cm) dZ (m)
Minas 93000 4.62 5.53 181
Petani 93000 4.62 5.53 181
Telisa 93000 4.62 5.53 181
Sihapas Atas 43200 6.63 4.01 249 Sihapas Bawah 43200 6.63 4.01 249 Pematang SS 43200 6.63 4.01 249 Pematang MS 43200 6.63 4.01 249 Pematang BRSH 4180 7.40 3.45 290
Pematang LP 4180 7.40 3.45 290
FIGURE 1. Relationship between thermal conductivity of rocks measurement and depth for well A-1
FIGURE 2. Relationship between thermal conductivity of
rocks calculation and depth for well A-1
FIGURE 3. Relationship between thermal conductivity of rocks measurement and depth for well B-1
FIGURE 4. Relationship between thermal conductivity of
rocks calculation and depth for well B-1
FIGURE 5. Relationship between thermal conductivity of rocks measurement and sand porosity for well A-1
FIGURE 6. Relationship between thermal conductivity of
FIGURE 7. Relationship between thermal conductivity of
FIGURE 9. Formation temperature for A-1 from thermal conductivity of rocks measurement (A) and calculation (B)
FIGURE 10. Formation temperature for B-1 from thermal conductivity