Optimal Control on Model of SARS Disease Spread
with Vaccination and Treatment
Ririt Andria Sari
1*, Ummu Habibah
2, Agus Widodo
21Master Program of Mathematics, Faculty of Mathematics and Natural Sciences, University of Brawijaya, Malang,
Indonesia
2Department of Mathematics, Faculty of Mathematics and Natural Sciences, University of Brawijaya, Malang, Indonesia
Abstract
The spread of SARS (Severe Acute Respiratory Syndrome) disease in a human population is one of the phenomena that can be mathematically modeled. The exposed period of SARS disease underlies the formation of the SVEIR epidemic model which is a modification of the SVIR epidemic model by adding subpopulation E (exposed). In the SVEIR model, there are two control variables in the form of vaccination and treatment which aimed to minimize exposed subpopula-tion, infected subpopulasubpopula-tion, and control implementation cost. The Pontryagin’s minimum principle is used to obtain optimal control and system, thus minimizing objective functional as the objective to be achieved. Furthermore, the forward-backward sweep method is used for numerical simulation in order to determine the most appropriate control strategy in a finite time. The simulation results show that implementation of both vaccination and treatment is the most effective decision making to control the spread of SARS disease.
Keywords:optimal control, Pontryagin’s minimum principle, SARS.
INTRODUCTION
Infectious diseases are caused by pathogens or biological agents such as virus, bacteria, fungi, and other microorganisms. Infectious diseases can be transmitted from one individual to another through a variety of intermediate such as body fluids, feces, and tools contamined by individual infected SARS virus [1]. Susceptible individual can be infected with the SARS virus as a result of making contact with infected individu-al so that it can lead to new infection that will spread the disease to other susceptible individu-al. This event is a sign of the spread of disease in a society or country that can increase mortality in a short time. It is reported by the WHO that in-fectious disease contribute about 1/6 of total deaths worldwide and second factor causes of death [2].
SARS is an infectious disease caused by virus. The clinical symptoms of SARS disease are fever, dry cough, shortness of breath, and other symp-toms similar to pneumonia [3]. The spread of SARS disease is very rapid, progressive, and fatal. Most people with SARS disease are adults be-tween 25-70 years, but in some cases SARS also affects children under 15 [4]. The spread of SARS disease was first detected in November 2002 in
Correspondence address:
Ririt Andria Sari
Email : [email protected]
Address : Dept. Mathematics, University of Brawijaya, Veteran Malang, Malang 65145.
Guangdong province, China. Furthermore, SARS disease spread rapidly throughout the continent, especially in the Asia-Pacific region. In March 2003, WHO reported SARS disease caused by a virus called coronavirus or SARS-CoV [3]. That caused 774 people died and 8098 people infect-ed SARS-coV virus [5]. The extermination of the SARS outbreak is estimated to have cost about $ 10-30 billion [6]. However, the amount of funds spent does not necessarily overcome the disease outbreaks optimally.
The impact of infectious diseases are very harmful in a country or population, it is im-portant to understand the dynamics of disease progression and develop the control of disease spread and consider the costs associated with control implementation. In this case, a mathe-matical model is needed to illustrate future dis-ease spread by involving information in the pre-sent. Mathematical modeling is an important tool in understanding the dynamics of disease spread and decision-making processes related to the control program of a disease spread. The branch of mathematics developed to find the optimal way of controlling dynamic systems is called op-timal control theory. The application of opop-timal control theory aims to estimate the effectiveness of various policies, control measures, and their associated costs [7].
deaths each year and 25 diseases with vaccina-tion approved by WHO. In recent decades, vac-cination and some control policies such as treat-ment, quarantine, isolation, screening, etc. are also applied to control the spread of infectious diseases [2].
In 2017, Kumar and Srivastava added control variables to the SVIR (Susceptible Vaccinated Infected Recovered) epidemic model in order to control the spread of the disease. In addition to vaccinations, treatment is also needed to prevent the spread of disease. Therefore, vaccination and treatment control strategies are used. On the economic side, the implementation of a control strategy within a country requires substantial cost. Limited funding by health or government institutions is a matter to be considered, so Ku-mar and Srivastava also consider the costs in their research [2].
Some infectious diseases such as tuberculosis, influenza, measles, etc. have exposed period in the natural world. In the exposed period the sus-ceptible individu does not show symptom of the disease and does not transmit the disease be-cause the immune system is in good condition. This individu will stay in the exposed class during the exposed period. After the exposed period end or the immune decrease, the individu is in the class of infection and shows symptoms and then transmit the disease [8].
Epidemic models with latent stage and vac-cination were investigated, expressed in the form of SVEIR namely SusceptibleVaccinatedExposed Infected Recovered [9]. Before the study, the SVEIR model has been studied to describe the spread of SARS disease [10]. However, there is no effort to control the spread of disease from those researchs. Previous research aimed to assess the potential impact of an anti-SARS vaccine is not perfect through mathematical modeling [10]. Further result show that an imperfect anti-SARS vaccine successfully reduces the spread of SARS in the community on the condition that the vac-cine must have efficacy or effectiveness of at least 75% [10].
This study modifies the SVIR epidemic model into SVEIR by adding exposed subpopulation (E). This is due to the exposed period of SARS for 3-5 days [1] and the subpopulation model E is based on the study [9]. In addition to adding subpopula-tion E, it is assumed that individual infected with SARS cannot recover naturally by model [1]. This modification has a goal to make the model more real. Furthermore, two control functions that is vaccination control and treatment control are
added to the SVEIR model. Vaccination is used to control the spread of SARS disease, where sus-ceptible individual is given anti-SARS vaccine to build up immunity against SARS virus [10], and apply control policies in the form of treatment given to individuals infected with SARS. The ex-istence of control function in this study aims to minimize exposed subpopulation and infected subpopulation so that the spread of SARS disease is not widespread and minimize the costs associ-ated with the implementation of control. Optimal control issues resolved with the Pontryagin’s minimum principle. At the end, a numerical simu-lation is done using the forward-backward sweep method. Furthermore, the simulation results are analyzed to determine the most effective control strategies in controlling the spread of SARS dis-ease.
MATERIALS AND METHODS
In this study, SARS disease spread model as-sumed that the individual who became the object of research is human, interaction between indi-vidu occur in one population without any indiindi-vidu entering or leaving the population, the birth rate and the death rate are constant. The spread of SARS disease in this study focused on one popu-lation divided into 5 subpopupopu-lations, namely sus-ceptible subpopulation 𝑆, vaccinated subpo-pulation 𝑉, exposed subpopulation 𝐸, infected subpopulation 𝐼, and recovered subpopulation
𝑅. Furthermore, several research methods are used to achieve the objectives.
Literature Study
Literature study related to the research pro-cess, such as the literature discussing the spread of disease, optimal control theory, the Pontryagin principle, and forward-backward sweep method. We also used other supporting references in problem solving in this study.
Model Formulation
infected subpopulation (𝐼). Furthermore, an as-sumption is added to the SVEIR model that indi-vidual infected with SARS cannot recover natural-ly, it’s based on the model of Huang's research [1]. The addition of these assumption causes the natural recovery rate of infected individual is zero.
Optimal Control Simulation
Formulated optimal control problem and re-solved with the Pontryagin’s minimum principle. Based on these principle required a necessary condition that must be met. The necessary condi-tion can be generated with the Hamiltonian H function. The H function must be optimal in order to obtain the optimal system. If the optimal sys-tem then achieved the optimal goal. The syssys-tem can achieve optimal if the H function satisfies state equations, costate equations, and stationer condition.
Numerical simulation is performed for opti-mal control problem. The simulation includes simulating the spread of SARS disease when not given vaccination and treatment controls, when only vaccination control is given, when only treatment control is given, and when combina-tion control of vaccinacombina-tion and treatment are given. The numerical simulation is solved using the forward-backward sweep method with Matlab software. The initial parameter values used in the simulations will be mentioned in the results and discussion. The initial parameter val-ues are used to analyze and emphasize the simu-lated results obtained.
Analyzing the results of numerical simulation to find out the most effective or appropriate con-trol strategies, thus minimize exposed subpopu-lation, infected subpopusubpopu-lation, and costs associ-ated with the implementation of control (vac-cination and treatment).
RESULT AND DISCUSSION SARS Epidemic Model
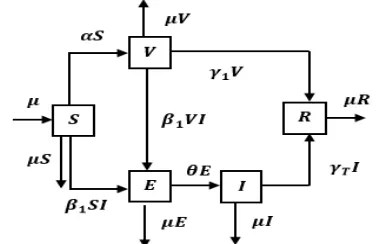
In this section, the SVEIR epidemic model is formulated to illustrate the spread of SARS in a population divided into 5 subpopulations. Indi-vidu in each subpopulation interact with each other. This interaction causes the movement of individu from one subpopulation to another. The flow of individu movement from one subpopula-tion to another subpopulasubpopula-tion is illustrated in Figure 1. The arrows entered in a subpopulation indicate the presence of incoming individual, so the number of individual in the subpopulation increases. The outbound arrows of a
subpopula-tion indicate the presence of an outgoing individ-ual, so the number of individuals in the subpopu-lation is reduced.
Figure 1. Compartment diagram of the SVEIR epidemic model
The number of individuals in each subpopula-tion may vary from time to time due to the influ-ence of natural factors such as birth and death as well as the presence of susceptible individual into infected individual and so on, so that the number of individuals each time can be expressed
𝑆(𝑡), 𝑉(𝑡), 𝐸(𝑡), 𝐼(𝑡), 𝑅(𝑡).
The rate of susceptible subpopulation change between time 𝑡0 and 𝑇 is
𝑑𝑆 𝑑𝑡 = lim∆𝑡→0
∆𝑆(𝑡) ∆𝑡 .
The rate of subpopulation change also applies to the rate of change of vaccinated, exposed, infected, and recovered subpopulation. Based on Figure 1, the SARS disease spread model is ex-pressed in the system of differential equations as follows:
, S S SI dt
dS
, 1
1VI V V
S dt dV
, 1VI E E SI
dt dE
(1)
, I I I E dt dI
T
,
1V I R
dt dR
T
with initial density
. 0 ) 0 ( , 0 ) 0 ( , 0 ) 0 ( , 0 ) 0 ( , 0 ) 0
( V E I R
S
natural rate, is the transmission rate of disease when infected individual make contact with susceptible individual.
1 represent thetrans-mission rate of disease from individual infected with SARS against vaccinated individual who have not been immune to the disease, is constant vaccination rate in susceptible subpopulation,
1 represent immunity rate of vaccinated individual so that individual become recovered individual during or after the vaccination process,
T istreatment rate of infected individual, dan
represent rate of exposed individual become infected individual.Vaccination and treatment are selected as control policies because vaccination are easy obtained and applied in practice and supported by WHO [2]. Therefore, in this study, the SARS disease spread model expressed in model system (1) is modified into a model system (2) with vac-cination and treatment as a control strategy to be discussed in the next chapter.
Optimal Control Problem
The SARS disease spread model with vaccina-tion and treatment control strategies is obtained based on the system of equation (1) and the fol-lowing statements.
i. Susceptible subpopulation are given anti-SARS vaccine with the aim of providing im-munity to susceptible individual from SARS disease, thereby preventing transmission of the disease to susceptible individual. In some diseases, constant vaccination may not be a good choice in the economic context for any country. In addition, vaccine administration for large population need substantial cost and difficult to give vaccine for all susceptible in-dividual in the population. Therefore, it is im-portant to know the exact level and timing of the vaccine so that maximize the vaccinated individual with minimum vaccination cost over a finite time period. According to Kumar and Srivastava [2], it can be done by changing the constant vaccination rate
on model (1) becomeu1(t) function as vaccination control.Due to limited fund and time for health agen-cies in implementing vaccination poliagen-cies, then the policies should be limited in accord-ance with established goal. Thus, it is as-sumed that vaccination control is limited, i.e.
1 ) (
0u1 t [2].
ii. Infected subpopulation are given treatment to reduce the burden of disease and control
the spread of infection. Treatment programs include diagnosis, drug administration, hospi-talization, and other medical services. Similar to vaccination programs, treatment programs for infected individuals also require a large
u as treatment control and assumed that
1 ) (
0u2 t [2].
Thus, SARS disease spread model with vac-cination and treatment control is as follows:
, each disease is varied and the implementation of the control strategy depend on the objective of the control policy. Implementation of control will be stopped when the objective have been achieved.
Application of optimal control theory in case of SARS disease spread with vaccination and treatment aims to minimize exposed subpopula-tion, infected subpopulasubpopula-tion, and costs associat-ed with control implementation. This objective is expressed in an objective function J,
i.e.
,
initial value of each subpopulation is known i.e. value after vaccination and treatment control are given, so it can be seen the effectiveness of the methods to prevent the spread of SARS disease. If the functional value in equation (3) has a min-imum functional value, then the control strategy is more effective. defined as follows:
𝐻(𝑡, 𝑥⃗, 𝑢⃗⃗, 𝜆⃗) = 𝑓(𝑡, 𝑥⃗, 𝑢⃗⃗)
functions dependent on the number of state var-iables. The state variable in this research are 5(
𝑆, 𝑉, 𝐸, 𝐼, 𝑅). Furthermore,
𝐻
function must beoptimal to obtain the optimal J value, that is
state equation, costate equation, and stationary condition must be satisfied.
The state equation is satisfied when the par-tial derivative of 𝐻
function to adjoint function
𝜆 yields equations in system (2). The costate equa-tion is satisfied when the partial derivative of the𝐻 function for each state variable is negative. The stationary condition is obtained when the partial derivative of the 𝐻
function to the control
variableu
1(
t
)
and
u
2(
t
)
is zero, so that theu are substituted in the state and costate equations then the opti-mal system is obtained which can optimize the objective function J.
Numerical Simulation
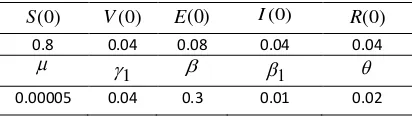
In this section, numerical simulation results are used to analyze the impact of control policy strategies on disease dynamic and related costs of control implementation. Numerical simula-tions of systems (2) and (3) use forward-backward sweep method in the MATLAB soft-ware. Initial values and parameter values are used for numerical simulations are presented in table 1.
Table 1. Initial Values and Parameter Values ) cy, three numerical control strategies are per-formed, i.e.
strategy A: implementation of a single control policy that only applies vaccination to prevent the spread of SARS dis-ease,
strategy B: implementation of a combination control policy: vaccination and treatment to prevent the spread of SARS disease, and
strategy C: implementation of a single control policy that only applies treatment to prevent the spread of SARS dis-ease.
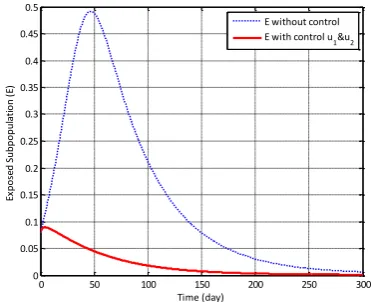
The discussion of this paper includes numeri-cal simulation by implementing control strategies A, B, C, and without vaccination or treatment control. The numerical simulation result in Figure 2 show the changes in behavior of exposed sub-population (E) when applied control strategy A, B, C and the weight of costs w1w220.The number of exposed subpopulation has increased each time when no vaccination or treatment con-trol are provided. After concon-trol strategy A is ap-plied, the number of exposed subpopulation de-creases faster than without control. The number of exposed subpopulation also decreased when applied control strategy B, i.e. the combination control strategy of vaccination and treatment are applied.
reduce the number of exposed subpopulation. Thus, the implementation of vaccination control only can minimize the number of exposed sub-population. However, it is better to be given a combination of controls i.e. vaccination and treatment to suppress the number of exposed subpopulation.
Figure 2. Density of Exposed Subpopulation (E) with Control Strategy A, B, C, and Without Control
The change in the number of infected sub-populations (I) at any time in Figure 3 is same as the number of exposed subpopulation. The num-ber of subpopulation I decreased significantly when the combination control of vaccination and treatment are given. The strategy is more effec-tive than either vaccination control strategy only or treatment control strategy only.
Figure 3. Density of Infected Subpopulation (I) with Control Strategy A, B, C, and Without Control
From the Figures 2 and 3, it can seen that the number of exposed (E) and infected (I) subpopu-lations reach the least value when combination control of vaccination and treatment is given. In other words, control strategy B is more effective than control strategy A and C. Level of
vaccina-tion and treatment are given every time (day), it can be seen in Figure 4. At first, vaccination con-trol is given equal to 0.16 and treatment concon-trol is 0.07. When the number of exposed and infect-ed subpopulations decrease, vaccination and treatment control are lowered to zero. That means, control of vaccination and treatment are stopped.
Figure 4. Vaccination control u1and treatment control u2
are given every time (day)
Figure 5 shows the effect of the weight of vaccination cost w1
and the weight of treatment
cost w2 on the number of exposed subpopula-tion (E), w1w22000. When the weight of vaccination and treatment costs is enlarged a hundred times from the initial weight, the num-ber of exposed subpopulation is not much differ-ent from the number of exposed subpopulation when no control is given. This is due to very small vaccination and treatment controls that is equal to8.391103and2.96103, as shown in Fig-ure 7.Figure 5. Density of Exposed Subpopulation (E) with Strategy Control B and Without Control when E with control u
1&u2
E with control u
1
I) I without control
I with control u
1&u2
I with control u
1 E with control u
The small levels of vaccination control and treatment resulted in the number of infected subpopulations (I) not minimal, as the simulation results in Figure 6. That means, the population is still in an endemic condition where the spread of the disease occurs continuously.
Figure 6. Density of Infected Subpopulation (I) with Strategy show that the number of exposed subpopulation is more minimum than the number of exposed subpopulation on other simulation results. This is similar to the change in the number of infected subpopulation in Figure 9. This is because the control level of vaccination and treatment is greater than the control level of other simula-tions, as shown in Figure 10. The vaccination con-trol is given equal to 0.4322 and the treatment control is 0.3 at first. After the number of ex-posed and infected subpopulations decrease, the control level of vaccination and treatment is
re-duced every time until it reaches zero value where the control is discontinued.
Figure 8. Density of Exposed Subpopulation (E) with Strategy Control B and Without Control when w1w22 tional J in equation (3). The objective functional value is influenced by the increase and decrease of the number of exposed subpopulation, infect-ed subpopulation, and controls.
0 50 100 150 200 250 300
u1: Vaccination u I with control u
1&u2
u1: Vaccination u
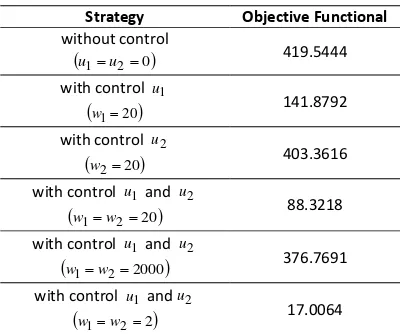
From Table 2, the minimum objective func-tional value is equal to 17.0064. If the objective functional value is smaller then the control strat-egy applied in controlling the spread of SARS dis-ease is more effective. Thus, it can be concluded that control combination strategy of vaccination and treatment with small cost weight is the most effective strategy.
Table 2. The objective functional value of each simulation for
300
t
Strategy Objective Functional without control
u1u20
419.5444with control u1
w120
141.8792with control u2
w220
403.3616with control u1and u2
w1w220 88.3218
with control u1 and u2
w1w22000
376.7691with control u1 andu2
w1w22
17.0064CONCLUSION
In this research, we conclude that the imple-mentation of combination control strategy in the form of vaccination and treatment is more effec-tive to reduce the number of exposed subpopula-tion (E) and infected subpopulasubpopula-tion (I) than either the control strategy of vaccination only or the control strategy of treatment only. The weight of costs of vaccination and treatment controls can affect the levels of vaccination and treatment. If the weight of costs of vaccination and treatment are lower then the vaccination and treatment levels are greater. If the levels of vaccination con-trol and treatment are getting bigger then the number of exposed and infected subpopulations are getting smaller. As a result, the objective functional value is getting smaller.
ACKNOWLEDGEMENT
We would like to express our gratitude to Biomathematics Group Study and LPPM, University of Brawijaya, Indonesia in accordance with the agreement of the research program implementation no: 730.8/UN10.C10/PN/2017 for financial support to this research.
REFERENCES
[1] Huang, G. 2016. Artificial infectious disease optimization: A SEIQR epidemic dynamic
model-based function optimization algo-rithm. Swarm Evol. Comput. 27. 31-67. [2] Kumar, A., P.K. Srivastava. 2017.
Vaccina-tion and treatment as control intervenVaccina-tions in an infectious disease model with their cost optimization. Commun. Nonlinear Sci. Nu-mer. Simul. 44. 334-343.
[3] Gumel, A. B., S. Ruan, T. Day, J. Watmough, F. Brauer, P.V.D. Driessche, D. Gabrielson. C. Bowman, M.E. Alexander, S. Ardal, J. Wu, B.M. Sahai
.
2004. Modelling strategies for controlling SARS outbreaks. Proc. Biol. Sci.271(1554). 2223-2232.
[4] Surjawidjaja, J.E. 2003. Sindrom Pernafasan Akut Parah (Severe Acute Respiratory Syndrome/SARS): suatu epidemi baru yang sangat virulen. Kedokteran Trisakti. 2(22). 76-82.
[5] Yan, X., Y. Zou. 2008. Optimal and sub-optimal quarantine and isolation control in SARS epidemics. Math. Comput. Model.
47(1-2). 235-245.
[6] World Health Organization. 2005. Combating emerging infectious diseases in the South-East Asia Region. February Edition.
[7] Otieno, G., J.K. Koske, J.M. Mutiso. 2016. Transmission dynamics and optimal control of malaria in Kenya. Discret. Dyn. Nat. Soc. Article ID 8013574. 27 pages.
[8] Sahu, G.P., J. Dhar. 2012. Analysis of an SVEIS epidemic model with partial temporary immunity and saturation inci-dence rate. Appl. Math. Model. 36(3). 908-923.
[9] Li, J., Y. Yang, Y. Zhou. 2011. Global stability of an epidemic model with latent stage and vaccination. Nonlinear Anal. Real World Appl. 12(4). 2163-2173.