UTILIZATION OF TORAY FLY ASH AS FILLER SUBSTITUTION IN THE HOT ROLLED SHEET-WEARING COURSE (HRS-WC) MIXTURE
F. Candra
Directorate General of Highways Ministry of Public Works, Jl. Pattimura No. 20 Jakarta E-mail: [email protected]
L.B. Suparma
Department of Civil and Environmental Engineering Universitas Gadjah Mada Jl. Grafika No.2 Kampus UGM 55281, Indonesia, Fax: +62-274-524712
E-mail: [email protected] ABSTRACT
In road construction materials, the utilization of fly ash as additive materials is limited and also small in quantity, while the disposal of fly ash is quite high. An abundance of fly ash can be found at PT Toray Company in Jakarta and Surabaya. Toray fly ash is disposed coal ash resulting from coal-fired electricity generating power plants. Toray fly ash in this research is used as substitute mineral filler in asphalt paving mixtures. Research on utilization of Toray fly ash as filler is conducted in the Hot Rolled Sheet – Wearing Course Mixture. Filler content in the HRS –WC mixture is 9%. Variations of Toray fly ash in the mixture tested are 0%, 25%, 50%, 75%, 100% and the variations of asphalt content are 6%, 6.5%, 7%, 7.5%, 8%. Marshall test is performed to determine the Optimum Asphalt Content and Marshall Stability, Indirect Tensile Strength (ITS) test and Tensile Strength Ratio (TSR) to select the optimum Toray fly ash utilization in the mixture based on the moisture susceptibility of specimens. The research results show that in variations of 0%, 25%, 50%, 75% and 100% Toray fly ash in the HRS-WC Mixture, the Optimum Asphalt Contents are at 6.8%, 7.0%, 7.0%, 7.1% and 7.6% and Marshall Stability values of the variations are 1649 kg, 1541 kg, 1568 kg, 1678 kg, 1718 kg respectively. TSR values in variations of Toray fly ash are 98.32%, 90.28%, 89.38%, 87.62%, 64.71% respectively, with Minimum TSR value required is 80%. Based on the overall parameters, the optimum Toray fly ash utilization in the HRS-WC Mixture recommended is 75% of Toray fly ash at 7.1% Optimum Asphalt Content.
Keywords: Toray fly ash, filler, HRS-WC, Marshall Test, Marshall Stability, OAC, ITS, TSR.
INTRODUCTION A.Background
In road construction materials, the utilization of fly ash as additive materials is limited and also small in quantity, while the disposal of fly ash is quite high. An abundance of fly ash can be found at PT Toray Company in Jakarta and Surabaya. Facing the fact, it is necessary to consider a research on utilization of Toray fly ash, used as filler in the Hot Rolled Sheet – Wearing Course (HRS-WC) Mixture.
B. Research Objective
LITERATURE REVIEW A.Asphalt (Bitumen)
Asphalt is of particular interest to the engineer because it is strong cement, readily adhesive, highly waterproof, and durable. The primary use of asphalt (Bitumen) is in road construction, where it is used as the glue or binder for the aggregate particles. According to ASTM-D8 (1997), “Asphalt is a dark brown to black cementitious material in which predominating constituents are bitumens which occur in nature or are obtained in petroleum processing”.
B. Asphalt Pavements
Asphalt Pavement is a construction above the prepared subgrade to resist the repetition of traffic vehicular loads and distribute the loads over the subgrade. An asphalt pavement structure consists of surface course, base course, sub base course, subgrade.
C.Hot Rolled Asphalt Surface
Hot rolled asphalt surface course is dense mixture of mineral filler, sand and bitumen into which a coarse aggregate is added. It is gap-graded material, the mechanical properties of which are dominated by the mortar.
D. Component Materials 1. Aggregates
The amount of mineral aggregate in asphalt paving mixture is generally 90 to 95 percent by weight or 75 to 85 percent by volume. Mineral aggregate is primarily responsible for the load supporting capacity of pavement.
a) Coarse aggregate
Coarse aggregate is defined in this research as that substantially retained on the 8 (2.36 mm) sieve. Specification for coarse aggregate used is based on The Ministry of Public Works (2007)
b) Fine aggregate
Fine aggregate is defined as that „shall substantially‟ pass an 8 (2.36 mm) sieve. Specification for fine aggregate used is based on the Ministry of Public Works, Institute of Road Engineering (2007) 2. Filler
Filler desirable were aggregate passing the No. 200 sieve and non-plasticity. Filler must be dry and clean from clay lumps and friable particles
appropriate SNI 03-6723-2002 (Ministry of Public Works, IRE 2007)
3. Asphalt
Asphalt used is asphalt cement ex PERTAMINA penetration 60/70.
4. Fly Ash
Fly ash produced from the burning of pulverized coal in a coal-fired boiler is a fine-grained, powdery particulate material that is carried off in the flue gas and usually collected from the flue gas by means of electrostatic precipitators, baghouses, or mechanical collection devices such as cyclones.
a) Class F fly ash
The burning of harder, older anthracite and bituminous coal typically produces Class F fly ash.
b) Class C fly ash
Fly ash produced from the burning of younger lignite or subbituminous coal, in addition to having pozzolanic properties, also has some self-cementing properties. THEORETICAL APPROACH
A.Hot Rolled Sheet-Wearing Course (HRS-WC) Hot rolled sheet in the basic is a surface course with mortared sand asphalt that may divide in two types of mixture, HRS-Base and HRS-Wearing Course (HRS-WC) which maximum aggregate size is 19-mm. Hot rolled sheet are gap-graded predominantly sand mixed with asphalt cement, layered and compacted in a particular temperature.
B. Marshall Test
The Marshall method seeks to select the asphalt binder content at a desired density that satisfies minimum stability and range of flow values (White, 1985).
1. Stability
The Marshall Stability test provides the performance prediction measure for the Marshall Mix design method.
(1)
Where,
S = stability numeral (kg)
R = Proving ring calibration (kg) T = the matter test correction factor
2. Flow
The flow is measured at the same time as the Marshall stability. The flow is equal to the vertical deformation of the sample (measured from start of loading to the point at which stability begins to decrease) in hundredths of an inch (Roberts et al, 1991).
3. Marshall Quotient (MQ)
Marshall Quotient (MQ) is the ratio of stability over flow, which indicates mixture stiffness. The Marshall Quotient is calculated from the following equation.
(2)
4. Volumetric Properties of specimen
The volumetric properties of a compacted asphalt mixture provide indications of the potential performance of the mixture as a pavement. Volumetric properties are used in the two most common laboratory design procedures Marshall and Super Pave, Patrick G. Lavin (2003).
5. Voids in the Mineral Aggregates (VMA) Voids in the Mineral Aggregate (VMA) are the total volume of voids within the mass of the compacted aggregate.
(3)
6. Voids in the Total Mix (VITM)
A Voids In the Total Mix (VITM) expressed as a percent of in mixture that affects the stiffness and durability.
(4)
7. Voids Filled with Asphalt (VFWA)
Voids Filled with Asphalt calculated from VMA and air void content.
(5)
8. Indirect Tensile Strength Test
Suparma (2001), in Indirect Tensile Strength (ITS) test cylindrical specimens are subjected to compressive loads, which act parallel to and along the vertical diametrical plane using the Marshall loading Machine.
(6)
RESEARCH METHODOLOGY A.Research Material
Research materials used in this research are as follow:
1. Aggregates and filler
Aggregate used in this research are coarse aggregate, fine aggregate from Clereng Kulon Progo district, Jogjakarta, Toray fly ash as filler and Stone dust filler.
2. Asphalt
Asphalt 60/70 penetration grade (ex. PERTAMINA) is used in the research based on Ministry of Public Works, Institute of Road Engineering (2007) specification.
B. Research Apparatus 1. Asphalt test apparatus
The apparatus used for physical properties test of asphalt, are asphalt Penetration test apparatus, Softening point, Flash point, lost on heating, Solubility, Ductility, apparatus, and Specific gravity.
2. Aggregate test apparatus
The apparatus used for quality of an aggregate, are Los Angeles Abrasion Machine, Density, Sand equivalent equipment
C.Marshall Test Apparatus
The apparatus used to conduct Marshall test are Flat bottom metal pans, Round metal pans, Oven and hot plate, Scoop, Thermometers, Balances, Mechanical mixture, Compaction pedestial, Compaction mold, Compaction model, Mold holder.
D.Indirect Tensile Strength Test apparatus
Loading press is capable in applying a compressive load at a controlled deformation rate of 51 mm (2 in) per minute. Loading strips (kg/mm)
flow stability MQ
Gsb Ps Gmb
VMA 100
Gmm Gmb Gmm
VITM 100
VMA V V
100
VFWA MA ITM
d t Pmaks ITS
consisting of 13 x 13 mm (0.5 x 0.5 in) square steel bars for 102 mm (4 in) diameter specimens and 19 x 19 mm (0.75 x 0.75 in) square steel bars for 152 mm (6 in) diameter specimens. Machine the surface in contact with the specimen to the curvature of the test sample.
E. Research Location
The research was conducted in the Transportation Laboratory, Department of Civil and Environmental Engineering, Universitas Gadjah Mada, Yogyakarta.
F. Research Procedure 1. Preparation Phase
In this phase, materials and laboratory apparatus were prepared and checked. Apparatus check up was conducted for its functions, in respect of all the research methods used.
2. Material Preparation Phase
Materials prepared are those that fulfill the specification of the Ministry of Public Works, Institute of Road Engineering (2007) for Hot Rolled Sheet-Wearing Course (HRS-WC) Mixture.
3. Aggregates Gradation
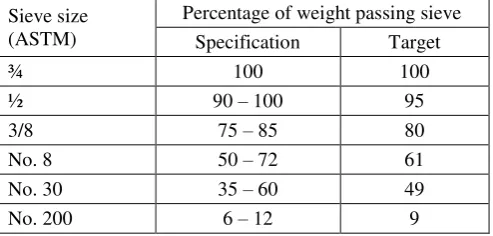
Aggregate grading specification for Hot Rolled Sheet-Wearing Course (HRS-WC) is based on the Ministry of Public Works, Institute of Road Engineering (2007) specification. Gradation used in this research is shown in Table 1.
Table 1. Aggregate gradation for HRS-WC mixture Sieve size
(ASTM)
Percentage of weight passing sieve Specification Target
¾ 100 100
½ 90 – 100 95
3/8 75 – 85 80
No. 8 50 – 72 61
No. 30 35 – 60 49
No. 200 6 – 12 9
Source: Ministry of Public Works, Institute of Road Engineering (2007)
4. Asphalt Content Estimate
In Indonesia, asphalt content estimate is calculated based on the Ministry of Public Works, Institute of Road Engineering (2007).
Pb = 0.035 × (% CA) + 0.045 × (% FA) + 0.18 × (% Filler) + C
5. Sample Design properties
The Sample design properties can be seen at Table 2.
Table 2. Sample design properties
No Samples
Toray fly ash (TFA) and stone dust (SD)
content variation (triplo/variation)
Number of sample TFA (%) SD (%)
1.
Marshall Test to identify Optimum Asphalt Content
(5 Variation)
100 0
5 x 5 x 3
= 75
75 25
50 50
25 75
0 100
2.
Marshall Test on Optimum Asphalt Content
100 0
5 x 1 x 3
= 15
75 25
50 50
25 75
0 100
3.
ITS Test on Optimum Asphalt Content Dry-conditioned specimen (ITSI)
100 0
5 x 1 x 3
= 15
75 25
50 50
25 75
0 100
4.
TSR Test on Optimum Asphalt Content wet-conditioned specimen (ITSII)
100 0
5 x 1 x 3
= 15
75 25
50 50
25 75
0 100
Total Samples 120
TEST RESULTS AND DISCUSSIONS A.Laboratory Test Result
Here is the result of HRS-WC Material Components Tests
Table 3. Coarse aggregate test result No Type of Test Unit Require
ment Result Remark 1 Los Angeles
abrasion test % Max 40 29.5 qualify 2 Asphalt
absorption % Min 95 98 qualify 3 Water
Absorption % Max 3 1.6 qualify 4 Bulk specific
gravity gr/cm
3
2.5 2.6 qualify 5 Apparent
specific gravity gr/cm
3
Table 4. Fine aggregate test result No Type of
Test Unit
Require-ment Result Remark 1 Water
Absorption % Max 3 1.635 qualify 2
Bulk Specific gravity
gr/cm3 Min 2.5 2.650 qualify
3
Apparent specific gravity
gr/cm3 Min 2.5 2.770 qualify
4 Sand
equivalent % Min 50 80.40 qualify
Table 5. Fillers test result No Type of
Test Unit
Require-ment Result Remark 1
Specific gravity of stone dust
gr/cm3 Min 2.5 2.722 qualify
2
Specific gravity of Toray fly ash
gr/cm3 Min 2.5 2.770 qualify
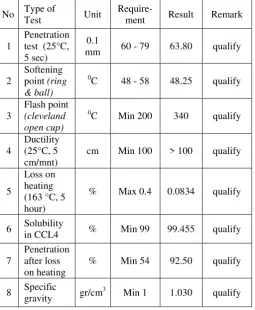
Table 6. Test result of asphalt AC 60/70 ex PERTAMINA No Type of
Test Unit
Require-ment Result Remark 1
Penetration test (25°C, 5 sec)
0.1
mm 60 - 79 63.80 qualify 2
Softening point (ring & ball)
0
C 48 - 58 48.25 qualify
3
Flash point
(cleveland open cup)
0
C Min 200 340 qualify
4
Ductility (25°C, 5 cm/mnt)
cm Min 100 > 100 qualify
5
Loss on heating (163 °C, 5 hour)
% Max 0.4 0.0834 qualify
6 Solubility
in CCL4 % Min 99 99.455 qualify 7
Penetration after loss on heating
% Min 54 92.50 qualify
8 Specific
gravity gr/cm
3
Min 1 1.030 qualify
B.Analysis Test Results
1. Marshall Test for Optimum Asphalt Content (OAC) Determination.
Table 7. Optimum asphalt content
2. Analysis of the Marshall Test Result
a) Density in the variations of Toray Fly ash to the Stone Dust filler
Density value shows the density of the compacted mixture and results from the ratio of the weight of a mixture to the weight of a unit volume of a mixture.
Figure 1. Density in the variations of Toray fly ash percentage
As shown in Figure 1, density in variations of 0%, 25%, 50%, 75% and 100% Toray fly ash on optimum asphalt content have the tendency to decrease with the increasing of Toray fly ash percentage in the mixture. Toray fly ash has 2.770 of specific gravity whilst stone dust 2.722. The differences in specific gravity value influence the average specific gravity of mixture variations. Specific gravity of Toray fly ash is higher than stone dust and it generates higher volume in the mixture.
Toray Fly ash
0%
Toray Fly ash
25%
Toray Fly ash
50%
Toray Fly ash
75%
Toray Fly ash
100% OAC
6.8%
OAC 7%
OAC 7%
OAC 7.1%
OAC 7.6% Density (gr/cm3) 2.301 2.293 2.293 2.290 2.273
2.250 2.260 2.270 2.280 2.290 2.300 2.310
Den
sity
(
g
r/cm
3
)
No Toray fly ash variation
in the HRS-WC Mixture OAC 1 0% Toray fly ash – 100% Stone dust 6.8% 2 25% Toray fly ash – 75% Stone dust 7.0% 3 50% Toray fly ash – 50% Stone dust 7.0% 4 75% Toray fly ash – 25% Stone dust 7.1% 5 100% Toray fly ash – 0% Stone dust 7.6%
Toray fly ash tends to create mortar with asphalt due to the higher effective asphalt content in a compacted mixture and the increasing of asphalt content will increase the inter-granular voids space between the aggregate particles which is not occupied by aggregate, hence decreasing the density value.
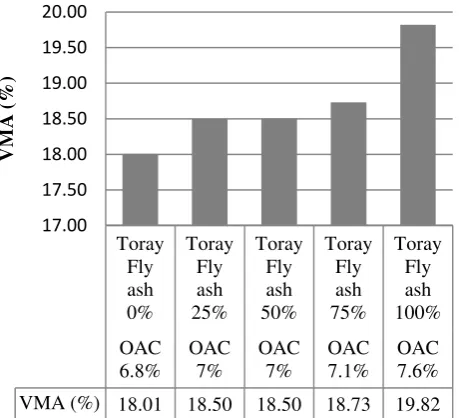
b) VMA in the variations of Toray Fly ash to the Stone Dust filler
Voids in the Mineral Aggregate in a compacted asphalt mixture is defined as the inter-granular void space between the aggregate particles in a compacted asphalt mixture that includes the air voids and the effective asphalt content (Lavin, 2003).
Figure 2. VMA in the variations of Toray fly ash percentage
Additionally, certain characteristics of a mixture that can change the VMA value and film thickness is dust proportion. Lower dust contents decrease surface area, increase film thickness, and tend to raise VMA. Research results shown in Figure 2 depicted that in variation of 0%, 25%, 50%, 75% and 100% Toray fly ash, VMA values in the mixture tend to decrease as the dust proportion decrease in variations. Dust proportions in variations are 1.48%, 1.43%, 1.43%, 1.41% and 1.31% respectively.
c) VITM in the variations of Toray Fly ash to the Stone Dust filler
Figure 3. VITM in the variations of Toray fly ash percentage
The VITM is that part of the compacted mixture not occupied by aggregate or asphalt expressed as a percentage of the total volume. Voids in the Total Mixture generally decreased with increasing asphalt content, until it reaches a minimum air void content. In the research result shown in Figure 3 depicted that VITM in the variation of 0% Toray fly ash is 4.45% on optimum asphalt content, whilst VITM values in variations of 25%, 50%, 75% and 100% Toray fly ash tend to increase with the increasing of Toray fly ash in the mixture. VITM values are 4.54%, 4.53%, 4.57%, 4.65% respectively. Based on Ministry of Public Works, Agency for Research and Development, Institute of Road Engineering (2007) HRS-WC specification, VITM values in overall variations fulfill the requirement.
d) VFWA in the variations of Toray Fly ash to the Stone Dust filler
The percent voids filled with asphalt, VFWA, increases with increasing asphalt content. This should be expected since the VMA is being filled with the asphalt (The Asphalt Institute 1993). VFWA are the percentage of voids filled with asphalt in a compacted mixture, influenced by asphalt content, aggregate gradation, compaction process, and temperature.
Toray Fly ash 0%
Toray Fly ash 25%
Toray Fly ash 50%
Toray Fly ash 75%
Toray Fly ash 100% OAC
6.8%
OAC 7%
OAC 7%
OAC 7.1%
OAC 7.6% VMA (%) 18.01 18.50 18.50 18.73 19.82
17.00 17.50 18.00 18.50 19.00 19.50 20.00
VM
A
(%)
Toray Fly ash 0%
Toray Fly ash 25%
Toray Fly ash 50%
Toray Fly ash 75%
Toray Fly ash 100% OAC
6.8%
OAC 7%
OAC 7%
OAC 7.1%
OAC 7.6% VITM (%) 4.45 4.54 4.53 4.57 4.65
2.50 3.00 3.50 4.00 4.50 5.00
VIT
M
(
Figure 4 depicted that in variations of 0%, 25%, 50%, 75%, and 100% Toray fly ash, VFWA values tend to increase due to the higher volume of mixture with the increasing of Toray fly ash percentage and optimum asphalt content. Hence, asphalt content filled the inter-granular void space between the aggregate particles in a compacted mixture.
Figure 4. VFWA in the variations of Toray fly ash percentage
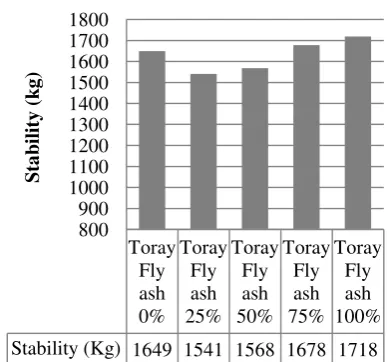
e) Stability in the variations of Toray Fly ash to the Stone Dust filler
Figure 5. Stability in the variations of Toray fly ash percentage
As shown in the Figure 5 Marshall Stability of 100% Toray fly ash mixture has a peak value as asphalt content in the mixture well absorbed by Toray fly ash variations.
f) Flow in the variations of Toray Fly ash to the Stone Dust filler
Flow increases with the increasing of Toray fly ash percentage and optimum asphalt content in the mixture is as shown in Figure 6.
Figure 6. Flow in the variations of Toray fly ash percentage g) MQ in the variations of Toray Fly ash to
the Stone Dust filler
Marshall Quotient is defined as the ratio of Marshall Stability to the Marshall Flow. The Marshall Quotient can be used to give an indication of the mixture stiffness. The higher the ratio, the stiffer the mixture is (Whiteoak, 1991).
Figure 7. MQ in the variations of Toray fly ash percentage As shown in Figure 7, variation of 0% Toray fly ash stiffer than others are, followed by 75% of Toray fly ash and 100% of Toray fly ash in the mixture. Toray Fly ash 0% Toray Fly ash 25% Toray Fly ash 50% Toray Fly ash 75% Toray Fly ash 100% OAC 6.8% OAC 7% OAC 7% OAC 7.1% OAC 7.6% VFWA (%) 75.32 75.62 75.57 75.64 76.56
68.00 69.00 70.00 71.00 72.00 73.00 74.00 75.00 76.00 77.00 78.00 VF WA (%) Toray Fly ash 0% Toray Fly ash 25% Toray Fly ash 50% Toray Fly ash 75% Toray Fly ash 100% Stability (Kg) 1649 1541 1568 1678 1718
800 900 1000 1100 1200 1300 1400 1500 1600 1700 1800 Sta bil it y ( k g ) Toray Fly ash 0% Toray Fly ash 25% Toray Fly ash 50% Toray Fly ash 75% Toray Fly ash 100% Flow (mm) 3.1 3.1 3.2 3.2 3.3
3.00 3.05 3.10 3.15 3.20 3.25 3.30 3.35 F lo w ( m m ) Toray Fly ash 0% Toray Fly ash 25% Toray Fly ash 50% Toray Fly ash 75% Toray Fly ash 100% MQ (kg/mm) 538 497 495 530 526
C.ITS and TSR Calculation
Tensile Strength Ratio (TSR) is the ratio of indirect tensile strength value of conditioned specimens (ITSII) to the indirect tensile strength value of unconditioned specimens (ITSI) based on time series (48 hours). TSR is calculated from the following equation (Robert et.al., 1991):
(7)
Indirect Tensile Strength and Tensile Strength Ratio calculations for Toray fly ash variations in HRS-WC Mixture shown are on Table 7. Optimum asphalt content.
D.Analysis on TSR values for Toray fly ash Utilization in HRS-WC Mixture.
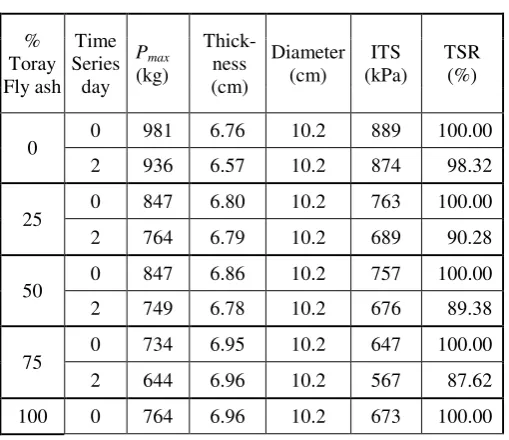
According to Asphalt Institute SP-2 (1996), minimum TSR value required is 80%. In the research TSR values shown are in Figure 8. TSR values of Toray fly ash utilization in the HRS-WC Mixture.
As shown in Figure 8. TSR values of Toray fly ash utilization in the HRS-WC Mixture, TSR values tend to decrease with the increasing of Toray fly ash and OAC in the HRS-WC Mixture. TSR values in variations of Toray fly ash are 98.32%, 90.28%, 89.38%, 87.62%, 64.71% respectively, with minimum TSR value required is 80%. Based on overall parameters, the optimum Toray fly ash utilization in the HRS-WC Mixture recommend is 75% Toray fly ash.
Table 8. ITS and TSR Calculation %
Toray Fly ash
Time Series day
Pmax (kg)
Thick-ness (cm)
Diameter (cm)
ITS (kPa)
TSR (%)
0 0 981 6.76 10.2 889 100.00 2 936 6.57 10.2 874 98.32 25 0 847 6.80 10.2 763 100.00 2 764 6.79 10.2 689 90.28 50 0 847 6.86 10.2 757 100.00 2 749 6.78 10.2 676 89.38 75 0 734 6.95 10.2 647 100.00 2 644 6.96 10.2 567 87.62 100 0 764 6.96 10.2 673 100.00
2 494 6.96 10.2 435 64.71
Figure 8. TSR values of Toray fly ash utilization in the HRS-WC Mixture
CONCLUSION AND RECOMMENDATIONS A.Conclusion
Based on the test research, parameters for determining optimum utilization of Toray fly ash as filler substitution in the Hot Rolled Sheet - Wearing Course (HRS-WC) Mixture taken into consideration are:
1. Fly ash utilization has significant environmental benefits, reduction in amount of coal combustion products that must be disposed in landfills and conservation of other natural resources and materials.
2. Toray fly ash is a Class F fly ash that fulfills the requirement from Ministry of Public Works, Institute of Road Engineering (2007) specification to utilize as filler in the Hot Rolled Sheet – Wearing Course (HRS-WC) Mixture.
3. Optimum Asphalt Content (OAC) tends to slightly increase with the increasing of Toray fly ash utilization (0%, 25%, 50%, 75%, and 100%) in the HRS-WC Mixture. OAC in the mixture are 6.8%, 7%, 7%, 7.1%, 7.6% respectively.
4. Densities in the HRS-WC compacted mixture tend to decrease with the increasing of Toray fly ash due to the differences in specific gravity value influence the average
Toray fly ash 0%
Toray fly ash 25%
Toray fly ash 50%
Toray fly ash 75%
Toray fly ash 100%
Unconditioned
Specimens 889 763 757 647 673
Conditioned
Specimens 874 689 676 567 435
0 100 200 300 400 500 600 700 800 900 1000
Ind
irec
t
T
ens
ile
Str
eng
th Va
lue
(k
P
a
) Tensile Strength Ratio (%)
% 100
I II
specific gravity of mixture variations. Specific gravity of Toray fly ash higher than stone dust and it generates higher volume in the mixture. Toray fly ash tends to create mortar with asphalt due to the higher effective asphalt content in a compacted mixture and the increasing of asphalt content will increase the inter-granular voids space between the aggregate particles which not occupied by aggregate, hence decreasing the density value.
5. VMA increases with the increasing of Toray fly ash utilization (0%, 25%, 50%, 75%, and 100%) in the HRS-WC Mixture. One of the characteristics of HRS – WC mixture that can change the VMA value and film thickness in this research is dust proportion. Lower dust contents decrease surface area, increase film thickness, and tend to raise VMA. VMA values in the mixture are 18.01%, 18.50%, 18.50%, 18.73% and 19.582% and dust proportion in variations are 1.48%, 1.44%, 1.44%, 1.41% and 1.31% respectively.
6. Voids in the Total Mix (VITM) slightly increases with the increasing of Toray fly ash utilization (0%, 25%, 50%, 75%, and 100%) in the HRS-WC Mixture. VITM values in the mixture are, 4.45%, 4.54%, 4.53%, 4.57% and 4.65% respectively.
7. VFWA increases with the increasing of asphalt content and Toray fly ash utilization (0%, 25%, 50%, 75%, and 100%) in the HRS-WC Mixture. VFWA values in the mixture are 75.32%, 75.62%, 75.57%, 75.64%, and 76.56% respectively.
8. Marshall Stability in 0% Toray fly ash (100% Stone dust filler) is 1649 kg whilst the Marshall Stability utilizing Toray fly ash (25%, 50%, 75%, and 100%) in the HRS-WC Mixture tends to increase with increasing of Toray fly ash percent due to the asphalt content in the mixture well absorbed by Toray fly ash. The highest value of stability is 1718 kg in 100% Toray fly ash utilization and the lowest stability is 1541 kg in 25% Toray fly ash. Marshall Stability of overall Toray fly ash variations meets the requirement.
9. Flow in the HRS-WC compacted mixture 0%, 25%, 50%, 75%, and 100% utilization of
Toray fly ash are 3.1 mm, 3.1 mm, 3.2 mm, 3.2 mm, and 3.3 mm respectively. Flow value increases with the increasing asphalt content, the higher the asphalt content, the greater the specimen deforms under load (Patrick G. Lavin in Asphalt Pavements, 2003).
10. Marshall Quotient (MQ) in the HRS-WC compacted mixture 0%, 25%, 50%, 75%, and 100% utilization of Toray fly ash are 538 kg/mm, 497 kg/mm, 495 kg/mm, 530 kg/mm, and 526 kg/mm respectively.
11. Indirect Tensile Strength (ITS) value in 0% Toray fly ash (100% Stone dust filler) is 889 kPa, whilst the ITS values utilizing Toray fly ash 25% is 763 kPa, 50% Toray fly ash is 757 kPa, 75% Toray fly ash 647 kPa, 100% Toray fly ash is 673 kPa.
12. Tensile Strength Ratio (TSR) value in 0% Toray fly ash (100% Stone dust filler) is 98.32%, whilst the TSR value utilizing Toray fly ash 25% is 90.28%, 50% Toray fly ash is 89.38%, 75% Toray fly ash is 87.62% and 100% Toray fly ash is 64.71%. TSR value minimal 80% is the standard requirement. B.Recommendations
1. Further research is considered necessary to study the maximum percentage of Toray fly ash in the HRS-WC Mixture.
2. There is a need for further research to study the influence of anti stripping or adhesion agent to improve the performance of Toray fly ash filler in the mixture and is tested for its susceptibility in moisture damage.
3. Ideal research methodology is required to produce asphalt mixture design which is consistently applied to the closest simulations of the field condition.
REFERENCES
Asphalt Institute (1989). The Asphalt Handbook.
Manual Series No.4 (MS -4), Maryland, USA.
Asphalt Institute (1993). Mix Design Methods of
Ministry of Public Works, Institute of Road
Engineering (2007). Asphaltic Pavement,
6th Division , Jakarta.
Lavin (2003). Asphalt Pavement, A practical