* Department of Management, Faculty of Economics, Sriwijaya University, E-mail: [email protected]
DIVERSIFICATION STRATEGY AND RISK REDUCTION
Sulastri*, Mohamad Adam*, Isnurhadi* and Fida Muthia*
Abstract: The choice of diversification strategy is an important issue in strategic management to reduce risks of business portfolio. Many research have distinct the construct of dominant business, related and unrelated business diversification strategy with its relation to the exploitation of asset synergy that gives impact to diversification performance. However, research that investigates the strategy effect on risks as the essence of diversification is still scarce. This study focuses on the diversification strategy impact on risks that are classified into: market risks, business risks and financial risks, as they are believed to have different characteristics. It is found that (a) in market risk, there is not significant difference between all diversification categories; (b) in term of business risk, significant difference only found between dominant business and unrelated business; (c) in the case of financial risk, there is a significant difference in the risk for each diversification category. This study gives implication on the importance of differentiating risk type (market, business and financial risks) on each diversification strategy (dominant, related and unrelated business) as it has different impact on the creation of value. Key words: Market Risk, Financial Risk, Business Risk, Dominant, Related dan Unrelated Diversification
1. INTRODUCTION
The choice of diversification strategy is an important issue in strategic management (Michael and Hitt, 2006; Rugman and Verbeke, 2001; Barney, 2002; Hill and Charles, 2015, and David, 2011). Diversification concept is a widely discussed concept that grouped companies into multi-business (Bruns, 2013; Peterson and Fabozzi, 2010; Campbell, Goold and Alexander, 2014), multi investment (Connor, Goldberg and Korajczyk, 2010; Hagin, 2004; Elton and Gruber, 2010), and multipreneur (Harkiolakis, 2016) in order to exploit asset synergy and competence capability resourcesas firm specificityand to reduce risks. Asset synergy exploitation and risk reduction are concept that differentiate the goal of related diversification and unrelated diversification (Fred and David, 2007; Barney, 2001).
transaction cost theory approach to solve diversification problems related to sharing intangible asset in creating value. The main essence of resource-based view is that it is important to differentiate resources, competencies and capabilities in contributing to the decision making of diversification strategy. Furthermore, Hill and Jhones (1998), use dynamic capabilities and knowledge as the resources to exploit the diversification synergy. Moreover, Barney (2002) develop a concept using resource-based approach to assess differences in the sources of leadership cost, product differentiation, vertical integration and company diversification as sustainable competitive advantage through relatedness portfolio. Markides and Williamson (1996) shows related diversification increases business performance if rare, valuable and highly imitable strategic assets can be accessed to maintain supernormal profit.
Moreover, unrelated diversification focuses more on the exploitation of financial synergy to reduce risks. As pointed out by Hitt and Hokisson (1990, as cited in Amit and Wernfelt, 1989) that companies reduce risks especially unsystematic risks through diversification to increase the wealth of shareholders. Unsystematic risks are those that arising from the specific characteristics of company that conduct unrelated business diversification as the sale decreases (Lubatkin and O’Neil, 1987). Diversification strategy gives contribution in reducing risks as the objective of financial economies of scope (Barney 2002, Sulastri 2006). It is also stated that diversification is a strategy that is developed based on the similarity of expertise, marketing and technology to differentiate the concept of relatedness and unrelatedness (Ansoff, 1965). Fred (2007) states that there are two types of strategy, namely, related and unrelated. Business unit within the company is called related if the value chain of business cross has competitively strategic fit and able to create value. However, it is called as unrelated if the value chain is very different and unrelated competitively. Meanwhile, Barney (2002, p.192) states that company that has developed its organization extensively to various businesses can be differentiated into three charateristics, namely, limited corporate (single business and dominant business), related (related constrained and related linked) and unrelated business.
A handful of researchers also explain that the motivation behind diversification in unrelated cross business is to reduce risks. For example in Markowitz’s portfolio and investment theory (Bodie and Kane, 2001), it shows that the degree of diversification at a certain level will reduce the risk, up to an additional return that will be reduced to cover the risk, which is called the optimal portfolio for the purpose of exploitation and financial synergies (Barney, 2002). Merino (1997) points out that economic potential resulted from related or unrelated diversification is different due to the distinct target between the two strategies. Similar opinion also stated by Barney (2002) that related diversification focuses more on the goal of exploiting operational synergy between business units while, unrelated diversification stresses on the exploitation of financial synergy. This indicates that there is a distinct goal of exploitation and target from related business and unrelated business diversification strategy.
Many investment literatures illustrate the risk in a single industry as putting eggs in a basket. Even though there are many successful companies in a single industrial enterprises but the advancement of technology, new product or the vast movement of consumer preference will slow down the business. For example, the way camera digital industry replaces film camera industry may be the perfect illustration for this matter. Diversification is not only has an impact in reducing business risks but also it can improve shareholders’ wealth by allowing the business to do investment in a mutual fund. Moreover, diversification has becoming an attractive and potential option in yielding synergy between division or business units in order to generate higher added value compared with a single business unit.
Based on the explanation above, it is important to explore the options of related and unrelated strategies in creating value and most importantly in investigating the contribution of diversification in risks reduction. In the context of investment in financial assets, risks are categorized into systematic risks (market risks) and specific risks while in the investment of real sector, risks are classified into business risks, financial risks and market risks. This research will focuses on how company with business portfolio diversification contributes to the risks reduction that is classified as business risks, financial risks and market risks.
2. LITERATURE REVIEW
(a) The development of diversification strategy concept
on various problems in a multi-business company that involve operational, strategic and financial management with different business simultaneously.
Diversification movement or the entrance to product-market activity as well as a new business activity is not a simple concept as the concept of diversification (Ramanujam and Varadarajan, 1989; Rumelt, 1974). Diversification concept is developing along with the development of multinational company that explains the geographic diversification concept and international diversification (Rugman, 2001, 2004, 2006), international and product diversification (Callaway, 2008).
Ansoff (1957, 1958) and Chandler (1962) are called ‘the leading historian’as they are the first to study the diversification in the early 1950s and 1960s. Wringley (1970) follows their steps that build the first framework and explain the definition of diversification as macro measurement with the goal of economies of scope. Furthermore, the construct of diversification has been developing: (1) diversification as the evolution of company growth (Ansoff, 1965); (2) diversification as a strategy, develop based on the similarity of expertise, marketing and technology to differentiate the concept of relatedness and unrelatedness (ibid.). Diversification is a strategy to expand company environment in an industry and market with regards to the competition (Grabt, 1998) and how the manager buys, creates and sells different business to adjust the skills with the opportunities (Ramanujam and Varadarajan, 1989); (3) diversification as a unit of diversified company activity based on the index of diversification.
Economically, diversification strategy can be explained from economies of scope point of view with different motives such as: (1) operational economies of scope to exploit the synergy of (a) activities and (b) core competencies; (2) Financial economies of scope to attain advantages from (a) internal capital allocation; (b) risk reduction; (c) tax advantages; (3) anticompetitive economies of scope through (a) multipoint competition and (b) exploiting market power; and (4) employee and stakeholder incentives for diversification through maximizing management compensation (Barney, 2002). Lang and Stulz (1994), Berger and Ofek (1995) and Robis and Wiserma (1995) point out that the performance of related diversification is better compared to the unrelated diversification. Keats and Hitt (1988) and Palic, Miller and Cardinal (200) show that the relationship between diversification and performance is in a form of non-linear curve, in which the higher the level of diversification, the lower the performance is. However, Hitt and Hokisson (1990) describe that the performance of related and unrelated diversification is no different after being controlled in the industrial environment.
are the limitation of managerial and resources in expanding the business. Markides (1992) states that there is an optimal boundary in a company, however the company can diversify unlimitedly before diseconomies especially managerial diseconomies of scale. Wenerfelt and Montgomery (1988) explain the company has different level of optimum on the level of diversification due to the difference in the resources. Therefore, Markides (1992) mentions that the level of optimum diversification is a function of company resources especially its external environment.
(b) Diversification and Performance
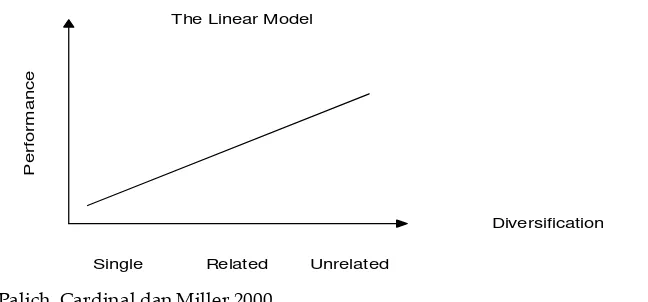
The previous studies tend to focus more on the relationship between diversification and performance for example Pandya and Rao (1998) find that there is a distinct difference in performance of highly diversified and undervesified as well as moderate diversified and undiversified. However there is no clear difference between highly diversified and moderate diversified and the average performance of highly diversification tend to be better in comparison with the undiversified firms. Researcher like Datta (1991) does not give any conclusion on the relation between diversification and performance meanwhile, Mukherjee (1998), Palich, Cardinal and Miller (2000) supports the findings by Datta et al (1991) and Holl (1995) that states litteratures on diversification has failed to create a consensus on the relation between diversification and performance. Palich, Cardinal and Miller (2000) summarise all research on the relationship betwee diversification and performance of three decades. They draw the relationship on different models: linear and curvilinier.
(1) Linear Linkage Model
(2) Curvilinear Linkage Model
Curvilinear linkage presents the increase in diversification is not associated with the increase in performance in certain continuum. Inverted-U model and intermediate model are the two alternatives in curvilinear linkage. Palich (2000) explains that the relationship between diversification strategy and performance is in form of curvilinear, which is supported by the finding of Hokisson and Hitt (1990).
Inverted-U model shows that the performance of diversification has its optimum limit. Diversification does not yield expected advantages as the level of diversification increases due to sharing resources as the costs increases. According to Hokkison and Hitt (1990), Markiedes (1993) and Palich, Cardinal and Miller (2000), as the result of company growth, top management will try to control its business portfolio by using coordination costs that may lead to diseconomies. This will causes the marginal cost to increase higher than the level of diversification.
Palich, Cardinal and Miller (2000) explains that in inverted-u model, performance becomes limited when the company limits itself on single business and focus on single industry, so there is no opportunity to exploit resources and capability between divisions. This leads to limited diversification does not yield return above the average. Along with Lubatkin and Chatterjee (1994), company with single business does not have opportunity to exploit synergy between division units or synergy advantage in comparison with if the company does moderately or highly diversification. Meanwhile related diversification will gives superior performance from the existence of economies of scope advantage (Porter, 1985; Shleifer and Visny, 1991; Nayyar, 1992; and Seth, 1990) through synergy exploitation of sharing activities and competencies transfer (Barney, 1997). However as the level of diversification increases in separated business portfolio, the coordination costs will increase as the control is losing, therefore, the marginal cost of
P
e
rf
o
rm
a
n
c
e
Single Related Unrelated
Diversification The Linear Model
Sumber : Palich, Cardinal dan Miller 2000
diversification increases. Markides (1992) mentions that the high degree of diversification will cause inefficiency as a result of conflict between businesses in internal capital market. Moreover, Palich et al. (2000) argue that the higher the level of business diversification will decreases the performance. The relationship of these variables is presented in this figure:
P
e
r
f
o
r
m
a
n
c
e
Single Related Unrelated
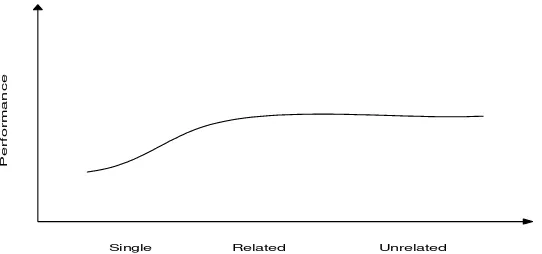
Figure 2: The relationship between diversification and performance in inverted-u model. (Source: Palich, Cardinal dan Miller, 2000)
(3) Intermediate Linkage Model
Intermediate linkage model combines the previous two models mentioned above. This model focuses on the positive association between diversification and kinerja but there is a diminishing return during optimation (Palich, Cardinal and Miller, 2000). When the company increases the level of diverisifaction that is very dictinct to the core business, marginal benefit of diversification will decreases (Markides, 1992). Montgomery and Wernfelt (1988) explains that in the beginning, company diversifies to take advantage of asset capacity. However, if the assets are overused, it can lose its competitive advantage implying that its marginal profit function decreases. The relationship between diversification and performance in Intermediate Model is represented below.
Single Related Unrelated
P
e
r
fo
r
m
a
n
ce
There many literatures that investigate on the choice of diversification on value creation, however, there are still view on the contribution of diversification strategy on risk reduction specifically. Eventhough, it is widely known that high risk will result on high return, we need to investigate whether three models on diversification performance can also explain that high return on unrelated business will imply a high risk. The relation between diversification and risk reduction on each strategy choice and risk category will be explained in the following section.
(a) Diversification and risk reduction: As it is widely believed that the purpose of diversification is to reduce financial risks (Barney, 2002), however, in business, there are other risks involved outside financial risks. Company risks can be divided into two: financial risks and business risks. Business risks are influenced by the earning volatility in an uncertain environment. Meanwhile, financial risks are those arising from the ability of the company to meet its obligation, which may result in bankruptcy (Ward, 1993). The same is stated by other researchers such as Springer (2003) and Andersen (2005) that financial risks and business risks are those bear by the company. Business risks and financial risks have reciprocal relationships for companies with high business risk, which will reduce the operational costs by reducing the use of debt. Roney (2004) concludes that in the level of corporate strategy, management portfolio approach is needed to expand the business. This approach includes the decision of (1) portfolio scope, and (2) portfolio capital that has the goal of reducing risks through hedging as the diversification strategy. Therefore, synergy exploitation and advantage of diversification strategy is to reduce risks as explained by Barney (2002) on the financial motive of economies of scope strategy.
(b) Market Risk: Market risk is another type of risks that should be considered beside business risks and financial risks. Market risks are those arising from the macroeconomic factors and the change in consumer preference. Market risks are also illustrated as systematic risks that cannot be diversified (non-diversifiable risks). It is risks arising from the movement of market price that causes return to fluctuate due to the macroeconomic factors. This implies on how the company minimalizes the risks through diversification. In the CAPM model developed by Sharpe and Litner, market risks are called systematic risks. CAPM is a model that measures market sensitivity on the portfolio return that reflects the contribution of risks on the portfolio diversification (Bodie and Kane, 2006). In the real sector, market risks can be indicated with the volatility of sales. Diversification can reduce market risks for unrelated business products, as there are substitution products when the sale decreases.
condition affecting on the ability on the return of investment. Business risks are the exposure to the uncertainty in economic value that cannot be separated from one market to another. There are many differences between business risks and market risks. Business risks are affected by many factors such as, sales volume, price, input costs, competitor, economic condition and government regulation. The addition of business risks and financial risks are called total risks. The term of business risks are illustrating more on the loss as a result of uncertainty or when the company yield earnings lower than those predicted. Business risks have a close relationship with Business Life Cycle (Rahul, Katie and David, 2012) that uses Business Risks model in Early Design (B-Red) to detect business failure potential. Business risks have implications on the difficulty of sufficient cash flow to cover operational costs such as cost of goof sold, salary and rent. There are two types of business risks: systematic risk and unsystematic risks. Business risk is different to financial risk, however it can gives impact to financial risks in meeting the liability obligation. To measure business risks, financial ratios such as contribution margin, operation leverage effect, financial leverage and total leverage can be used (Franck, 2008; Alnajjar, 2015, Cina, Isin and Husmat, 2016).
(d) Financial Risks: Financial risks are illustrated as the change in insufficient business cash flow to pay the financial liability to the creditor. Markowitz (1952) uses variance as proxy of portfolio to define risk. Financial risks are also characterized by the companies that struggle to meet their debt obligation. Therefore, financial risks indicators can be proxy by using debt to capital ratio that measures the proportion of debt on the total of capital structure in which the high proportion of debt indicating risky investment. Other proxy is capital expenditure ratio that compares cash flow from operation and capital expenditures to see how the company finance will guarantee and maintain business velocity after paying debts (Froot, Schastein and Stein, 1993; Santomero and Babbel, 1997; Alexander, 2005; Guo and Whitelaw, 2006; Noor and Abdalla, 2014).
optimum resources for efficiency goal is the main reason for diversification which induces both related and unrelated diversification; (3) Agency theory states that company does diversification to gives incentive to the agents to control them. The value of exploitation is that how the company can maximize the agent behavior inline with the shareholders interests. Company can choose between related or unrelated diversification.
As stated by Teece (1980) and Prahalad and Hamel (1990) on competency theories of corporate diversification using resources based view and transaction cost theory approach to solve diversification problems related to sharing intangible asset in creating value. The main essence of resource-based view is that it is important to differentiate resources, competencies and capabilities in contributing to the decision making of diversification strategy. Furthermore, Hill and Jhones (1998) and Hitt, Hokisson and Harrison (1999) use dynamic capabilities and knowledge as the resources to exploit the diversification synergy. Moreover, Barney (2002) develop a concept using resource-based approach to assess differences in the sources of leadership cost, product differentiation, vertical integration and company diversification as sustainable competitive advantage through relatedness portfolio. Markides and Williamson (1996) shows related diversification increases business performance if rare, valuable and highly imitable strategic assets can be accessed to maintain supernormal profit.
(c) Conceptual Framework
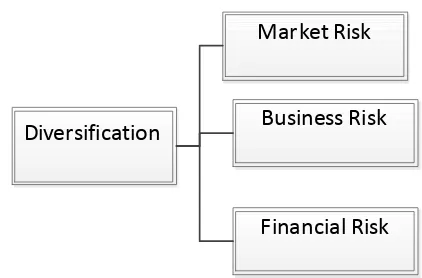
The above explanation can be reflected graphically on the relationship of diversification strategy and its contribution to market risks, business risks and financial risks. When the company is expanding the business to enter new market, industry or new product, company will be faced with many diversification choices, such as: new business that is appropriate to the core business or known as dominant business; new business that has value chain with the business as a competitive advantage or known as related business; new business that does not have relation on the value chain of business, called unrelated business. The selection of strategy will create value but also yield risks. Dominant business or single business has risks when the sale is decreasing, the same goes in related business that focuses more on complementary strategy, while in unrelated business focuses more on substitution strategy. The three strategy choices will generate risks, in form of market risks, business risks or financial risks. This research will study empirically the effect of diversification strategy choice on the three risks as presented in Figure 4 below.
3. RESEARCH METHOD
Many research use different method in defining the characteristic related and unrelated multi-business diversification. For example, Wringley (1970), Rumelt (1974) and Pandya (1998) uses diversification index while Fan and Lang (2000), Gassenheimer (1998) and Silverman (1999) uses SIC code to differentiate the relatedness. This measurement is supported by previous researchers such as Varadarajan (1986), Stimpert and Duhaime (1989) and Hitt, Hokisson and Kim (1997) that classifies diversification based on the main activity using SIC code which can also be accepted as the base to identify the diversification category in theoretical perspective and analyze company performance. SIC code category for manufacturing sector is more accurate in reflecting the operational diversification definition. However, analysis using SIC cannot be applied on the economic sector of non-industry (Gassenheimer, 1998).
Classification on multi-business company using major category are as follows (Wringley, 1970 and Rumelt, 1974): (1) Single business is company that has commitment in operating on business. Among the business that is not integrated vertically, they have vertical ratio lower than 0.7 (VR < 0.7). They also have specialization ratio 0.95 or between vertical integration with VR < 0.7 that final product has 95% of contribution from the total earnings; (2) Dominant business is the company that does diversification extensively but the earnings are still dominated by its main business. Companies that are not integrated vertically (VR < 0.7) and the specialization ratio is bigger or equals to 0.7 but less than 0.95, they are grouped under dominant business; (3) Related business is the company diversification that is not integrated vertically. It has specialization ratio less than 0.7 and if the diversification is combining new and old activities, the related ratio is 0.7 or higher; (4) Unrelated business is when the company is not integrated vertically and has diversification without any connection between new and old business and the related ratio is less than 0.7.
Figure 4: The impact of strategy choice on risks
Market Risk
Business Risk
Inconsistent with Wrigley that uses earning contribution in defining the level of diversification, this research will use investment ratio in each business unit on the total business to classify the business into dominant business, related business or unrelated business. The main reason for using this method is the proxy used in measuring investment ability in generating return. Moreover, it can also be seen whether the new business as the indicator of business expansion is included in existing business development, related new business or unrelated new business. By using investment value is more relevant as it associated with return and investment risks.
From 505 companies listed in Indonesia Stock Exchange using panel data from 2005 to 2015, it is shown that multibusiness companies have expand their businesses through new investments. The classification is as follows:
(1) Single business is company that has commitment in operating on business. Among the business that is not integrated vertically, they have vertical ratio lower than 0.7 (VR < 0.7). They also have specialization ratio 0.95 or between vertical integration with VR < 0.7 that final product has 95% of contribution from the total earnings;
(2) Dominant business is the company that does diversification extensively but the earnings are still dominated by its main business. Companies that are not integrated vertically (VR < 0.7) and the specialization ratio is bigger or equals to 0.7 but less than 0.95, they are grouped under dominant business; (3) Related business is the company diversification that is not integrated vertically. It has specialization ratio less than 0.7 and if the diversification is combining new and old activities, the related ratio is 0.7 or higher;
(3) Unrelated business is when the company is not integrated vertically and has diversification without any connection between new and old business and the related ratio is less than 0.7.
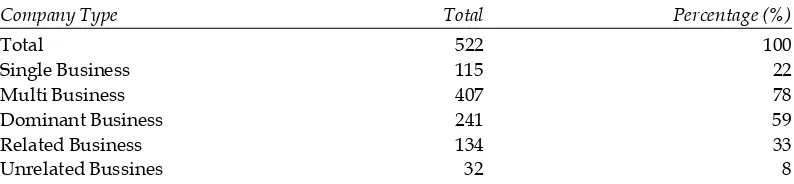
Based on 522 samples of go-public companies in Indonesia, the profile of multi-business is shown in the table below.
Table 1
Business Portfolio of Public Companies in Indonesia
Company Type Total Percentage (%)
Total 522 100
Single Business 115 22
Multi Business 407 78
Dominant Business 241 59
Related Business 134 33
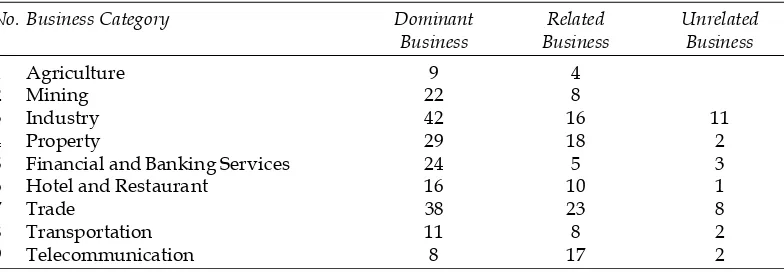
Furthermore, from 407 sample of multi-business companies, 338 companies are selected as sample as they do not have missing values from any sector categories that are classified based on the business strategy type (dominant business, rlated business and unrelated business). Table 2 shows that company that has multi-business are those from agriculture, mining, industry, real estate and construction, financial and banking, hotel and restaurant, trade, transportation, and telecommunication sector. If they are grouped based on the diversification category, it can be seen that in agriculture and mining sector, most companies are dominant business and related business. However, sector with the most companies that do unrelated business are industry and trade and other sectors choose to do dominant business and related business.
Table 2
Diversification Strategy Choioces Based on Business Sector
No. Business Category Dominant Related Unrelated
Business Business Business
1 Agriculture 9 4
2 Mining 22 8
3 Industry 42 16 11
4 Property 29 18 2
5 Financial and Banking Services 24 5 3
6 Hotel and Restaurant 16 10 1
7 Trade 38 23 8
8 Transportation 11 8 2
9 Telecommunication 8 17 2
To test the model, multivariate analysis of variance is done. In this test, independent variable (DIVERSIFIKASI) is a categorical variable that influences more than one numeric dependent variables through the following equation:
Bussiness Risk + Financial Risk + Market Risk = � + � Div + e
The equation above shows the model that can be solved using multicariate analysis of variance that will answer how the diversification strategy can explain the level of risks that are classified into: business risk, market risk and financial risk.
Operational Definition and Variable Measurement
5
Business risk refers to risks that are arising from the inability of the company to generate return. This may be caused by the managerial aspect and company operation that leads to inefficiency resulting in investment risks of not attaining the expected return. This risk is measured by averaging the standard deviation of net operating after tax (NOPAT) to the invested capital growth for five years (2010-2015).
Business Risk Average Growth = �
5
Financial risks are those arising from the difficulty of the company to meet its obligation. The implication of this risk is that the increase in interest expense. Financial risks also refer to the ability of net profit to cover the interest expense. Therefore, it can be measured using earning before tax ratio compared to the earnings before interest and tax. Moreover, the risk is measured by averaging the standard deviation from the growth of EBT/EBIT ratio for five years.
Financial Risk = Y�3, ,i n
3,i EBT
Y
EBIT
Financial Risk Average Growth = �
5
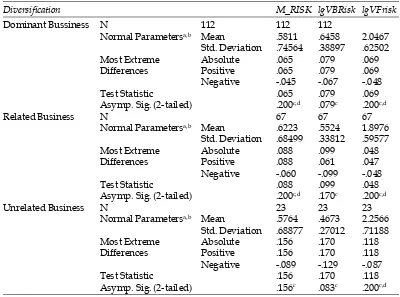
(a) Normality test using Kolmogorov Smirnov test is conducted in each variable of market risk, financial risk and business risk in each diversification category. This means that all the data in the three category are following normally distributed data pattern, which can represent its population in each diversification group. The results are shown in the Appendix (Table 1).
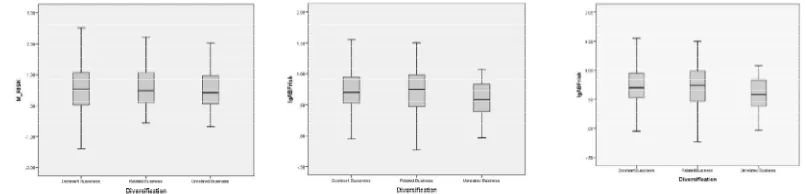
(b) Outlier test using box plot method shown that each diversification category for three variables are free from outliers as presented in the Figure 4 below.
Figure 4: Outlier Test Using Box-Plot Method Based on Diversification Strategy
(c) Box’s M test is used to see whether the observed data has covariance matrix to the three dependent variables (market risk, financial risk and business risk). It is found that the covariance matrix is the same in the diversification category with significance level of �> 0.05, in which the result of Box’s M showing � of 0.284.
(d) Levene’s test for equality of error variances tries to see if the sample has equal variances. In this case, this study would like to test whether the variance of three dependent variables (market risk, financial risk and business risk) on the diversification category (dominant business, related business and unrelated business) is the same. The result shows that the critical value ��> 0.05 (See: Appendix, Table 2).
(e) Multivariate test for diversification category using Wilk’s Lambda, Hottling Trace (0.053) and Roy’s Largest Root (0.007) shows significance level of � < 0,05 indicating that the three diversification groups can be explained using manova multivariate model (See: Appendix, Table 3). From the five assumptions of manova multivariate, the sample data have fulfilled the appropriate statistic test methods that can be explained its population as multi-business companies and the analysis can be processed.
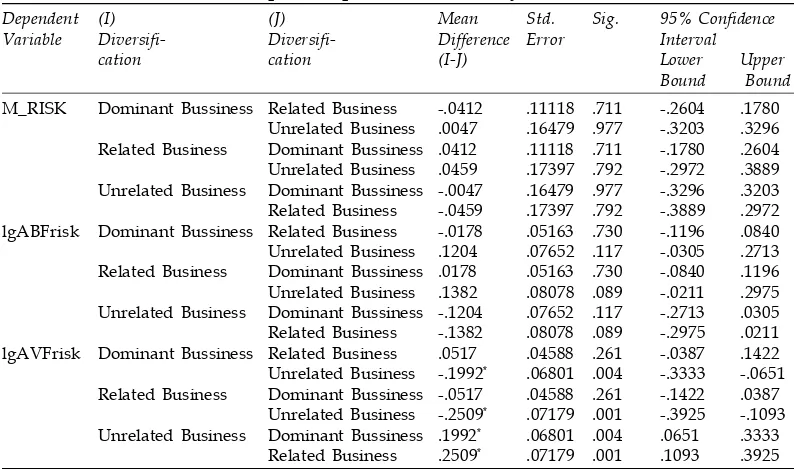
occur, with the significance level of á = 0.003. Meanwhile, in market and business risk, the differences only occur between dominant business and unrelated business as well as related business and unrelated business. Details of this result can be seen in the multiple comparison tests using LSD Tukey’s (See: Appendix, Table 4 and 5)
Therefore, it can be concluded that:
a) In market risk, there is not significant difference between the three diversification categories
b) In term of business risk, significant difference only found between dominant business and unrelated business.
c) In the case of financial risk, there is a significant difference in the risk for each diversification category.
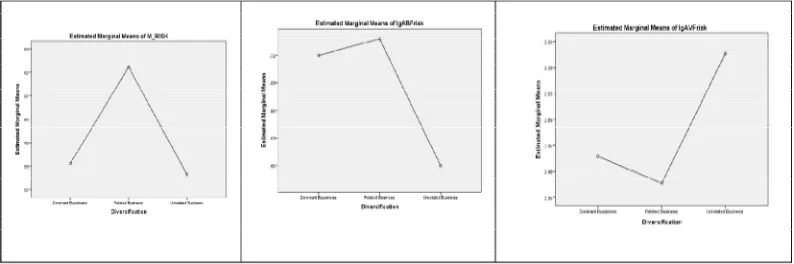
d) The relationship pattern between the variable in each diversification category can be seen in the Figure 5 below:
Figure 5: Relationship Pattern Between Risks (Market Risks, Business Risks and Financial Risks) and Diversification Strategy
5. CONCLUSIONS AND IMPLICATIONS
Diversification strategy of unrelated business can reduce market risk and business risks but increase financial risks. However, the diversification strategy of dominant and related business has higher market and business risks but reduces financial risks. These findings are inline with the theory and concept that shows market risks and business risks are the main problems in dominant and related business. It is categorized as risky for related business because the company develops product or business unit that is supplementary to the other products. Meanwhile, in terms of dominant business, it is illustrated as if the company placing eggs in one basket that is has higher risks if the industry is declining.
Practically, this study implies that company with single business or dominant business has higher risks since they do not have alternatives if there is a systematic fluctuation in macroeconomic factors and market trend of consumer preferences in business competition. Furthermore, companies that develop related business especially in complementary and integrated businesses tend to have higher risk if the industry trend is declining as the results of market risk and business risks, which will lead to business risks as a whole. On another hand, unrelated business can reduce market risks and business risks as it has substitution nature. However, this does not happen in financial risks. This occurs if in the development of business unit using diversification with the aim of exploiting the debt, the fund is allocated to other business unit to create value of business portfolio as a whole.
Theoretically, this study gives implication on the importance of the development of risk concept in any business strategy describing that not all investment in business portfolio is used to reduce risks. Many research including our study have showed that diversification, conceptually, focuses more on unrelated business to reduce risks: not only to reduce market and business risks but also financial risks. This study also implies on the concept of prudence in developing business strategy in multi-business company related to the risks for company with dominant business, related business or unrelated business. For further research it is suggested that, dynamic estimation model could be developed to measure the degree of risks change for each diversification strategy selection.
References
A, M. Rugman & T. L. Brewer (Eds), The Oxford Handbook of International Business (pp. 150– 180). Oxford: Oxford University Press.
Ansoff H.Igor, (1965), Corporate Strategy, New York, McGraw Hill.
Barney , Jay, (2002), Gaining and Sustaining Competitive Advantage, Second Edition, Prentice Hall.
Bruns, A. and Stieglitz, S. (2013 ), “ Towards more systematic Twitter analysis: metrics for tweeting activities “,International Journal of Social Research Methodology , Vol. 16 No. 2, pp. 91 - 108.
Bodie, Zvi, Kane, Alex, Marcus, Alan J. (2009), “Investments”, Eighth Edition, New York: McGraw-Hill Companies, Inc
Chandler, A.D. jr (1992), “ Organizational Capability and the economics history of the Industrial Enterprise”, Journal of Economics Perspective, 6, vol 3, pp. 79-100.
Collins, Jamie y Michael, HITT, (2006), “Leveraging Tacit Knowledge in Alliances: The Importance of Using Relational Capabilities to Build and Leverage Relational Capital”, Journal of Engineering and Technology Management Jet-M, vol. 23, pp. 147-167.
C. W. Roney, (2004), Strategic Management Strategic Management Methodology: Generally Accepted Principles for PractitionersGuidelines for Strategists ; No. 1.
David Fred R. (2011), Strategic Management, 21st Edition, Translators: Ali Parsaeian and SM Erabi, Tehran: Office of Cultural Research.
Datta, D. Organization fit and acquisition performance: Effects of post acquisition integration. Strategic Management Journal, 1991, 12(4), 281-98. Datta, D. & Puia, J.F Cross-border acquisitions: An examination of the influence
Elton, Edwin J., Gruber, Martin J. (1995-2011), Modem Portfolio Theory and Investment Analysis. New York: John Wiley & Sons, Inc.
Fan, Joseph P. H & Lang , Larry H., (2000), The measurement of Relatedness : An Aplication to Corporate Diversification, Journal of Business, Vol 7 No 4 Pp 629-660.
Gassenheimer, Jule B and.Keep, William W., (1998), Generalizing diversification theory across economic sectors; theoritical and empirical considerations, Journal of Marketing Theory and Practice.
Hitt, Hokisson, and Kim., (1997), International Diversification : Effect Innovation and Firm Performance in Product- Diversified Firms, Academy Management Journal Vol. 40, No. 4 PP. 767-798.
Hill, Charles W.L. and Jones, Gareth R. (1998), Strategic Management Theory : Integrated Approach. Fourth Edition. Oughton Mifflin Company Boston New York.
Hill, L.W., Charles., Jones, R., Gareth. (2001), “Strategic Management: An Integrated Approach”, Edition, 5, annotated. Publisher, Houghton Mifflin.
Hitt; Hokisson; Harrison, (1999), Human Capital and Strategic Competitiveness in the 1990s, Journal of Management Development, Vol 13, No 1.
Hitt, Michael A and R. Duane, Ireland and Hoskisson, Robert E, 2001 Strategic Management Compeetitiveness and Globalization, South-Western College Publishing.
Hokisson, Hitt, (1990), Antecedents and Performance Outcomes of Diversification : A Review and Critique of Theoritical Perpectives, Journal of Management, Vol 16 No 2 , 461-509. Lang, H.P. and R Stulz, (1994), Tobin’s q corporate diversification and firm performance, Journal
of Political Economy.
Lustig, N., Pessino, C. and Scott, J. (2013), ‘The impact of taxes and social spending on inequality and poverty in Argentina, Bolivia, Brazil, Mexico, Peru and Uruguay’. Economics Working Paper. New Orleans, LA: Tulane University.
Keats and Hitt, (1988), A Causal Model of Linkages Among Environmental Dimensioan Macro Organizational Characteristic and Performance, Academy Management Journal Vol. 31, No. 3, pp. 570-598.
Markides & Williamson., (1996), Corporate Diversification and Organizational Structure : A Resources- Based View, Academy of Management Journal, Vol. 39, No. 2 pp. 340-467. Markides, C, (1992), Consequences Of Corporate Refocusing ; Ex Ante Evidence,Academy Of
Mangement Journal, Vol 35, No 2 , pp. 398-412.
Merino and Rodriguez, (1997), A Consistent Analysis Of Diversification with non observable firm effects,Strategic Management Journal Vol 18:9, pp. 733-743.
Palich, Cardinal and Miller, (2000), Curvelinearity In The Diversification Performance Linkage : An Examination of Over Three Decades of Research, Strategic Management Journal. Pandya, Anil M. and Rao, Narendar V., (1998), Diversification And Firm Performance: An
Empirical Evaluation, Journal of Financial and Strategic Decisions, Vol. 11, No. 2.
Peterson, P. P., Fabozzi, F. J. (2002), Capital Budgeting: Theory and Practice, John Wiley & Sons, NY, USA.
Prahalad, C.K., & Hamel, G (1990), “The core competences of the corporation”. Harvard Business Review, 68(3), pp. 79-91.
Ramanujam, V. and P. Varadarajan, (1989), Research on corporate diversification : A synthesis, Strategic Management Journal , Vol 10, pp. 523-551.
Rugman, A. M., & Verbeke, A. (2001), Location, competitiveness and the multinational enterprise.
Rugman, A. M., & Verbeke, A. (2004), A perspective on regional and global strategies of multinational enterprises. Journal of International Business Studies, 35(1), 3–18.
Rumelt, Richard P, (1974), Strategy, Structure, and Economic Performance, Harvard Business Scholl Classic.
Silverman, Brian S. (1999), Technological Resources and Direction of corporate Diversification : Toward an integration of resources-based view and transaction cost economics, Management Science, Vol. 45 No 8.
Springer, U. (2003), Can the risks of the kyoto mechanisms be reduced through portfolio diversification? evidence from the swedish AIJ program.Environmental and Resource Economics, 25(4), 501-513.
mpert J.L.; Duhaime, Irene M, (1997), In the Eyes of the Beholder : Conceptualizations of Relatedness Held by the Managers of large Diversified Firms, Strategic Management Journal, Vol 18:2, pp. 111-125.
Teece, D.J. (1980), Economics of scope and the scope of the enterprice. Journal of economic Behavior and Organization, vol 1, pp. 293-312.
Varadarajan, P.R. and Ramanujam, (1986), Product diversity and firm performance : An empirical investigation, Journal of Marketing, 50, pp. 43-57.
Wrigley, Leonard, (1970), Divisional Autonomy and Diversification, Unpublished doctoral dissertation, Harvard Business School, 1970.
APPENDIX: RESULTS OF MODEL TESTS Table 1
Normality Test using One-Sample Kolmogorov-Smirnov Test
Diversification M_RISK lgVBRisk lgVFrisk
Dominant Bussiness N 112 112 112
Normal Parametersa,b Mean .5811 .6458 2.0467
Std. Deviation .74564 .38897 .62502 Most Extreme Absolute .065 .079 .069 Differences Positive .065 .079 .069 Negative -.045 -.067 -.048
Test Statistic .065 .079 .069
Asymp. Sig. (2-tailed) .200c,d .079c .200c,d
Related Business N 67 67 67
Normal Parametersa,b Mean .6223 .5524 1.8976
Std. Deviation .68499 .33812 .59577 Most Extreme Absolute .088 .099 .048 Differences Positive .088 .061 .047 Negative -.060 -.099 -.048
Test Statistic .088 .099 .048
Asymp. Sig. (2-tailed) .200c,d .170c .200c,d
Unrelated Business N 23 23 23
Normal Parametersa,b Mean .5764 .4673 2.2566
Std. Deviation .68877 .27012 .71188 Most Extreme Absolute .156 .170 .118 Differences Positive .156 .170 .118 Negative -.089 -.129 -.087
Test Statistic .156 .170 .118
Table 2
Levene’s Test of Equality of Error Variances Box’s Test of Equality of Levene’s Test of Equality of Error Variancesa Covariance Matrices
Box’s M 14.800 F df1 df2 Sig.
F 1.189 M_RISK .413 2 199 .662
df1 12 lgABFrisk 1.359 2 199 .259
df2 19031.397 lgAVFrisk 2.503 2 199 .084
Sig. .284
Table 3 Multivariate Tests
Effect Value F Hypothesis df Error df Sig. Intercept Pillai’s Trace .986 4514.249b 3.000 197.000 .000
Wilks’ Lambda .014 4514.249b 3.000 197.000 .000
Hotelling’s Trace 68.745 4514.249b 3.000 197.000 .000
Roy’s Largest Root 68.745 4514.249b 3.000 197.000 .000
Diversifica- Pillai’s Trace .060 2.055 6.000 396.000 .058 tion Wilks’ Lambda .940 2.076b 6.000 394.000 .055
Hotelling’s Trace .064 2.096 6.000 392.000 .053 Roy’s Largest Root .063 4.187c 3.000 198.000 .007
Table 4
Multiple Comparisons LSD Tukey’s Test
Dependent (I) (J) Mean Std. Sig. 95% Confidence
Variable Diversifi- Diversifi- Difference Error Interval
cation cation (I-J) Lower Upper
Bound Bound
M_RISK Dominant Bussiness Related Business -.0412 .11118 .711 -.2604 .1780
Unrelated Business .0047 .16479 .977 -.3203 .3296
Related Business Dominant Bussiness .0412 .11118 .711 -.1780 .2604
Unrelated Business .0459 .17397 .792 -.2972 .3889
Unrelated Business Dominant Bussiness -.0047 .16479 .977 -.3296 .3203
Related Business -.0459 .17397 .792 -.3889 .2972
lgABFrisk Dominant Bussiness Related Business -.0178 .05163 .730 -.1196 .0840
Unrelated Business .1204 .07652 .117 -.0305 .2713
Related Business Dominant Bussiness .0178 .05163 .730 -.0840 .1196
Unrelated Business .1382 .08078 .089 -.0211 .2975
Unrelated Business Dominant Bussiness -.1204 .07652 .117 -.2713 .0305
Related Business -.1382 .08078 .089 -.2975 .0211
lgAVFrisk Dominant Bussiness Related Business .0517 .04588 .261 -.0387 .1422
Unrelated Business -.1992* .06801 .004 -.3333 -.0651
Related Business Dominant Bussiness -.0517 .04588 .261 -.1422 .0387
Unrelated Business -.2509* .07179 .001 -.3925 -.1093
Unrelated Business Dominant Bussiness .1992* .06801 .004 .0651 .3333
Related Business .2509* .07179 .001 .1093 .3925
Based on observed means.
Table 5
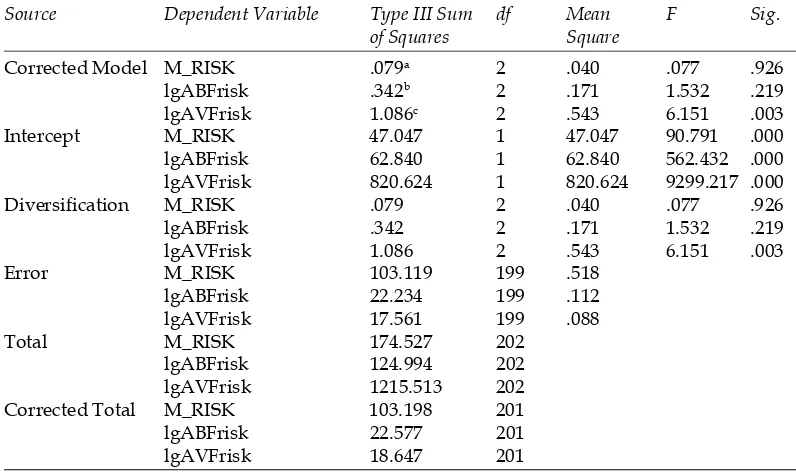
Tests of Between-Subjects Effects
Source Dependent Variable Type III Sum df Mean F Sig. of Squares Square
Corrected Model M_RISK .079a 2 .040 .077 .926
lgABFrisk .342b 2 .171 1.532 .219
lgAVFrisk 1.086c 2 .543 6.151 .003
Intercept M_RISK 47.047 1 47.047 90.791 .000
lgABFrisk 62.840 1 62.840 562.432 .000 lgAVFrisk 820.624 1 820.624 9299.217 .000
Diversification M_RISK .079 2 .040 .077 .926
lgABFrisk .342 2 .171 1.532 .219
lgAVFrisk 1.086 2 .543 6.151 .003
Error M_RISK 103.119 199 .518
lgABFrisk 22.234 199 .112
lgAVFrisk 17.561 199 .088
Total M_RISK 174.527 202
lgABFrisk 124.994 202
lgAVFrisk 1215.513 202 Corrected Total M_RISK 103.198 201
lgABFrisk 22.577 201
lgAVFrisk 18.647 201