
TEKNIKAL SAHAM HARIAN ANALISA & REKOMENDASI
Teks penuh
Gambar
Dokumen terkait
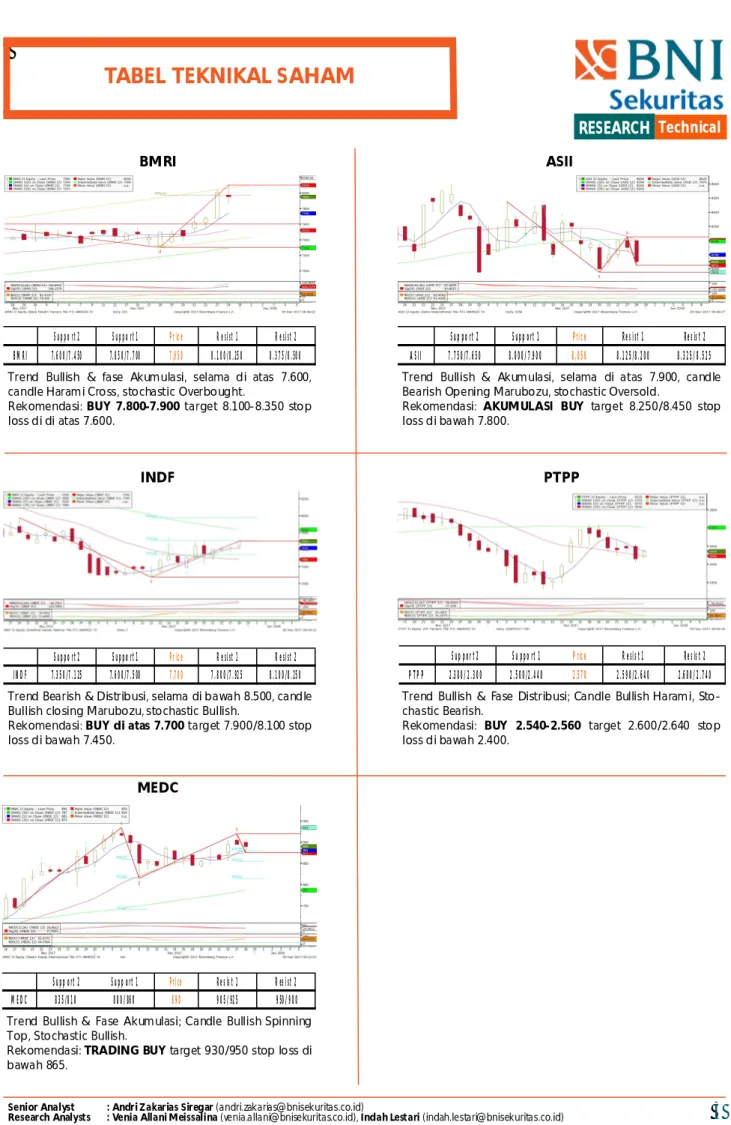
Trend Bullish & Fase Akumulasi; Candle Legged Doji, Stochastic Bullish. Trend Bullish & Fase Distribusi; Candle Bullish Belt Hold, Stochastic Overbought.. 3997
Trend Bullish & Fase Akumulasi; Candle Bullish Morning Star, Stochastic Bearish. Trend Bearish & Fase Akumulasi; Candle Long Bullish Open- ing Marubozu, Stochastic
Trend Bullish & Fase Akumulasi; Candle Bullish Hammer, Stochastic Bullish. Trend Bearish & Fase Distribusi; Candle Doji, Stochastic Bearish.. 3997
Trend Bullish & Fase Akumulasi; Candle Long Bullish Marubozu, Stochastic Overbought. Trend Bullish & Fase Akumulasi; Candle Bearish Shooting Star,
Trend Bullish & Fase Akumulasi; Candle Long Legged Doji, Stochastic Bearish. Trend Bullish & Fase Akumulasi; candle Bullish Hammer, Stochastic Bullish.. 3997
Trend Bullish & Fase Distribusi; Candle Bullish Harami, Stochastic Netral. Trend Bullish & Fase Akumulasi; Candle Bullish Hammer, Stochastic Overbought.. 3997
Trend Bullish & Fase Distribusi; Candle Hammer, Sto- chastic Oversold. Trend Bullish & Fase Akumulasi; Bullish Three Inside Up, Stochastic Bullish.. 3997
Trend Bullish & Fase Distribusi; Candle Bullish Morning Doji Star, Stochastic Overbought. Trend Bullish & Fase Akumulasi; Bullish Engulfing, Stochastic Bullish.. 3997
