ESTIMATION OF VEGETATION HEIGHT THROUGH SATELLITE IMAGE TEXTURE
ANALYSIS
Z. I. Petroua,b,*, C. Tarantinoc, M. Adamoc, P. Blondac, M. Petroub
a
Department of Electrical and Electronic Engineering, Imperial College London, South Kensington Campus, London SW7 2AZ, United Kingdom - [email protected]
bInformation Technologies Institute, P.O.Box 60361, 6th km Harilaou - Thermi, 57001, Thessaloniki, Greece - (zpetrou, petrou)@iti.gr c
Institute for Studies on Intelligent System for Automation (ISSIA), National Research Council (CNR), Via Amendola 122/D-O 70126, Bari, Italy. - (tarantino, adamo, blonda)@ba.issa.cnr.it
KEY WORDS:Texture analysis, land cover, vegetation classification, Quickbird, mapping
ABSTRACT:
Vegetation height plays a crucial role in various ecological and environmental applications, such as biodiversity assessment and monitoring, landscape characterization, conservation planning and disaster management. Its estimation is traditionally based on in situ measurements or airborne Light Detection And Ranging (LiDAR) sensors. However, such methods are often proven insufficient in covering large area landscapes due to high demands in cost, labor and time. Considering a multispectral image from a passive satellite sensor as the only available source of information, we propose and evaluate new ways of discriminating vegetated habitat species according to their height, through calculation of texture analysis measures, based on local variance, entropy and local binary patterns. The methodology is applied in a Quickbird image of Le Cesine protected site, Italy. The proposed methods are proven particularly effective in discriminating low and mid phanerophytes from tall phanerophytes, having a height of less and more than 2 meters, respectively. The results indicate a promising alternative in vegetation height estimation when in situ or LiDAR data are not available or affordable, thus facilitating and reducing the cost of ecological monitoring and environmental sustainability planning tasks.
1 INTRODUCTION
Estimation of canopy structure and vegetation height is funda-mental for a series of ecological studies, including biodiversity monitoring, conservation planning, fire modeling and biomass es-timation (Hyde et al., 2006, Dong and Wu, 2008). In addition, in various landscape mapping applications, certain land cover and habitat categories are discriminated based on their height, thus its measurement is of fundamental importance. Characteristic ex-amples of such categories are included in the Land Cover Clas-sification System (LCCS), proposed by the Food and Agricul-ture Organization of the United Nations (Di Gregorio and Jansen, 1998), and the General Habitat Categories (Bunce et al., 2008), for land cover and habitat mapping, respectively, both adopted by the BIO SOS (BIOdiversity Multi-Source Monitoring System: from Space To Species) European project, concerned with biodi-versity monitoring.
Numerous studies have been proposed in the literature on vegeta-tion height measurement through field campaigns with hand-held devices (Payero et al., 2004, Weltz et al., 1994, Buckley et al., 1999), considered as the most accurate approach. In cases where in situ measurements were not available or possible, LiDAR data, mainly from airborne sensors, have been recorded as the most ef-ficient alternative (Nilsson, 1996, Kwak et al., 2007, Dubayah et al., 2010, Lefsky et al., 2005). Airborne Synthetic Aperture Radar (SAR) data have also been used to a lesser extent (Praks et al., 2009). However, such methods provide coverage to a re-stricted spatial extent and can be particularly expensive and time and labor demanding.
Satellite data, on the other hand, mainly from passive sensors, providing a large area coverage often at a reasonable cost, seem to constitute a rational potential alternative. Different studies have been conducted recently, trying to investigate potential correla-tion of the spectral characteristics of areas captured in satellite
∗Corresponding author. E-mail: [email protected].
images with their vegetation height, usually in a synergy with airborne LiDAR data. Stojanovaet al.(2010) calculated statistic measures in the segments of Landsat imagery and, together with LiDAR, tried to extract vegetation height in a Slovenian forested area. Various vegetation indices were calculated from Landsat data by Dong and Wu (2008) and, in combination with LiDAR satellite data, were used to estimate vegetation height in a moun-tainous protected region in China. Similar vegetation indices from Landsat were used by Yanhonget al. (2010) to approxi-mate height in a Chinese inland river basin. Hydeet al. (2006) used airborne LiDAR and SAR and satellite Landsat and Quick-bird data and compared their potential in height estimation in a forested site in USA. LiDAR clearly outperformed all other sin-gle sensors in height estimation accuracy; when data from other sensors, especially Landsat, were combined with LiDAR, the re-sults were further improved. Data from the Moderate Resolution Imaging Spectroradiometer (MODIS) sensor have also been used recently for large area vegetation height estimation in forests of USA and Costa Rica (Wang et al., 2011).
In all the aforementioned studies, where data from passive sen-sors were used, only reflectance-based characteristics were em-ployed. In this paper, we introduce the use of textural charac-teristics in vegetation height estimation through passive satellite sensors. Textural characteristics are expected to reveal spatial structural properties of the studied areas. The main idea behind this approach is the fact that in areas with short and shrubby vege-tation the texture of the image appears more homogeneous than in areas with high vegetation, where vegetation canopy, tree trunks and bare ground alternate, making the texture variant and inho-mogeneous. Different texture measures are proposed and evalu-ated as far as their efficiency in discriminating habitat types based on their vegetation height, is regarded. In particular, the discrimi-nation of low and mid from tall phanerophyte habitats, according to the GHC scheme, is regarded.
considered absent in our study. Thus, another aim of the paper is to extract surrogate measures of vegetation height extraction through Remote Sensing, in case primary data are not available or affordable. For the extraction of the texture measures, a mul-tispectral Quickbird image of the Italian Natura 2000 protected site of Le Cesine is used.
2 MATERIALS 2.1 Study area
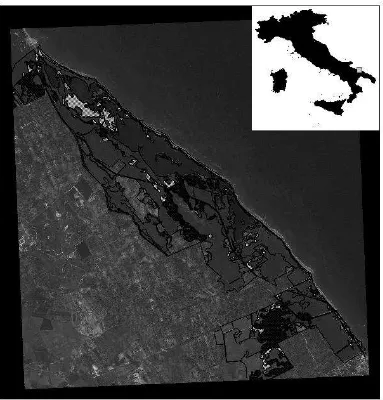
The methods discussed in the paper are tested at the Le Cesine site. Le Cesine is a Natura 2000 protected site located on the Adriatic site of the south eastern part of Apulia region, Italy (Fig-ure 1). It covers around 3.48km2
and is one of the oldest pro-tected areas in Apulia. The area comprises a complex of coastal lagoons, as well as various canals, marshes and humid grasslands. Helophytic, halophilous and dry therophytic vegetation alternate and create interesting mosaics. Cladium mariscuscommunities are the most common helophytic vegetation species. The woody vegetation is mainly characterized byPinus halepensisand Quer-cus ilex, while the scrubby vegetation byErica forskalii.
2.2 Data
The only available data source for height estimation in our study is a very high resolution multispectral image from the Quickbird sensor, acquired in mid July 2005. The image is of 2.4m spatial resolution and contains four bands, lying in the spectral areas of blue (450–520nm), green (520–600nm), red (630–690nm) and near-infrared (760–900nm).
For validation purposes, a habitat map of Le Cesine, expressed in the GHC scheme, from the same period is used. GHC, a tree-structure classification system proposed to include all European habitats, is based on life forms. It consists of five main classes, each of which is further split into several subclasses, resulting in a total of 160 habitat categories (Bunce et al., 2008). For certain main classes, e.g. Trees and Shrubs, vegetation height is not only fundamental for the recognition of the habitat class of landscape patches from remote sensors, but, often, the only way, since the spectral reflectance properties of the patches may not be particularly distinctive. An indicative example includes the discrimination between the low and mid phanerophyte class (LPH/MPH), being shorter than 2m, and the tall phanerophytes (TPH), with above 2m height. The discrimination between these (semi-)natural habitats is important, since they have distinct char-acteristics causing or revealing different ecological properties and functions.
Figure 1 presents the location of Le Cesine in Italy and the avail-able Quickbird image, where the green band is drawn in gray-scale. The boundaries of the protected area overlay the Quick-bird image. The areas of LPH/MPH habitats, as extracted from the habitat map, are indicated as white dotted patches, the TPH habitats as dark dotted patches, while all the rest habitats remain transparent and let the image intensity appear underneath.
3 METHODS
In our study, Quickbird image alone is used to characterize habi-tats based on their height and discriminate between LPH/MPH and TPH categories. Vegetation height is approximated indirectly by quantifying the homogeneity of the ground through the pro-posed texture analysis measures. The high spatial resolution of
the image allows the extraction of such measures able to cap-ture local variations in the ground struccap-ture and provide an ac-curate indication of the homogeneity of the ground. The patches of interest characterized as LPH/MPH and TPH are detected in the Quickbird image, based on the GHC habitat map. For these patches, the proposed texture measures are calculated on a per pixel basis. For each measure, its average value in the pixels of the patch is extracted. For the tall phanerophyte patches these values are expected to be significantly larger than those for the low/mid phanerophyte patches, reflecting their larger heterogene-ity. The texture measures are calculated for all bands of the Quickbird image, in order to examine the discriminatory capa-bility of each band. Local variance, as a measure of energy, local entropy and local binary patterns are employed in the calculated measures.
3.1 Local Variance
The first measure we apply to capture local variations in texture is based on local variance. Around each pixel of the selected LPH/MPH or TPH patch, a small neighborhood is considered. The neighborhood is defined as a square window of predefined size around the central pixel. The variance of the pixel intensi-ties in the neighborhood is calculated and assigned to the central pixel. Since the discrimination of habitats is meaningful on a per patch basis, the average value of the variance values of the pixels of the patch is extracted, providing an indication of the intra-patch heterogeneity and, indirectly, a surrogate of the patch vegetation height. The same procedure is applied for all Quickbird bands.
3.2 Local Entropy
In order to detect local variations in texture, entropy-based mea-sures can be employed. Entropy, as introduced in information theory by Shannon (1949), offers, in general terms, an indication of randomness in the studied data; in that sense, heterogeneous patches as far as their pixel brightness is regarded, as the ones depicting tall vegetation habitats, are expected to have higher en-tropy values than patches with low vegetation. Similarly to vari-ance, a local measure of entropy is calculated on a per pixel basis. For each pixelcof a selected patch, entropy is calculated in a sur-rounding window, using
wherekis the total number of different pixel intensities, or gray values, present in the window andp(i)the frequency of appear-ance of valueiin the window, i.e. the ratio of the number of pix-els with valueiin the window to the total number of pixels of the window. An interesting trade-off takes place: on the one hand, the window needs to be rather small in order to increase spatial resolution and capture local variations in the texture. On the other hand, in order to have reliable and meaningful statistical analysis, the number of gray levels has to decrease, through further quan-tization of the pixel values, as the window size decreases. As an example, for a window of dimensions9×9pixels, the image should be requantized to at most 8 gray levels, so that we have 81 pixels to populate the 8 gray level bins when forming the his-togram of the window under consideration. Two schemes were tested, one with the entire region of interest being requantized to 8 gray levels, and one with each window being requantized indi-vidually.
3.3 Local Entropy Ratio
Figure 1: LPH/MPH and TPH habitats in Le Cesine protected site.
extent of a larger surrounding area, we introduce the Local En-tropy Ratio (LER) measure. Two concentric windows of different sizes are considered around each pixel. A local entropy value is extracted for each window,Hiand Ho for the inner and outer windows, respectively, and their ratio
LER= Hi
Ho
(2)
is assigned to the central pixel. The smaller the ratio, the more homogeneous the close neighborhood of the central pixel, com-pared with its broader surroundings. Two versions of the measure are produced: in the first case, the pixels of the small window are included in the calculation of the entropy of the large one, while in the second a more unbiased approach is offered by excluding the pixels of the inner window from the entropy calculation of the outer one. A point of particular importance in the latter case is that the outer window should be large enough to allow for sensi-ble statistical analysis. Therefore, since a statistically meaningful number of pixels has to be at least one order of magnitude larger than the number of gray levels, in case of image quantization in eight gray levels and a small window size of9×9pixels, a large
window of a minimum dimension of13×13pixels needs to be
created around the central pixel, thus having169−81 = 88pixels
after the exclusion of the central window. As previously, quanti-zation can be performed for either the whole region or separately for each window.
3.4 Local Binary Patterns
Local binary patterns (Petrou and Garc´ıa-Sevilla, 2006) are also tested in capturing local changes in texture. As all previous mea-sures, local binary patterns are computed on a per pixel basis. For each pixel, its surrounding pixels in a circle of predefined radius are considered. Each such pixel is flagged with a value of 1 if it is larger than the central pixel, or 0 otherwise. Scanning the sur-rounding pixels in a clockwise order, a binary number is formed from their assigned values. This number is converted to the dec-imal system and assigned to the central pixel. The value of the measure for a specific patch is calculated through averaging the resultant pixel values for all pixels of the patch.
bits with 0 values are likely to be found in the former numbers, because of the existence of more surrounding pixels having the same intensity as the central one. However, 0 values dominate also in case of heterogeneous neighborhoods having a central pixel with larger intensity values than its surrounding pixels.
To counterbalance this drawback, a variation of the local binary patterns algorithm is also tested, termed local ternary patterns (Tan and Triggs, 2007), with the incorporation of a third value in labeling neighboring pixels. In this case, if a pixel intensity dif-fers within a predefined range±dfrom the central pixel it takes value 1. If it is larger or smaller than the central pixel by more thand, it takes value 2 or 0, respectively. In addition, depending on the value of ranged, the measure may handle noise and poten-tial inaccuracies of the data, up to a certain degree. The created number is now expressed in the ternary system instead of the bi-nary, i.e. having number three as basis. The more homogeneous textures are expected to be represented by numbers close to the one having all its bits equal to 1.
Following the same notion, another variation can be introduced from the combination of local binary and ternary patterns, by as-signing value 0 to the pixels whose intensity differs less than a range±dfrom the central one and value 1 otherwise. In this measure, the more homogeneous a patch, the smaller its measure value is expected to be.
4 RESULTS AND DISCUSSION
To evaluate the performance of the proposed measures in esti-mating vegetation height and discriminating between LPH/MPH and TPH habitat classes, different versions of the measures were applied to all patches of low/mid and tall phanerophytes on Le Cesine site, extracted from the available habitat map, for each band of the Quickbird image. 52 LPH/MPH and 99 TPH patches were totally considered. For each patch, each measure was calcu-lated on a per pixel basis and then averaged for the pixels of the patch.
The discriminatory power of each measure for a specific band was tested in two ways. At first, Student’s t-tests were applied to compare the measure values for LPH/MPH and TPH patches. Under the null-hypothesis that the values of LPH/MPH and TPH patches come from the same distribution, one-tailed tests were performed to assess our expectation that LPH/MPH patch values are significantly smaller than TPH ones. In addition, the ability of the measures to create correct classification of the LPH/MPH and TPH patches was evaluated with a decision tree classifier based on the CART (Classification And Regression Tree) methodology (Breiman et al., 1984). A CART tree consists of binary nodes, each one examining whether the value of a patch for a specific measure is smaller or larger than a certain value. In addition, at the end of the training process, CART trees are pruned, i.e. the number of their nodes is reduced to a certain degree, in order to increase their generalization performance with data non belong-ing to the trainbelong-ing set.
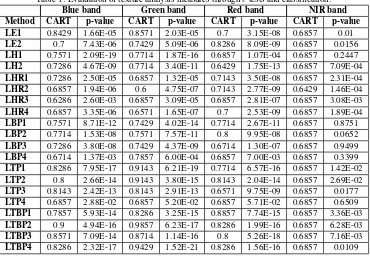
Table 1 summarizes the results of the evaluation of the texture analysis measures. Different parameters were tested for each ap-proach, resulting in different instances of each measure. A clas-sification tree was created for each measure in each band. For the training of each tree a random subset of 30 LPH/MPH and 50 TPH patches was selected; the non-selected patches were used for testing the classification accuracy of the tree. The ratio of the correctly classified patches to the total number of the test set patches is recorded in the table. In addition, the p-value resulting
from each t-test is drawn, indicating the probability that a differ-ence between the LPH/MPH and TPH mean values as large as or larger than the one observed can occur, assuming that the null hy-pothesis is true. The lower the p-value, the larger the probability that the null hypothesis is wrong and, thus, the measure values for the LPH/MPH patches do not come from the same distribu-tion and are significantly smaller than the TPH ones.
Two versions of the local energy measure appear in Table 1: in LE1, a window of3×3pixels around each pixel was used for the
calculation of the variance, while in LE2, a window of5×5pixels
was used. In LH1 and LH2 versions, the local entropy was calcu-lated in9×9pixel windows. The data were quantized in 8 bins
for each individual window in LH1, while in LH2 quantization in 8 bins was applied to the whole region from the beginning. A quantization in 8 bins of the whole region and a selection of9×9
pixel windows as the small ones, were applied in ‘LHR’ versions of the calculation of the local entropy ratio. In LHR1 and LHR2 the small windows were included in the calculation of the local entropy of the large windows. In LHR1,13×13pixel windows
were selected as the large ones, while in LHR2 their dimensions were21×21pixels. In LHR3 and LHR4, the same parameters as
in LHR1 and LHR2, respectively, were used, with the difference that the inner window pixels were excluded from the calculation of the local entropy of the outer windows. Rotation invariant and rotation variant local binary patterns were calculated for radius 1 in LBP1 and LBP2, respectively. In LBP3 and LBP4, the same parameters were used, with the radius changing to 2. The ‘LTP’ and ‘LTBP’ versions were the same as the respective ‘LBP’ ones, with the only difference being that the ternary system and the modified binary approach were adopted, respectively.
As observed, most p-values resulting from the t-tests are signif-icantly smaller than the 5% level of significance usually used in assessing the null hypothesis (Chatfield, 1983). This provides a strong evidence against the null hypothesis that the mean values of the measures for LPH/MPH and TPH patches are almost the same and strongly supports our theoretical assumption that the values of the LPH/MPH patches are significantly smaller than the TPH ones. The smaller the p-value for a specific measure instance, the higher the confidence that this instance can lead to clear discrimination of low/mid and tall phanerophyte patches. As far as the used Quickbird bands is concerned, it is observed that all visible ones performed almost equally well and outper-formed the near-infrared (NIR) band in discriminatory power. Among them, values extracted from the green band, seem to pro-vide better results for most measures. Regarding the measures tested, the local ternary patterns, ‘LTP’, and the modified local binary patterns, ‘LTBP’, instances seem to outperform all other measures in the visible bands, with the latter appearing slightly better. The local entropy ratio measure, on the other hand, ap-pears robust in all bands and provides satisfactory results even in the NIR band, especially in the implementations where the outer window is significantly larger than the inner one, LHR2 and LHR4.
The top performing measures as far as the t-test is concerned, include the implementation of the rotation invariant local ternary patterns with radius 1, LTP1, as well as the modified rotation vari-ant local binary patterns approach with radius 2, LTBP4, both cal-culated in the green band, with p-values of the order of magnitude of10−20
Table 1: Evaluation of texture analysis measures throught-tests and classification. Blue band Green band Red band NIR band Method CART p-value CART p-value CART p-value CART p-value LE1 0.8429 1.66E-05 0.8571 2.03E-05 0.7 3.15E-08 0.6857 0.01 LE2 0.7 7.43E-06 0.7429 5.09E-06 0.8286 8.09E-09 0.6857 0.0156 LH1 0.7571 2.09E-19 0.7714 1.87E-16 0.6857 1.07E-04 0.6857 0.2447 LH2 0.7286 4.67E-09 0.7714 3.40E-11 0.6429 1.75E-13 0.6857 7.09E-04 LHR1 0.7286 2.50E-05 0.6857 1.32E-05 0.7143 3.50E-08 0.6857 2.31E-04 LHR2 0.6857 1.94E-06 0.6 4.75E-07 0.7143 2.77E-09 0.6429 1.46E-04 LHR3 0.6286 2.60E-03 0.6857 3.09E-05 0.6857 2.81E-07 0.6857 3.08E-03 LHR4 0.6857 3.35E-06 0.6571 1.65E-07 0.7 2.53E-09 0.6857 1.89E-04 LBP1 0.7571 8.71E-12 0.7429 4.02E-14 0.7714 2.67E-11 0.6857 0.8751 LBP2 0.7714 1.53E-08 0.7571 7.57E-11 0.8 9.95E-08 0.6857 0.0652 LBP3 0.7286 3.80E-08 0.7429 4.37E-09 0.6714 1.30E-07 0.6857 0.9499 LBP4 0.6714 1.37E-03 0.7857 6.00E-04 0.6857 7.00E-03 0.6857 0.3399 LTP1 0.8286 7.95E-17 0.9143 6.21E-19 0.7714 6.57E-16 0.6857 1.42E-02 LTP2 0.8 2.66E-14 0.9143 3.80E-15 0.8143 2.04E-14 0.6857 2.69E-02 LTP3 0.8143 2.42E-13 0.8143 2.91E-13 0.6571 9.75E-09 0.6857 0.0177 LTP4 0.6857 2.88E-02 0.6857 5.20E-02 0.6857 5.71E-02 0.6857 0.6509 LTBP1 0.7857 5.93E-14 0.8286 3.25E-15 0.8857 7.74E-15 0.6857 3.36E-03 LTBP2 0.9 4.94E-16 0.9857 6.23E-17 0.8286 1.99E-16 0.6857 6.28E-03 LTBP3 0.8571 7.09E-14 0.8714 1.14E-16 0.8 5.26E-18 0.6857 7.16E-03 LTBP4 0.8286 2.32E-17 0.9429 1.52E-21 0.8286 1.56E-16 0.6857 0.0109
with radius 1, LTBP2, having also a very low p-value and reach-ing an accuracy of 98.57%. The local variance instance of3×3
size window, LE1, shows a high classification rate in the green and blue bands and outperforms the local entropy, local entropy ratio and local binary patterns approaches. As previously, data from the green band seem to provide the best classification for almost all measures, apart from the local entropy ratio instances, for which better classification rates are achieved in the red band. Similarly to the t-tests, instances based on local ternary and the modified local binary patterns in the green band are the top per-forming ones, while data from the NIR band result in the lowest classification performance for almost all measures.
In general, the lower the p-value of a method, the highest its clas-sification rate. Therefore, comparing two measures, the one with the lowest p-value is expected to provide the highest classifica-tion accuracy. However, as seen in Table 1, this general idea is not always true. This is caused by the random split of the data into training and test data, where the existence of outliers may influence the results of the t-test and classification to a different degree.
5 CONCLUSIONS AND FUTURE WORK Considering a multispectral Quickbird image as the only source of data to discriminate between low and high vegetation habitats, a series of texture analysis measures, quantifying the degree of homogeneity of the texture, were proposed and evaluated. The approach is based on the idea that the shorter and smaller the vegetation, the more homogeneous the texture of the area will appear. On the contrary, in areas with tall vegetation, inhomoge-neous texture appears because vegetation canopy, tree trunks and ground alternate.
Local variance, local entropy and local binary patterns served as the basis for the extraction of the proposed measures. Several variations and different parameters were tested for each measure for all the available Quickbird bands. It was found that, in gen-eral, measures calculated from data from the green band outper-formed the ones from the other bands. As far as the methods
are concerned, a modification of the local binary patterns ap-proach, assigning a 0 value to the pixels differing within a pre-defined range from the central pixel of the window under con-sideration, the value of 1 otherwise, seemed to outperform the other approaches in most bands. Among the tested instances of the method, the rotation variant one with a window radius equal to 1 calculated in the green band, was the most able to capture local texture variations and showed the best classification results. Some instances of another variation of the local binary patterns, forming ternary numbers, performed similarly well.
In general, instances of different measures performed well in dis-criminating habitats with vegetation lower or higher than 2m. The results are promising for future extension to the discrimination of more height categories. The efficiency of the measures with other passive sensors can be part of future research tasks, as well as their application to other spectral bands or combinations of bands. The results encourage future research in texture analysis methods as alternatives in vegetation height estimation without the use of active sensors, such as LiDAR, or the need of exten-sive field campaigns. This can reduce the cost of land cover and habitat mapping through the use of less data and facilitate eco-logical monitoring and environmental sustainability planning.
ACKNOWLEDGEMENTS
The work presented was supported by the European Union Sev-enth Framework Programme FP7/2007-2013, SPA. 2010.1.1-04: “Stimulating the development of 490 GMES services in specific area”, under grant agreement 263435, project BIO SOS: BIOdi-versity Multi-Source Monitoring System: from Space To Species, coordinated by CNR-ISSIA, Bari-Italy.
REFERENCES
Buckley, D. S., Isebrands, J. and Sharik, T. L., 1999. Practi-cal field methods of estimating canopy cover, PAR, and LAI in Michigan Oak and pine stands.North. J. Appl. For., 16(1), pp. 25– 32.
Bunce, R., Metzger, M., Jongman, R., Brandt, J., de Blust, G., Elena-Rossello, R., Groom, G., Halada, L., Hofer, G., Howard, D., Kov, P., Mcher, C., Padoa-Schioppa, E., Paelinx, D., Palo, A., Perez-Soba, M., Ramos, I., Roche, P., Sknes, H. and Wrbka, T., 2008. A standardized procedure for surveillance and monitoring european habitats and provision of spatial data.Landscape Ecol., 23(1), pp. 11–25.
Chatfield, C., 1983. Statistics for Technology : A Course in Ap-plied Statistics. 3rd edn, Chapman & Hall/CRC, Boca Raton, FL, ch. 7.
Di Gregorio, A. and Jansen, L. J. M., 1998.Land Cover Classifi-cation System (LCCS): classifiClassifi-cation concepts and user manual. Food and Agriculture Organization, Rome.
Dong, L. and Wu, B., 2008. A comparison of estimating forest canopy height integrating multi-sensor data synergy — A case study in mountain area of Three Gorges. In: The International Archives of the Photogrammetry, Remote Sensing and Spatial In-formation Sciences, ISPRS, Beijing, Vol. 37, pp. 384–379.
Dubayah, R. O., Sheldon, S. L., Clark, D. B., Hofton, M. A., Blair, J. B., Hurtt, G. C. and Chazdon, R. L., 2010. Estimation of tropical forest height and biomass dynamics using lidar remote sensing at La Selva, Costa Rica.J. Geophys. Res., 115, pp. 256– 266.
Hyde, P., Dubayah, R., Walker, W., Blair, J. B., Hofton, M. and Hunsaker, C., 2006. Mapping forest structure for wildlife habi-tat analysis using multi-sensor (LiDAR, SAR/InSAR, ETM+, Quickbird) synergy. Remote Sens. Environ., 102(1–2), pp. 63– 73.
Kwak, D. A., Lee, W. K., Lee, J. H., Biging, G. S. and Gong, P., 2007. Detection of individual trees and estimation of tree height using LiDAR data.J. For. Res., 12(6), pp. 425–434.
Lefsky, M. A., Harding, D. J., Keller, M., Cohen, W. B., Caraba-jal, C. C., Espirito-Santo, F. D. B., Hunter, M. O. and de Oliveira, R. J., 2005. Estimates of forest canopy height and aboveground biomass using ICESat.Geophys. Res. Lett., 32(L22S02), pp. 4.
Nilsson, M., 1996. Estimation of tree heights and stand volume using an airborne lidar system.Water Resour. Res., 56(1), pp. 1– 7.
Payero, J. O., Neale, C. M. U. and Wright, J. L., 2004. Compar-ison of eleven vegetation indices for estimating plant height of alfalfa and grass.Appl. Eng. Agric., 20(3), pp. 385–393.
Petrou, M. and Garc´ıa-Sevilla, P., 2006.Image Processing: Deal-ing with Texture. Wiley, Chichester.
Praks, J., Hallikainen, M., Sepp¨anen, J. and Hyypp¨a, J., 2009. Boreal forest height estimation with SAR interferometry and laser measurements. In: International Geoscience and Remote Sensing Symposium, IEEE, Cape Town, South Africa, Vol. 5, pp. V–308–V–311.
Shannon, C. E., 1949. Communication in the presence of noise. P. I.R.E., 37(1), pp. 10–21.
Stojanova, D., Panov, P., Gjorgjioski, V., Kobler, A. and Dˇzeroski, S., 2010. Estimating vegetation height and canopy cover from remotely sensed data with machine learning. Ecol. Inform., 32(4), pp. 256–266.
Tan, X. and Triggs, B., 2007. Enhanced local texture feature sets for face recognition under difficult lighting conditions. In: Proceedings of the 3rd International Conference on Analysis and Modeling of Faces and Gestures, Springer, Rio de Janeiro, Brazil, Vol. 4778, pp. 168–182.
Wang, Z., Schaaf, C. B., Lewis, P., Knyazikhin, Y., Schull, M. A., Strahler, A. H., Yao, T., Myneni, R. B., Chopping, M. J. and Blair, B. J., 2011. Retrieval of canopy height using moderate-resolution imaging spectroradiometer (MODIS) data. Remote Sens. Envi-ron., 115(6), pp. 1595–1601.
Weltz, M. A., Ritchie, J. C. and Fox, H. D., 1994. Comparison of laser and field measurements of vegetation height and canopy cover.Water Resour. Res., 30(5), pp. 1311–1319.