COMPARISON OF 3D RECONSTRUCTION SERVICES AND TERRESTRIAL LASER
SCANNING FOR CULTURAL HERITAGE DOCUMENTATION
S. Rasztovits a, *, P. Dorninger b
a
Dept. of Geodesy and Geoinformation, TU Vienna, Austria – [email protected] b
4D-IT GmbH, Austria – [email protected]
KEY WORDS: SFM, Close-range, Sculpture, 3D Modeling, Accuracy
ABSTRACT:
Terrestrial Laser Scanning (TLS) is an established method to reconstruct the geometrical surface of given objects. Current systems allow for fast and efficient determination of 3D models with high accuracy and richness in detail. Alternatively, 3D reconstruction services are using images to reconstruct the surface of an object. While the instrumental expenses for laser scanning systems are high, upcoming free software services as well as open source software packages enable the generation of 3D models using digital consumer cameras. In addition, processing TLS data still requires an experienced user while recent web-services operate completely automatically. An indisputable advantage of image based 3D modeling is its implicit capability for model texturing. However, the achievable accuracy and resolution of the 3D models is lower than those of laser scanning data. Within this contribution, we investigate the results of automated web-services for image based 3D model generation with respect to a TLS reference model. For this, a copper sculpture was acquired using a laser scanner and using image series of different digital cameras. Two different web-services, namely Arc3D and AutoDesk 123D Catch were used to process the image data. The geometric accuracy was compared for the entire model and for some highly structured details. The results are presented and interpreted based on difference models. Finally, an economical comparison of the generation of the models is given considering the interactive and processing time costs.
* Corresponding author.
1. INTRODUCTION
The digital representation of objects is necessary for numerous scientific tasks. In combination with texture, the geometrical models are commonly used for visual interpretation. Complex surface structures and temporal changes are detectable and thus used as foundation for various applications in cultural heritage documentation and maintenance. Two different methods are commonly used for data acquisition. Image based reconstruction uses digital photographs of a scene taken from different viewpoints. Alternatively, Terrestrial Laser Scanning (TLS) is based on actively emitting laser beams to directly determine points at the object’s surface. Both methods can be used individually. In addition, hybrid approaches based on TLS with on-mount or in-line cameras are applicable to directly assign texture information to the point cloud.
Numerous comparisons of both methods can be found in literature. Grussenmayer et al. (2008) analyze the quality of facades of a building and almost planar objects. It was found, that both methods deliver similar result with respect to the achievable accuracy. However, the recording configuration of each method was of crucial importance. Roncella et al. (2011) describe a structure from motion (SFM) approach based on automatically detected interest points i.e. tie-points. The orientation of the different images is estimated by bundle adjustment. The possibility of mounting the camera on a low cost-UAV drone and subsequent processing of the recorded data with different matching services is described by Neitzel et al. (2011). A comparison of different web-services is described by Kersten et al. /2012).
Within this contribution, we investigate the achievable accuracy of automated web-services for image based 3D model generation. The results are compared to a reference model, derived from TLS point clouds. This comparison is based on geometric models of a copper sculpture. Finally, an economical evaluation of the necessary effort is given.
2. METHODOLOGY AND THEORY
2.1 Terrestrial Laser Scanning
TLS is an active measurement method using emitted laser light at visible or near infrared wavelength to measure the distance between the scanner and object surface. A rotating mirror distracts the signal in a well-defined direction in space and in combination with the determined distance measure, it is possible to determine a 3D point via (Eq.1). All points recorded from one scanning position are referring to the scanner coordinate system. In general, multiple scanning positions are necessary to cover the entire surface of an object. Hence, transformations between different scans are required. The transformation (Eq.1) consists of 7 parameters - 3 rotation angles, 3 translations and a scale. While the latter, i.e. the scale, typically needs not to be estimated, the remaining 6 parameters of (Eq.1) can be determined using control points. Each point-pair defines 3 equations to solve the equation system and by selecting a minimum number of 3 points, the unknown parameters can be computed in a linear way. By including more than 3 points, the equation system is over-determined and a
least squares adjustment may be applied. For the least square approach, approximations of the unknown parameters are necessary. They can be determined manually or automatically by 3D features (R.B. Rusu et al., 2009).
The determination of the positions of the control points within overlapping scans may either be realized interactively (i.e. by a user selecting unique features like corners, end of edges, etc.) or automatically by extracting, either signalized or well-defined points. Alternatively, the registration can be determined by means of minimizing the discrepancies between points of overlapping regions. This approach requires an initial estimation of the transformation. Typically a variant of the iterative closest point (ICP) algorithm is applied for this. Rusinkiewvicz et al. (2001) describe various variants of this algorithm.
2.2 Image Based Surface Reconstruction
Photogrammetry aims at reconstructing object points based on images. The so-called image ray defines the projection of an object point through the projection center onto the light sensitive elements (CCD sensor) on an image plane. An image is therefore a mapping of the three dimensional space on a two dimensional plane. The mathematical relations between the object coordinate system and the image coordinate system is given in (Eq. 2).
R is an orthogonal matrix that describes the rotation and (Xi -
Xi,0) is the translational shift of the projection center with
reference to a superior coordinate system. The orthogonal distance between the image-plane and the projection center is called focal length c and required for subsequent point determination. In addition, the principal point is defined by its location x0, y0 where the optical axis intersects the image sensor
is essential. Those three parameters are categorized as interior orientation and can be computed with a calibration- or test-field where known and precise 3D coordinates are observed. By observing an identical object point in two different images taken from (different camera) positions, it is possible to intersect corresponding image rays and to determine 3D points.
2.3 Automated Reconstruction Services
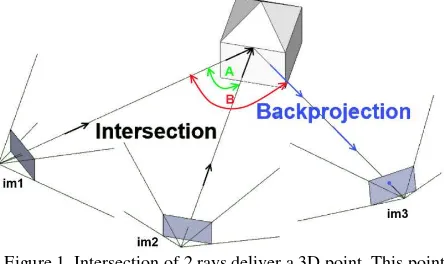
An automated reconstruction service aims at determining as main point correspondences in an unordered list of images as possible. In a first step, some statistical delimitated points (feature points, like the SIFT feature descriptor (D.G. Lowe, 1999)) are extracted. The estimation/design of such descriptors is done due to different restriction (considering the same object point is recorded from different position(s), scale and illumination). Starting from extracted feature points from one image, all extracted feature points from all other images are compared via a similarity measurement. This step is called matching. With the thus determined point correspondences, a fundamental matrix (F) can be computed. F describes the points can be computed via a spatial intersection. If a third view (im3 in Fig. 1) observes the same reconstructed 3D object point, the position of the camera can be estimated by a spatial backward intersection. Points that are only visible in im2 and im3 can be reconstructed after the orientation was computed and every remaining image can be concatenated in the same way.
Figure 1. Intersection of 2 rays deliver a 3D point. This point can be re-projected onto another image (by a known
orientation)
Usually, the back-projected object points have an offset (reprojection error) with respect to the extracted feature points in the image, caused by parameter inaccuracies, unhandled camera distortions or outliers in the feature detection and/or matching process, except the number of unknowns (rotation, translation and internal camera parameters) is equal to the orientation. The extraction of feature points, the matching part, outlier handling, as well as the bundle adjustment are categorized as sparse reconstruction and are a crucial accuracy criterion for an automatic reconstruction service.
The result of the sparse reconstruction is a sparse point-cloud, where only feature points or significant texture based pixel-areas are involved. A dense matching process is performed correlated with pixel regions around the before restricted line. The limitation of the search area provides a reduction of computation time and a more robust result, because the probability that the same selected area is occurring is increased. The result of this step is a point cloud with a resolution that is correlated to the resolution of the images used.
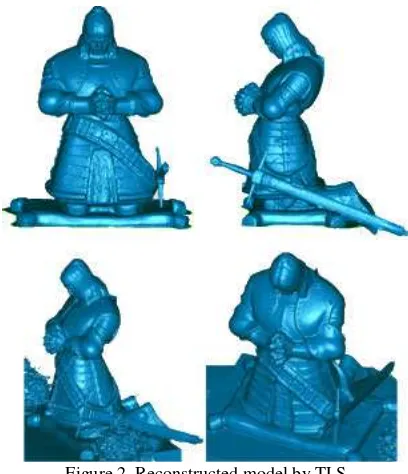
Finally, the scale of the model has to be determined properly. It may either be determined by explicit measurement of a priori known distances between well-defined points or by so-called direct georeferencing, i.e. if the camera positions are exactly known. While in the latter case, the model is properly scaled implicitly, the first case requires the application of a spatial similarity transformation. By introducing control point measurements in the bundle adjustment process, it is also object is approximately 2 by 1.5 by 2 meters. The scan positions were radially aligned around the object. The registration of the scans was initiated by interactively determined identical points. Subsequently it was improved by an ICP algorithm. The triangulation model was determined by means of an advanced implementation of the Poisson triangulation (Nothegger, 2011). In comparison to other approaches, the thus determined triangulation has fewer deficiencies considering twisted triangles and data gaps. This reduces the required interactive post-processing significantly.
Figure 2. Reconstructed model by TLS
3.2 Data Acquisition – Photogrammetry
For the image data acquisition, two digital cameras where used (Table 1). For the Nikon, we used a tripod, while the Casio images were taken without.
Cameratype Model Resolution Camera lens Images
SLR Nikon
Table 1. Camera specification and viewpoint setup
Figure 3. Configuration of the data acquisition
The viewing positions were aligned with equal angular increments at almost circularly arranged viewpoints around the sculpture hence ensuring almost equal object distances (Fig.3). The resulting overlap is approximately 70-80%. The models are illustrated in (Fig.4, Fig.5). After an export of the data from the different software packages, the raw point-cloud was triangulated with the Poisson approach that is implemented in Meshlab (http://meshlab.sourceforge.net/).
Figure 4. 3D-model based on Nikon D70 images (Arc3d)
Figure 5. 3D-model based on Casio Exilim images (Arc3d)
No texture information is available at the shoulder, because the CCD sensor is overexposed by direct sun light.
4. RESULT AND DISCUSSION
4.1 Comparison of TLS and Automated Services
The comparison of the reference (i.e. TLS-based) model and the results of the web-service are based on difference models. The offsets (differences) are represented as color-coded-visualizations. The photogrammetric models were generated by the software "Arc3d" (M. Vergauwen, et al., 2006) and Autodesk 123D Catch (www.123dapp.com/catch).
Prior to the comparison, it was necessary to estimate the parameters of a similarity transformation. As mentioned in section 2.3, the missing scaling factor between the TLS and image based models was manually determined by selecting identical distances in both models. After applying this scaling factor on the photogrammetric model, an initial similarity transformation between both models was performed and a refinement of the evaluated parameters by ICP applied. As it was necessary to refine the before appreciated scaling factor, this process was done in an iterative way, until the difference offsets of the ICP algorithm showed only minor changes.
Figure 6. Difference model: TLS-Nikon Arc3d
Figure 7. Difference model: TLS-Casio Arc3d
Figure 8. Difference model: TLS-Nikon 123D Catch
Figures 6 to 8 show difference models generated after the registration. It can be seen, that the “Nikon”-model (Fig.5) has the most detailed surface with comperably small differences with respect to the reference model. All reconstruction service models show a high offset near the area of the shoulder. This is caused by an over-exposure (all models got recorded at the
same time) caused by sun radiation. The pedestal as well as the sword show also high discrepancies. At large conic and/or round areas (e.g. the hip, lower shoulder parts and the back) the differences are comperably small.
4.2 Detailed Comparison
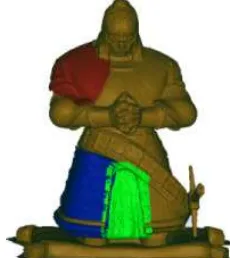
By computing the transformation parameters of the whole model, some areas might have a large discrepancy/offset, because the transformation parameters are evaluated by a minimization function with all respective points or triangles. In the following, three small areas of the model were investigated locally (Fig.9). For this, an iterative registration process was performed, to achieve better transformation parameters. The naming of the figures in this section are as follows: Fig. X {m,n}, where F is the figure number, m the row index and n the column index.
Figure 9. Selected areas for a detailed analysis. Red: right shoulder armor, Green: chain mail, Blue: right leg saver
Figure 10. Chain mail containing wavy structures and steep surfaces
This selected chainmail has an almost repeating wavy pattern enclosed by steep, almost orthogonal edges. It can be seen, that all models have deficiencies at those edges. The reconstruction of the wavy pattern failed with any camera and software configuration (Fig.10 {1-2, 1-4}). It is remarkable, that some linear effects occur in the comparison between the Nikon-Casio difference model (Fig.10 {1-2, 4}).
Figure 11. Right leg saver. Rivets and line structures.
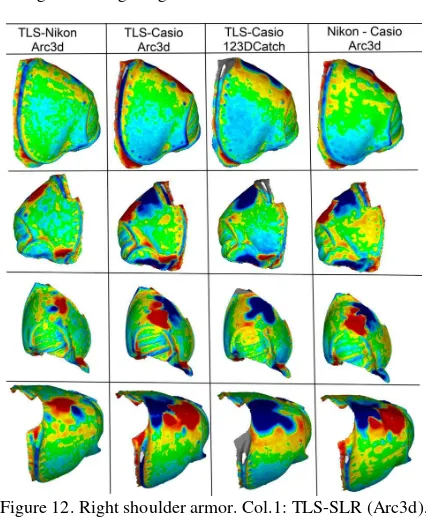
Figure 12. Right shoulder armor. Col.1: TLS-SLR (Arc3d), Col.2: TLS-Casio (Arc3d), Col.3: TLS-Casio (123D Catch),
Col.4: Nikon-Casio (Arc3d)
The selected shoulder part has a weak curvature with some steep edges and some peaks (rivets). It discernible (Fig.12, {3,1-4}), that the upper shoulder parts have huge discrepancies. The offset is changing very fast from lower than -5mm up to greater than +5mm (outshined areas). The best results were achieved by the Nikon camera with the software Arc3d, because the regions are not as big as for the other models. It is remarkable that those differences are approximately identical but conversely (Fig.12, {2,1} and {2,2}). Small structures like the arranged rivets are visible in the TLS model but not visible in any image based reconstructed. By a sphere fitting around the structure of the surface, it was determined that one rivet has approximately 5mm along the surface and a height of 3mm. Those objects were not properly reconstructed by all configurations (neither camera nor software), because the distance to the object was probably too large. Every photogrammetric model has some significant differences at steep edges (Fig.12, {2,1-4} bottom left).
5. CONCLUSIONS
Automated reconstruction services allow for the generation of 3D models for non-expert users. The accuracy as well as the
resolution is highly correlated to the viewing point configuration.
Compared to the TLS reference model it could be demonstrated that the image based results have a reduced richness in detail. In addition, accuracy deficiencies occur especially at sharp structures.
Table 2. Applied time for generating the models
It was assumed that the automatically applicable web-services are more efficient in reconstructing the object surface compared to TLS data processing. Table 2 shows the total time required for data acquisition, data pre-processing to final model generation. Hence, this assumption could not be approved, because in the presented configuration, the images required a time-consuming pre-processing step. It was necessary to mask out the object in every image manually, because some vegetation was present direct behind the sculpture. First results showed, that this area had to be removed to avoid gross errors at the orientation (as well as it's followed dense-matching process).
However, the evaluated webservices excel laserscanning, if accuracy and richness in detail are not of prior importance and if visualization, i.e. texture mapping, is required. For highly accurate documentation modeling, TLS is the favorable choice.
6. REFERENCES
Dorninger, P., Nothegger. C., 2010. Das Messverhalten Terrestrischer Laser Scanner an Steinoberflächen, In:
Publikationen der Deutschen Gesellschaft für
Photogrammetrie, Fernerkundung und Geoinformation e.V.,
Band 19, pp. 504-512.
Grussenmeyer, P., Landes, T., Voegtle, T., & Ringle, K., 2008. Comparison methods of terrestrial laser scanning, photogrammetry and tacheometry data for recording of cultural heritage buildings. International Archives of Photogrammetry
and Remote Sensing, 37(5), pp. 213-218.
Kersten, T., Lindstaedt, M., Mechelke, K. Zobel, K., 2012. Automatische 3D-Objektrekonstruktion aus unstrukturierten digitalen Bilddaten für Anwendungen in Architektur, Denkmalpflege und Achäologie. Publikationen der Deutschen
Gesellschaft für Photogrammetrie, Fernerkundung und
Geoinformation e.V., Band 21, pp. 137-148
Lowe, D. G., 1999. Object recognition from local scale-invariant features. In: The proceedings of the seventh IEEE
international conference on Computer Vision, Vol. 2,
pp.1150-1157.
Neitzel, F., Klonowski, J., Siebert, S., & Dasbach, J. P., 2011. Mobile 3D Mapping mit einem low-cost UAV-System am Beispiel der Deponievermessung. AVN–Allgemeine
Vermessungsnachrichten, 10, pp. 336-347.
Nothegger, C., 2011. Improving Completeness of Geometric Models From Terrestrial Laser Scanning Data, In: Proceedings
of the 23rd CIPA Symposium, Prague, Czech Republic.
Roncella, R., Re, C., & Forlani, G., 2011. Performance evaluation of a structure and motion strategy in architecture and cultural heritage. International Archives of Photogrammetry
and Remote Sensing, 38(5/W16), pp. 285-292.
Rusinkiewicz, S., Levoy, M., 2001. Efficient variants of the ICP algorithm. In: 3-D Digital Imaging and Modeling, Third International Conference on 3-D Digital Imaging and Modeling, IEEE, pp. 145-152.
Rusu, R. B., Blodow, N., & Beetz, M., 2009. Fast point feature histograms (fpfh) for 3d registration. In: IEEE International
Conference on Robotics and Automation, pp. 3212-3217.
Vergauwen, M., Van Gool, L., 2006. Web-Based 3D Reconstruction Service. Machine Vision Applications 17, pp. 411-426.
7. ACKNOWLEDGEMENTS
This work was performed within the project Hybrid3D, funded by the Österreichische Forschungsförderungsgesellschaft
(FFG), Pr.Nr. 829554, and supported by 4D-IT GmbH
(www.4d-it.com).