IMPACT OF STYLISTIC FEATURES, ARCHITECTURAL AND URBAN RULES OF THE
ALGIERS ARCHITECTURAL HERITAGE DATING BETWEEN 1830 AND 1930 ON THE
STRENGTH OF ITS BUILDINGS DURING THE EARTHQUAKE.
M. A. Souami a
Phd advisor professor M.S. Zerouala
a
EPAU, Ecole Polytechnique d’architecture et d’urbanisme, Route de Beaulieue BP 177, El-Harrach 16200, Algiers, Algeria- [email protected]
KEY WORDS: Architectural heritage, buildings preservation strategy, styles of architecture, urban design, earthquake-resistant
design, computer simulation.
ABSTRACT:
In a other work, we have highlighted a theoretical point of view that there is an relation between the earthquake-resistant architectural design codes and, the urban and stylistic characteristics of buildings and urban forms of the Algiers architectural heritage dating between 1830 and 1930. Following this, we hypothesized that its various stylistic and urban characteristics have a direct impact on the resilience of buildings to earthquakes. The purpose of this article is to try through the computer simulation examples of some stylistic and urban characteristics to prove the validity or not of our hypothesis.
1. INTRODUCTION:
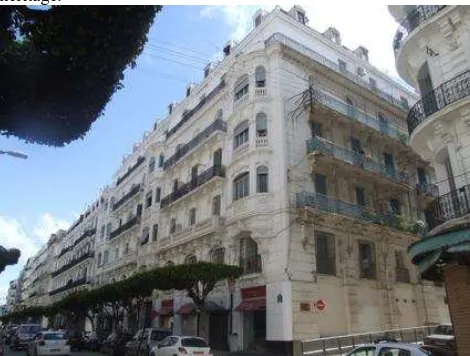
The Algerian architectural heritage of the period from 1830 to 1930 is now in a state of high degradation that may lead to the destruction of the buildings and the disappearance of this heritage.
Figure 01: Algiers architectural heritage 1830-1930.
In our opinion, we assume that this is rather due to a lack of knowledge about the seismic characteristics of this heritage, and not a lack of an earthquake-resistant potential of the buildings.
In first time we are based on the work of Milan Zacek, and we had prove that there is an relation between the earthquake-resistant architectural design codes and, the urban and stylistic characteristics of buildings and urban forms of the building of the studied period.
Now, we have to prove the validity of our hypothesis with using the computer simulation.
Figure 02: Data correlation. (Souami, 2012.)
2. METHODOLOGY
To demonstrate the role of urban and stylistic characteristic in the behavior of buildings during an earthquake, we realized a computer simulation with simplified examples. Each example will highlight one specific characteristic of the buildings of the studies period.
To highlight the impact of each feature, it was important to reduce the risk of interference with other factors to avoid to skewed the results of the experiment. This led us to a double simplification.
First on the body itself, we decided to simulate a front wall and not an entire building. This we'll have to take into account a large number of other parameters, with the risk of interference between the parameters.
Secondly, the simulation will verify the impact on one factor, that of the arrow that corresponds to the amount of movement of the building. This choice is justified by the fact that the simulation is done by applying a lateral horizontal force on a International Archives of the Photogrammetry, Remote Sensing and Spatial Information Sciences, Volume XL-5/W2, 2013
single wall, which doesn't really give the possibility to assess the impact of other factors of the earthquake on constructions such as the twist.
Our simulations consist of a variation in each example of one stylistic or urban characteristics of the wall, and raise the quantity of movement of the wall in the direction of the seismic action level by level.
Various simulations1 performed on the engineering software ETABS 2013, in its version 13.0.0 (evaluation version). This software, created by the company CSI allows the calculation of building structures and simulation of seismic action on buildings.
2.1. Urban and stylistic characteristics used:
The tripartite
(
Tzonis, 1985): The lower level is heavierthan the upper levels
Buildings arrangement (ordonnancement) (Des cars & Pinon, 1991
)
: Combinations are repeated regularly andperiodically.
Individualization of buildings (Loyer, 1994): vertical
overlapping openings and use of bow windows Vertical Hierarchy: reduction of the height of levels.
2.2. Presentation of examples:
From a basic example, we create six different configurations that we simulated by computer.
Case No. 01: This case is our reference model as it is supposed to represent the best case if the recommendations of the Algerian earthquake regulations (RPA, 2003) are followed. it has a regularities of its elements both vertically and horizontally, and it hasn't any retreats or cantilever. The various features of this wall are:
Wall Width 36.8 meters; wall height 29.3 meters Number of Levels 8; 1st level Height: 4.1 meters; Height other levels: 3.6 meters; Module frame: 3.85 meters;
sizes of openings: 2.4 x 3.5 meters for the first level and 1.2 x 2.1 m for other levels.1
We thank Mr. Jugurtha Talmatkadi civil engineer who made the simulations with ETABS.
Figure 03: Case 01
Figure 04: 3d view of case 01
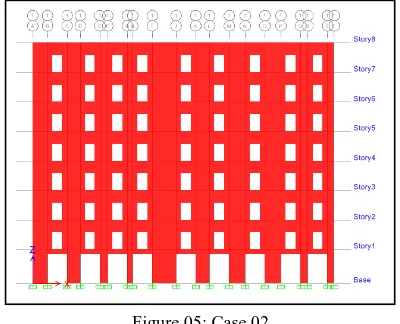
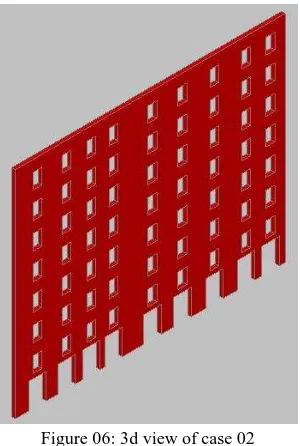
Case 2: This case keeps the same criteria as the first except the horizontal rhythm of horizontal openings is disrupted with distances that vary all the time ranging from 3.05 meters to 5.3 meters.
Figure 05: Case 02
Figure 06: 3d view of case 02
Case 3: in this case it is the superposition of all the elements that changes to a organization staggered openings.Figure 07: Case 03
Figure 08: 3d view of case 03
Case 4: This case is the addition of an cantilever of only one meter. The surface of those elements is less than a quarter of the total area of the wall (8.76%).
Figure 09: Case 04
Figure 10: 3d view of case 04
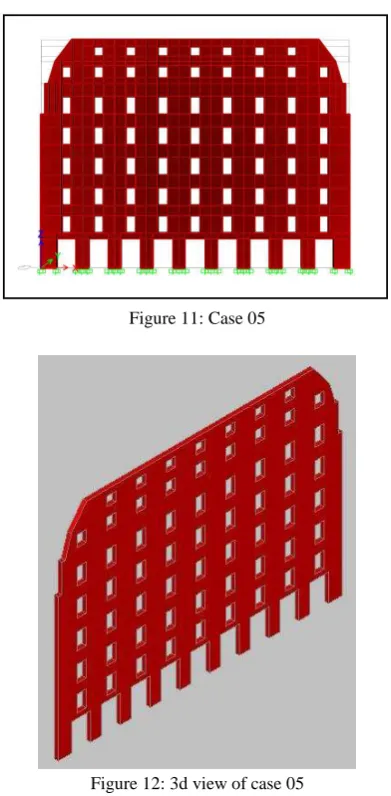
Case 5: it consists in introducing withdrawals in the horizontal and vertical directions: Withdrawal between the 5th and 6th level : 50 centimeters (direct withdrawal);
Withdrawal between the 6th and 7th level : 40 centimeters (direct withdrawal);
Withdrawal between the 7th and 8th level : 80 centimeters (slanted wall);
Withdrawal between the floor and ceiling of the 8th : 80 centimeters (slanted wall);
first level Height: 4.1 meters;
height levels 2nd, 3rd, 4th, 5th and 6th: 3.6 meters; Height 7th and 8th levels: 2, 6 meters.
Since the last two levels have a meter less than the other levels, their openings are smaller 1,2 x1, 2 meters instead of 1.2 x2, 1 meters.
Figure 11: Case 05
Figure 12: 3d view of case 05
Case 6: This case is the combination between the characteristics selected for this research.
Figure 13: Case 06
Figure 14: 3d view of case 06
2.3. Additional data:
Since the study corpus is from Algiers, we decided to make seismic simulations as recommended by the Algerian earthquake regulations that class Algiers in areas of high seismicity (zone III), and the studied building from 2nd group because it is a residential building with height less than 48 meters.
Finally, in order to give more objectivity to our research, we have chosen to do simulations on different cases using two different types of materials (concrete and masonry). This will allow us to see not only the impact of urban and stylistic characteristics of the corpus of studies, but also the impact of the material according to these characteristics.
CONCRETE MASONRY
WEIGHT 24,52KN/M3 WEIGHT 21,21KN/M3 MASS 2,50KN-S²/M4 MASS 2,16KN-S²/M4 E2 32164195KN/M² E 12410564.2KN/M²
Figure 15: Characteristics of materials
3. SIMULATIONS AND RESULTS:
3.1. Presentation of results:
After each simulation, we were able to have the displacement values in millimeters. We can appreciate through a pattern of movement and a table of various displacements level by level.
2
Modulus of Elasticity
Figure 16: example of pattern of movement.
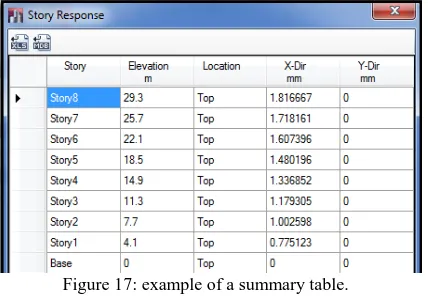
Figure 17: example of a summary table.
Initially, we grouped the data by materials in a summary table. Then in a second step we classified in another table the results level by level from the small amount of movement to the more important to see what cases are the most important.
Level Case 01 Case 02 Case 03 Case 04 Cas e05 Case 06
Figure 18: Table of displacement in millimeters for concrete.
Level Case 01 Case 02 Case 03 Case 04 Case 05 Case 06
Figure 19: Table of displacement in millimeters for masonry.
To make the comparison easier, we assigned to each simulated case a different color in the table. This will allow us to easily identify if the order of movement is the same between the 2 materials level by level, but also to see if the order is the same between the two materials.
Figure 20: Value movements level by level from the smallest to the largest displacement for concrete.
Figure 21: Value movements level by level from the smallest to the largest displacement for concrete.
3.2. Presentation of results:
A. The first result that emerges from these simulations is that the properties used in the simulations have an impact on the amount of movement that can occur during an earthquake. For the cases studied the displacement value increases from 15.54% at first level to 29.57% in 8th level for masonry, and from 16.56% at first level to 31.84% in 8th level for concrete.
B. The order of the sizes of displacement of the wall varies from one material to another. Indeed of the 48 displacement values obtained for each material, 11 does not rank in the same place, which is a rate of 22.92%.
C. The ranking of the displacements of the wall made of the same material from one level to another is not the same. For the concrete wall at the 8th level the study case with the less important displacement is the 5th then the 6th, the 3rd, the 2nd, 1st and finally the 4th. But for the 2nd level it's the 6th then the 2nd, the 5th, the 3rd, the first and finally the 4th.
Level 8 3,03389 3,13560 3,51086 3,52133 3,73314 3,93104
Level 2 1,81195 1,81914 1,82201 1,96098 2,04190 2,12668
Case 01 Case 02 Case 03 Case 04 Case 05 Case 06 Figure 22: Classification of cases studies based on the value of displacements between the 8th and the 2nd for a concrete wall.
D. The case number 01 supposed to be the most favorable is ranked second to last.
E. Finally, case studies 02 and 03 are not the worst even if they do not respect the rules of the repetition of the same rhythm and symmetry to the case 02, and the superimposition of openings in the case 03.
4. CONCLUSION AND PROSPECTIVE:
This study gave us the opportunity to test some hypotheses and refute others.
The stylistic and urban properties of the studied corpora are directly involved in the good behavior of buildings during the earthquake, because the most favorable cases with the least travel are generally cases 4 and 5, which have precisely the characteristics studied.
Depending on the material used, the order of the results differs from one configuration to another. This implies that the regulations should in their recommendations on the properties of shapes do not offer absolute recommendations, but adapts those recommendations according to the materials.
The rigidity is the principal factor to explain the results of our research. Both for the confirmation of hypotheses or for disprove them. This is based on the principle that a more rigid wall is a wall that undergoes less displacement.
Case 2: although we have the same ratio between the full and empty in this case than in the reference case, the change in the distance between the openings give us the possibility to have a larger sections of walls which are more rigid, seen that the ratio between the height and width is more important.
Case 03: the rigidity of a wall increases with the number of bays. Thus, in the base case, we have nine bays. In case number 03, the openings were placed staggered, with openings superimposed every two levels. We created without realizing 19 bays, which have led to rigid the wall and thus reduce the displacements.
Case 4 and 5: these are stiffer for two reasons. First, the last two levels are lower than the other 6 levels, so the ration between the larger and the height of the the case number 2 is ranked first or second, but from the 5th level it ranks behind the cases 5 and 6. This is explained by the fact that from this level there are side withdrawals and reductions in the level height, which significantly increases the rigidity of the wall from of stiffener stiffness enhancing the wall at this level.
Figure 23: Element in cantilever.
Finally, the various simulations have given us the opportunity to see the impact of certain factors on the importance of the displacements of a wall subjected to an earthquake in Algiers. In the future, we need to broaden the scope of our investigation by crossing over architectural parameters related to buildings (building entirely, include the empty, the mass of the building, the proportion of building ... etc.) And checking the other effects of an earthquake (torsion, shear ... etc.).
Bibliographie : device for new conservation strategies,3rd international architectural conservation, Dubaï, 18P.
[4] Tzonis A., L. Lefaivre et D. Bilodeau. 1985, Le classicisme en architecture la poétique de l’ordre, Dunod, Nancy, 224P.
[5] Collectif, RPA 1999 version 2003. Document technique CGS, Alger, 101P.