DOCUMENTING ARCHITECTURAL HERITAGE IN BAHIA, BRAZIL, USING
SPHERICAL PHOTOGRAMMETRY
A.L. de Amorim*, G. Fangi**, E.S. Malinverni**
*Faculdade de Arquitetura, Universidade Federal da Bahia, Salvador, Bahia, Brazil
**Università Politecnica delle Marche, Ancona, Italy g.fangi;[email protected]
KEY WORDS: Architectural Heritage (AH), Spherical Photogrammetry, Documentation, CAD Modeling; GIS
ABSTRACT:
The Cultural Heritage disappears at a rate higher than we are able, not only, to restore but also to document: human and natural factors, negligence or worst, deliberate demolitions put in danger the collective Architectural Heritage (AH). According to CIPA statements, the recording is important and has to follow some guidelines. The Architectural and Urban Heritage data have to be historically related, critically assessed and analyzed, before to be organized according to a thematic structure and become available for further uses. This paper shows the experiences developed by the Laboratory of Computer Graphics applied to Architecture and Design (LCAD), at the Architecture School of the Federal University of Bahia (FAUFBA), Brazil, in cooperation with the Università Politecnica delle Marche (UNIVPM, DICEA Department), Italy, in documenting architectural heritage. The research set up now has been carried out in the historical sites of Bahia, as Pelourinho neighborhood, a World Heritage by UNESCO. Other historical sites are in the plan of this survey, like the cities of Lençóis and Mucugê in Chapada Diamantina region. The aim is to build a technological platform based on low cost digital technologies and open source tools, such as Panoramic Spherical Photogrammetry, Spatial Database, Geographic Information Systems, Three-dimensional Geometric Modeling, CAD technology, for the collection, validation and dissemination of AH.
1. INTRODUCTION
Besides the more obvious applications in conservation and restoration of the buildings, the architectural documentation plays a vital role in preserving the memory of this heritage. This is a highly relevant aspect, given the impossibility of the physical preservation of all significant samples. There are several reasons for this, from the simple effect of time and weather, to more serious and dangerous causes such as heavy rains and floods, fires, earthquakes, neglect, abandonment and vandalism, among others (Amorim, 2007).
In Letellier words: Today the world is losing its architectural and archaeological cultural heritage faster than it can be documented. Human-caused disasters, such as war and uncontrolled development, are major culprits. Natural disasters, neglect, and inappropriate conservation are also among the reasons that this heritage is vanishing. Although we should strive to preserve as much as possible of our architectural and archaeological cultural heritage, we cannot save everything. One of the options available to heritage managers and decision makers is to document this heritage before it is lost. (Letellier, 2007).
Bahia state has been a pioneer in Brazil on leading a large initiative on documenting its cultural heritage; it takes more than 30 years and covers about one thousand and a hundred monuments. This important work began 1974, in order to create the inventory of cultural collection protection of Bahia, called IPAC (Inventário de Proteção do Acervo Cultural da Bahia), which divides the state in five regions, for inventory purpose. One of these issues is dedicated to the cities of Chapada Diamantina region where a lot of very smalls and delicate architectural exist, like Lençóis, Mucugê, Rio de
Contas, and Igatú, among others (BAHIA, 1980). This work was sponsored by the Bahia State Government and it was published in six books, printed in black & white.
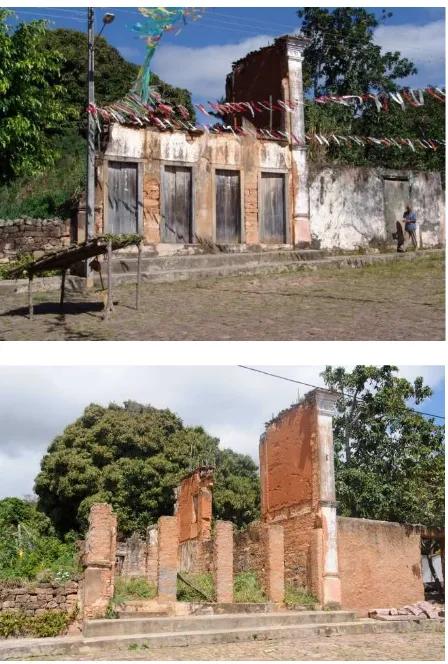
Although broad and important, this work does not cover all the Architectural Heritage of Bahia, which is continually subjected to all kinds of risks. This inventory, prepared for the purpose of knowledge, is not enough to confer effective protection efficiently, given the fact that some buildings which were listed no longer exist. This fact is particularly worrying considering that, except for few examples, the most buildings from the colonial period were composed of raw earth and wood, materials that are completely destroyed by water and fire (Figure 1).
So, in order to protect them against the all kinds of risks, even natural hazards, preserving the memory of Bahia’s Cultural Heritage, it is necessary a huge effort to elaborate a complete and detailed digital multimedia data base of Bahia’s Architectural Heritage.
In this sense, an initiative latest (2004) promoted by the Laboratory of Computer Graphics applied to Architecture and Design (LCAD), at the Architecture School of the Federal University of Bahia (FAUFBA), seeks to build this database using several technologies like digital Photogrammetry, digital Cartography, Spatial Database, Geographic Information Systems, three-dimensional geometric Modeling, CAD technology and 3D Laser scanning technology (Amorim, 2011). In spite of the quality of work and the results achieved, little progress was made, for lack of specific funding sources.
with the partnership of Università Politecnica delle Marche (UNIVPM, DICEA Department), Italy, which has a long tradition and experience in such kind of work (Gabrielli et al., 2007). The research aims to develop a methodological approach to document architectural heritage in the Bahia state, in Brazil, using a set of low cost digital technologies, as a way to increase speed and improve the documentation work. This is a very important aspect considering the Bahia state has the same area than France.
Figure 1. Example of house destruction during the period (2005-2010) at Igatú, in Chapada Diamantina.
2. AN OVERVIEW ABOUT LOW COST AND OPEN SOURCE CATALOUGING SOLUTIONS
The aim of this research is to build a technological platform based on low cost digital technologies and open source tools. The Panoramic Spherical Photogrammetry (PSP) solves the first step of acquisition; the spatial database collects and organizes all the information in a structural way producing some reports.
The other improvement is the export of the database in a desktop Geographic Information System, to localize on the world satellite map the AH data and to display the related data sheet or multimedia data, activating some hyperlink. Final it is good the dissemination on Web.
Our research will focus on development of methods and technologies for construction of libraries of 3D digital models representing architectural artifacts in order to have access to information in real time on off-line or web-based systems. Analyzing different scenarios, satisfying standard and quality
requirements, developing procedures, we provide the integration of different types of data and the knowledge of the selected artifacts.
The Panoramic Spherical Photogrammetry (PSP) seems to satisfy many requirements to collect in fast and simple way a lot of AH. It is a new photogrammetric technique for architectural recording very low-cost. It provides panoramic images with great resolution, (much larger than any commercial camera), distortion-free, wide Field of View (up to 360°), reducing drastically the amount of the traditional photogrammetric models, which are necessary to do a 3D surveying (Fangi, 2010).
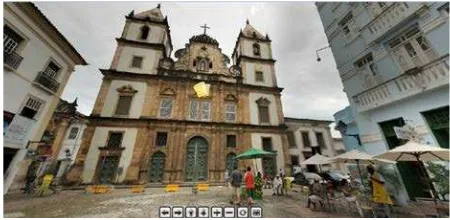
There are several advantages to using panoramic images. One of these is that a spherical panorama, even a partial one, normally having a larger field of view, allows a better comprehension of the object and it needs a smaller number of images. This is evident in indoor applications but it is also present outdoors, where only a portion of the 360° panorama is covered (Figures 2, 3). In addition, a wider field of view allows the operator to get closer to the object and resulting in a larger photo scale.
Figure 2. Example of outdoor spherical panorama: Igreja de Nossa Senhora da Conceição da Praia, Bahia.
Figure 3. Examples of indoor spherical panoramas: Igreja de Nossa Senhora da Conceição da Praia, Bahia.
In general, panoramic images look impressive, but to be suitable for measurement they must fulfill some rigid geometric conditions (Fangi 2007). The PSP works by means of an analytical approach based on spherical images to realize 2D and 3D CAD Modeling products (Figure 4).
In this last decade many architectural heritage have been documented by this approach with good accuracy and many details, in every parts of the World (Fangi et al., 2012; Pisa et al., 2010).
For this reason we have decided to organize the achieved data by means a basic database to retrieve quickly the information, useful for different purposes: historical analysis, architectural knowledge and promotional aspects.
Figure 4. CAD 3D wireframe model of the Igreja de Nossa Senhora da Conceição da Praia, Bahia.
According to the philosophy to use as soon as possible low cost or well known solutions we implement the database core in Microsoft Access. This platform is useful and simple to manage a lot of records, each of these is referred to a single object characterized by many attributes/features.
The Access table is not the only product but it is possible to produce a report in form of data sheet, which summarizes, in organized manner, some distinctive features, useful for the knowledge of the object. Unfortunately, this tool has not a mapping support, so it needs to transfer the table, like a text, in an open source GIS environment. Between the open source software with much more performances now Quantum GIS (QGIS) is the top. QGIS is a cross-platform free and open source desktop GIS application that provides data viewing, editing, and analysis capabilities.
Gary Sherman began development of Quantum GIS in early 2002, and it became an incubator project of the Open Source Geospatial Foundation in 2007. QGIS allows the use of shape files, coverage, and personal geo-database. Web services (including Web Map Service and Web Feature Service) are also supported to allow to use the data from external sources. It has a big community of developers and users which can provide new releases and new advanced skills. The queries and the actions manage the choice of the information and allow the display, by hyperlink, of documents and multimedia contents.
3. A BASIC AH DATABASE IMPLEMENTATION
This research, how we told above, sets the objective to create an Architectural Heritage (AH) cataloguing by means of an Information System (IS), to access, in simple way, to different types of multimedia contents (images, drawings, 3D geometric models, animations, videos, descriptions,
localization, and so on) by a database.
The knowledge and the documentation are essential and very important to protect and to promote the AH in general. The cataloguing in standard format of every available data allows deciding the priorities and the type of actions for the monument maintenance and restoration. We give an example of a dedicated IS, collecting and organizing several kinds of documents.
3.1. Database collection and organization: the Object Table
The correct design of the database is essential to solve the required goals. The database design process consists of the following steps: to determine the purpose of the database, to find and organize all the required types of information, to divide them into tables, to identify the list of each item characterizing the subject (a potential field in each table), to select a field like primary key, to identify uniquely each subject (record in the table). Even if this list is not complete, it is a good starting point and you can continue to refine it up to a better design.
The use of the software Microsoft Access allows to organize complex and basic database based on a conceptual model, easy to manage, that can produce a report in automatic way too.
Once chosen the aim, the subjects and the related items, we organized, by Microsoft Access, the information into a simple basic database, made of only one table: list of rows (records) and columns (fields).
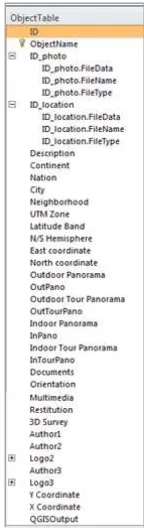
The Object Table (Figure 5)is built by these elements and stores all the collected data. The fields describe many characteristics of each object stored in each record, using different format such as text, number, date, hyperlink and attached file.
Figure 5. The Object Table items (fields)
name; Description; Localization (Continent, Nation, City, and so on); different types of Coordinates (latitude and longitude WGS84 and East, North UTM – WGS84); link to the products (panoramic images, drawings, multimedia contents) stored into a relative file path; participants (Authors) to the database project; customization to export the table in QGIS and other features.
The database implementation won’t redundant data, because it wastes space, increases the likelihood of errors and inconsistencies; but, on the other hand, it requires the correctness and completeness of information.
Every investigated architectural heritage was stored in each record of a unique table and consequently the possible type of relationship is one-to-one, recording some special information applied to a specific product, so the table share a common column or columns, useful to search, in a simple query, the information.
Once generated the Object Table, the fields of each record were populated with the information, satisfying as soon as possible the set of items in each column (Figure 6). Then it will be possible to create queries, add new records, manage the information and so on.
Figure 6. Some records of the Object Table
3.2. The data report: the Object Form
The database keeps a list of customer information for the purpose of producing reports. In fact another stage in Microsoft Access is to design the report in relation to the items that you want place on it, creating some captions to identify them. It is a good thing to construct a report or output listing because you have an overview of the database in descriptive form to share it in different ways.
The Object Form is the tool that allows to organize the items of the Object Table in specific boxes to obtain a descriptive data sheet. A data sheet is made of controls, such as text boxes, display data, other decorative elements, such as separator lines or company logos. A page may contain several headings grouping data. You can view the Object Form structure related to our research project in Figure 7.
Arranged the database, the use of the Object Form summarizes and displays the data in form of report or data sheet. It’s much easier to create meaningful reports if the database has a well-designed table structure and relationships.
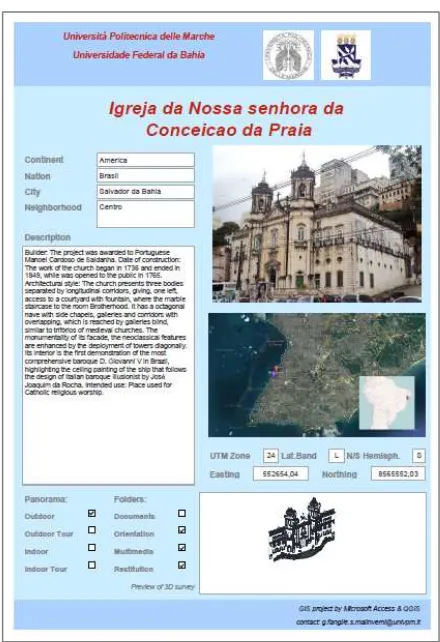
A big opportunity is that the report is filled automatically, retrieving the information from the Object Table fields and displays them in an attractive and informative layout for
printing or viewing on screen (Figure 8). It can be updated immediately when you update the Object Table fields. Grouping and presenting data in many different ways makes it a meaningful tool.
Reports provide a way to distribute or archive snapshots of your data, either by being printed out, converted to PDF or XPS files, or exported to other file formats suitable for the web sharing, such as XML files.
Figure 7. The Object Form structure
Figure 8. The report in form of data sheet summarizes the information of an architectural heritage stored in the database
4. QUANTUM GIS TOOLS TO MAP AN AH
datum.
Georeferencing the AH allows to acquire their relationships with the environmental and human elements, and with the other heritage goods close to it, offering the best and the most aware knowledge of themselves. These particular requirements are satisfied by means of a GIS.
4.1 Hyperlink for report visualization
When the architectures are diffused in the territory and relatively accessible, in so large amount, GIS is the better way to display geographically an AH data collection, manage it by the experts or to introduce it to the community, allowing the information retrieving.
We uploaded Access database in QGIS, which stores the attribute table, localizes the objects by the Coordinate fields and uses the QGISOutput field to link to the data sheet or to virtual panoramic tour (Figure 9) to know and explore the places (Figure 10).
Figure 9. Hyperlink action to retrieve the data sheet in the GIS database
The virtual panoramic tour is a simulation of an existing location, usually composed of a sequence of images, sometimes adding other multimedia elements such as sound effects, music, narration, and text (by hotspot connection). The starting point necessary to create the virtual panoramic tour is the same panorama at 360°, used for the PSP processing.
Figure 10. Virtual panoramic tour joints the data sheet (by hotspot connection) stored in the GIS database
In addition to its great potential for visual exploration of monuments and historic sites, the sense of immersion that this kind of resource provides combining a high level of detail and realism, the panorama can be used as a powerful interface to show multimedia data related to the displayed objects in the scene. All this can be done according to levels of information previously selected for different types of users.
Using specialized photo stitching software such as PTGui and managing the panorama by Pano2VR (GardenGnome), we created some media rich virtual panoramic tours. For most business purposes, a virtual panoramic tour should be accessible everywhere. The major solution is a web-based virtual panoramic tour.
5. THE DATA DISSEMINATION ON WEB
Maybe the most important factor for the protection and preservation of the monuments is the recognition of their value by the local people. And so people assign value to the monument, you need them to know you and know your history.
Nowadays, the best way to promote the knowledge of the cultural heritage is using the web applications. So, the dissemination of the monuments’ information is an essential part of this project, once this diffusion of the cultural heritage contributes widely for its recognition and value assignment. This way, the historical sites of Lençóis and Rio de Contas, have their own websites, respectively <www.projeto.lencois. ufba.br> and <www.acervoriodecontas.ufba.br>, where each registered user can navigate inside the multimedia database and download the files they want. The social network age and the spread of the communication on web have made possible to share massive data directly on-line.
Regardless of immediate applications that led to the execution of the survey, once data is produced, it needs to be indexed, stored and preserved for later use. And to ensure that these data can be used effectively they must be disclosed, published and retrieved. That closes the cycle that encompasses planning, gathering, processing, indexing, storage, publication, dissemination, retrieval and use of data and information on buildings and architectural ensembles.
Information which in turn will influence the conservation and interventions on these sites by generating a new cycle of documentation, to be repeated indefinitely throughout the lifetime of the building and sometimes even after their destruction.
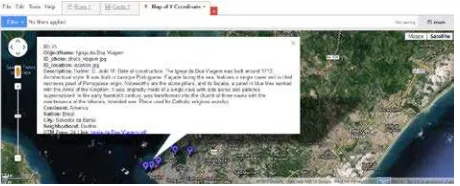
In this new approach, the final result of this research is related to the dissemination of the AH database by means of the Google platform. At the moment we have tried to use an experimental data visualization web application to gather, visualize, and share bigger table data on-line: Fusion Tables (Google Drive environment) (Figure 11).
We have uploaded the data table from spreadsheet or CSV file and then filtered and displayed it on satellite map; successively we shall customize the layout according to ours necessity.
All the data are stored in Google Drive or it will be possible to use other web spaces. The updating of any new table is very easy by means of the merge function that generates a single visualization including both sets of data and showing the latest value too. The Google platform makes the data on a map immediately: points, lines, polygons, customer addresses, place names, countries and more can be mapped automatically by means the location data stored in the fields of the table.
data online are reflected in Google Earth and share it to the community. The data can be shared at different levels and discussed with others, or to find public data combining with yours for a better visualization of all information in one place.
You can share only what you want, keeping some of your dataset private and publishing a subset of rows or columns according to own share permissions. This makes it a powerful tool when you want to diffuse and promote the knowledge of the building heritage on the World. It is as a big community that works together.
Figure 11. Dissemination on web by Fusion Tables in Google
CONCLUSIONS
As explained here, the documentation process for architectural and urban sites, because of the amount of variables involved and resources allocated is a complex and multidisciplinary activity, involving traditional disciplines such as architecture, design, survey methods, history and art history and strongly combining digital microelectronics, computer science and information science, involving significant technological, financial and human resources.
The documentation can’t protect physically the buildings, but can provide information for their restoration in case of any accident. However, in case of the building being completely wracked, the multimedia database could preserve its memory for the future generations and educational purposes.
Finally, with this public divulgation of this architectural heritage database, we hope to contribute for historical sites preservation by promoting the knowledge about them. The valorization of these urban sets is an effective way to protect them and call the attention for the urgency of a heritage protection policy and the risk they are submitted continuously. By the end of this project, it is expected that all this data and information will be available at the project website on the internet.
REFERENCES
Amorim, A. L., 2007. Documenting architectural heritage in Bahia – Brazil, using digital technologies. In: Proceedings of XXI CIPA International Symposium “Anticipating the Future of the Cultural Past”, Athens (Greece), pp. 61-66.
Amorim, A. L., 2011: Methodological aspects of architectural documentation. In: Proceedings of XXIII International CIPA Symposium, Prague (Czech Republic).
BAHIA, Inventário de proteção do acervo cultural da Bahia. Monumentos e sítios da Serra Geral e Chapada Diamantina. v. 4. Salvador, 1980.
Fangi, G., 2007. The Multi-image spherical Panoramas as a tool for Architectural Survey. In: ISPRS International Archives, Vol. XXXVI, Part. 5/C53, CIPA Archives, Vol. XXI, pp. 311-316.
Fangi, G., 2010. Multiscale Multiresolution Spherical Photogrammetry With Long Focal Lenses For Architectural Surveys. In: ISPRS International Archives, Vol. XXXVIII, Part 5, pp. 228-233.
Fangi, G., Pierdicca, R., 2012. Notre Dame du Haut by Spherical Photogrammetry integrated by Point Clouds generated by Multi-view Software. International Journal of Cultural Heritage in the Digital Era, Vol. I, n. 3, pp. 461-478.
Gabrielli, M., Malinverni, E. S., 2007. Multimedia Database for the Heritage Information System of the Ancyra Project. In: Proceedings of XXI CIPA International Symposium “Anticipating the Future of the Cultural Past”, Athens (Greece), pp. 323-417.
Letellier, R., 2007. Recording, Documentation, and Information Management for the Conservation of Heritage Places: guiding principles. The Getty Conservation Institute, Los Angeles.