Measuring and modelling photosynthetically active radiation
in Tibet Plateau during April–October
qXianzhou Zhang
a,∗, Yiguang Zhang
a, Yunhua Zhoub
baCommission for Integrated Survey of Natural Resources, Chinese Academy of Sciences, P.O. Box 9717, Beijing 100101, China bInstitute of Geography, Chinese Academy of Sciences, Beijing 100101, China
Received 13 May 1999; received in revised form 12 December 1999; accepted 17 December 1999
Abstract
Based on the measured data of spectral solar radiation in Lhasa, Tibet from 15 April to 15 October 1994, the ratio of photosynthetically active radiation (PAR) to solar global radiation was presented, i.e.ηPAR=0.439±0.014, and 1 J energy of PAR is equivalent to 4.43mmol quantum. In the climatological estimation of Tibet Plateau, following equations can be used to estimate the daily total PAR energy flux density QPAR(MJ m−2per day) and daily total PAR photo flux density UPAR(mol photon m−2per day):
QPAR=(0.3914+0.0190 lnE∗) Q
UPAR=(1.7339+0.0842 ln E∗) Q
Here, Q (MJ m−2per day) is the daily global radiation. E*=E P0/P, E (hpa) is the water vapor pressure at site, P0(hpa) is the standard atmosphere pressure at sea level, P (hpa) is the atmosphere pressure at site. © 2000 Elsevier Science B.V. All rights reserved.
Keywords: PAR; Tibet Plateau; Solar radiation
1. Introduction
Photosynthetically active radiation (PAR) means the solar radiation in the waveband of 400–700 nm which can be absorbed by photosynthetic system of plants. McCree (1972) showed that the photon flux in this waveband was an accurate estimation of PAR for both natural and artificial sources. Incident PAR is
neces-q
Under the auspices of the National (G 1998040800) and CAS’ Key Project for Basic Research on Tibetan Plateau (KZ951-A1-204; KZ95T-05; KZ95T-06).
∗Corresponding author. Fax:+86-10-6485-4230.
E-mail address: [email protected] (X. Zhang)
sary in order to estimate the intercepted light for the purpose of modeling photosynthesis of single plant leaves or complex plant communities.
PAR is the general radiation term that covers both photon terms and energy terms. One is the photon flux density, UPAR, which is defined as the number of the incident photons in the waveband of 400–700 nm per unit time on per unit surface. The other is the energy flux density, QPAR, which is defined as the number of the incident energy in the same waveband per unit time on per unit surface. Generally, PAR are not mea-sured in routine observation but the PAR value is es-sential to analyze the plant growth and/or to evaluate the conversion from solar energy to chemical energy.
Therefore, the calculation of PAR is very important. PAR is calculated based on the ratio of PAR to the solar global radiation which can be taken as a con-stant. However, the ratio is not a same figure according to different authors (Moon, 1940; Yocum, 1964; Mc-Cree, 1966; Yocum et al., 1969; Szeicz, 1974; Briton and Dodd, 1976; Stanhill and Fuchs, 1977; McCart-ney, 1978; Ross, 1981; Stigter and Musabilha, 1982; Rodskjer, 1983; Howell et al., 1983; Rao, 1984; Kar-alis, 1989; Papaioannou et al., 1993). In fact, the ratio is influenced by meteorological factors and varies with time and site. Therefore, in order to calculate the ratio, it is necessary to establish a estimation model. Dif-ferent authors have studied in this respect (Zhou and Xiang, 1992; Alados et al., 1996; Zhou et al., 1996). The development of an appropriate model of the ra-tio could create a large data of solar global radiara-tion without the substantial cost in observation network, especially in Tibet Plateau.
Tibet Plateau is called the ‘Third Pole of the earth’ owing to its significant features, such as high altitude, thin air, good air transparency, strong solar radiation. The solar global radiation is much higher there than that of the plain areas. The solar energy resource ranks the second in the world, only next to the Sahara Desert, so it is very significant and useful to study the solar ra-diation and its spectral characteristics in Tibet Plateau. In the Tibet Plateau, the spectral measurements be-fore were not much and only focused on direct radi-ation (Tian et al., 1982). The purpose of this paper is to evaluate the relationship between PAR and so-lar global radiation in Tibet Plateau. Here we present the analytic results of spectral solar radiation on the basis of measurements recorded in Lhasa, Tibet, in-cluding its seasonal characteristics, the variations of the ratio of PAR to global solar radiation, the ratio weather-dependant function, estimation models of the PAR and the conversion coefficient from PAR energy to photon.
2. Materials and methods
The measurements were made at Lhasa Agroe-cosystem Research Station, Chinese Academy of Sciences (Lhasa, Tibet, 91◦20′ E, 29◦41′ N, 3688 m above sea level) from 15 April 1994 to 15 October 1994. Spectral solar radiation measurements were
carried out by six spectral radiometers: WG295 (292–3000 nm), GG400 (400–3000 nm), GG495 (488–3000 nm), OG530 (522–3000 nm), RG630 (627–3000 nm) and RG695 (693–3000 nm). GG400 is made in Jinzhou 322 factory in China. The others are Eppley Precision Pyranometers modeling PSP with outer domes of Schott filter glass made in Amer-ica. The instruments are fixed at the meteorological observing site of Lhasa Agroecosystem Research Sta-tion, at 1.50 m above ground level and in a row from south to north without any shading each other. The output was recorded on a data logger made in Jinzhou in China and the sample was collected circulatively once every minute. The instrument exports hourly in-stantaneous and accumulative values from sunrise to sunset every day. Daily sums of these instantaneous measurements were used to calculate insolation.
In order to determine the instrument sensitivity, the filter covers’ transparency and instrument’s sensitivity were comparatively standardized in plain area (Bei-jing, China) and Tibet Plateau (Lhasa). The sensitivity of the spectral radiometer is standardized by standard direct radiometer with plane filter. The glass model of the filter should be as same as those of the semispher-ical covers. That is to say the determination method of instrument sensitivity is ‘shading light method’ with a gobo.
3. Results and discussion
3.1. Distribution characteristics of spectral radiation energy during growing season (April–October)
For convenience,ηλis taken to express the relative flux density of spectral radiation. It is the ratio of Qλ (the solar radiation flux density with wavelength less thanλ) to Q (the total global solar radiation flux den-sity), i.e.ηλ=Qλ/Q. Thus, the relative flux density of spectral radiation in waveband ofλ1−λ2(η1λ) is η1λ =
Q1λ
Q =ηλ1−ηλ2 (1)
η1λcan be used to assess the changing characteristics of spectral radiation energy.
Table 1
Monthly average of dailyη∆λ, relative flux of spectral radiation
Color 1λ(nm) η1λ(%) Average
April May June July August September October
UV 292–400 5.6 6.0 6.4 5.6 5.5 4.7 3.2 5.3
Blue-violet 400–488 14.8 14.5 14.7 15.0 15.7 14.9 14.8 15.0
Green 488–522 5.5 5.7 5.5 5.5 5.1 6.2 6.5 5.7
Yellow-orange 522–627 16.9 16.9 16.9 16.8 17.5 17.7 16.3 17.0
Red 627–693 4.9 5.2 5.3 5.1 5.3 5.4 5.1 5.2
IR 693–3000 52.2 51.2 51.8 51.9 50.9 51.0 54.1 51.8
of spectral radiation during growth season are: UV (292–400 nm) 5.3%, blue-violet light (400–488 nm) 15.0%; green light (488–522 nm) 5.7%; yellow-orange light (522–627 nm) 17.0%; red light (627–693 nm) 5.2%; IR (693–3000 nm) 51.8%.
It is obvious that η1λ of spectral radiation during growth season are various. Which is relevant to the monthly changes of the solar elevation, cloud amount, and water vapor content in the air and needs further research.
3.2. Estimation model of energy flux density (QP AR)
of PAR
From the using the measured data of spectral radi-ation, the daily PAR can be estimated and the estima-tion models of PAR are established.
Put QPAR (MJ m−2per day), the solar radiation of the waveband of 400–693 nm, and total solar radiation
Q (MJ m−2per day) in the following equation:
QPAR=ηPAR×Q (2)
HereηPARis the PAR coefficient. It should be pointed out that the coefficient is not a constant but varies slightly with site, season and weather conditions.
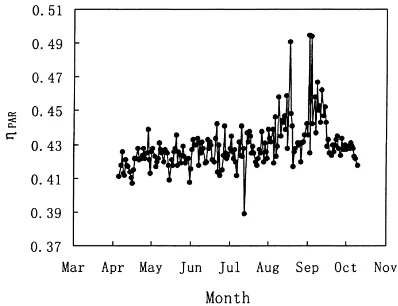
Fig. 1 illustrates the variation of daily ηPAR in Lhasa. The average ηPAR value with standard devia-tion is 0.429±0.013, and the variation coefficient is 3.0%.
As mentioned earlier, ηPAR fluctuates with the changes of meteorological elements. It can be esti-mated from the following empirical equation:
ηPAR=a+blnE∗ (3)
Here, E*=E×P0/P, is the daily average value of water vapor pressure at site. In the observing period,
E is in the range of 2.4–12.2 hpa in Lhasa in 1994. P0 is the standard atmosphere pressure at sea level (1013 hpa). P is the daily average value of atmosphere pressure at site, a and b are all statistical coefficients:
a=0.3822, b=0.0186 (see Fig. 2).
Fig. 1. The variation of dailyηPARin Lhasa, Tibet in 1994.
Fig. 2. The relationship between the dailyηPARand E∗in Lhasa,
It should be pointed out that due to the limita-tion of the instrument, the observed PAR waveband is 400–693 nm in Lhasa, while the usual waveband adopted internationally is 400–700 nm. This small difference in wavebands bring systematical errors of ηPAR. In order to compare with those in other areas, our data from Tibet Plateau were corrected to stan-dard waveband. The PAR irradiances in the waveband of 400–693 nm and 400–700 nm were set as Q1PAR and Q2PARrespectively. Thenκ can be determined as follows:
κ =Q2PAR
Q1PAR
(4)
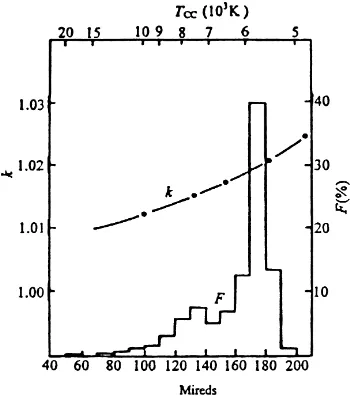
Obviously,κ is related to the spectral structure of so-lar radiation, i.e. relevant to observation time, site, season and weather conditions. In order to obtain an average value, κ, daylight spectral data (Judd et al., 1964) adopted by CIE were used to calculate theκ at different correlation color temperature Tcc. From the distribution graph of Tccfrequency (F) on the basis of observed data all over the world (Zhou et al., 1996), κ can be obtained from the following formula:
κ =6(κF )=1.024 (5)
Fig. 3 shows the relationship of F, Tcc and κ. To make the temperature abscissa convergent fast, the
Fig. 3. Relationship between correction coefficientκ, distribution frequency F and correlation color temperature Tcc.
temperature reciprocal (common in chromatology) is used as abscissa. The temperature reciprocal is de-fined as the reciprocal of Tcc,whose unit is Mireds (1 Mireds=106/Tcc, the unit of Tcc is K).
Strictly speaking,κcalculated in Eq. (5) is not nec-essarily suitable to Tibet Plateau. Fortunately,κis very little value and only varies slightly with Tcc. Therefore, κ as a climatological correction coefficient doesn’t bring about a big error in the results. So from Eqs. (4) and (5), Eq. (6) can be obtained:
Q2PAR=1.024×Q1PAR (6)
By Eq. (6), the spectral radiation in 400–693 nm can be corrected to that in 400–700 nm, the standard wave-band. After correction, the daily averageηPAR value with standard deviation change into 0.439±0.014, the two empirical coefficients a and b change to 0.3914 and 0.0190 in Eq. (3) in Lhasa. It is reported that the observed ηPAR value from April to October in Bei-jing is 0.48 (Zhou et al., 1996), the averageηPAR at Yucheng in Shandong Province, China, is 0.45 (Zhou and Xiang, 1992). They all prove the fact thatηPARin Tibet Plateau is not higher than that in plain areas, al-though the solar radiation is stronger and PAR energy flux density is higher in Tibet Plateau.
By the combination of Eqs. (2), (3) and (6), the climatological estimation model of the daily QPAR (MJ m−2per day) can be obtained:
QPAR =(0.3914+0.0190 lnE∗)Q (7) Here, Q is the daily solar global radiation (MJ m−2 per day).
3.3. Estimation model of photon flux density (UP AR)
of PAR
There are somewhat inherent relationship between
UPAR and QPARwhich could be described by the fol-lowing equation:
UPAR=u×QPAR (8)
Here, u is the quanta number in per unit PAR energy and defined as the quantum conversion coefficient with the unit ofmmol photon J−1.
Supposing a monochromatic light with wavelength λ, uλ, the quanta number per unit energy, is λ/Nhc.
is 6.626×10⁻³⁴J s, the Planck constant, and c is 2.998×1014mm s−1, the light velocity.
For the incident solar global radiation down to the ground, u can be expressed by the following equation:
u= UPAR
Here, Qλis the spectral irradiance. In calculation, Eq. (9) can be written in the other form:
u= UPAR the mean wavelength in the waveband,κis the divided waveband number of PAR.
In our spectral measurement of solar global ra-diation in Lhasa, the waveband 400–693 nm was divided into four parts: 400–488 nm, 488–522 nm, 522–627 nm and 627–693 nm. That is to say κ=4, λ1=444 nm, λ2=505 nm, λ3=575 nm, λ4=660 nm,
Q1λ1=Q400−Q488, Q1λ2=Q488−Q522, Q1λ3=Q522
−Q627, and Q1λ4=Q627−Q693. Here, Q400, Q488,
Q522, Q627 and Q693are the spectral irradiance radi-ation at the wavelength from 400, 488 522, 627, and 693 to 3000 nm, respectively. u can be obtained in the following equation:
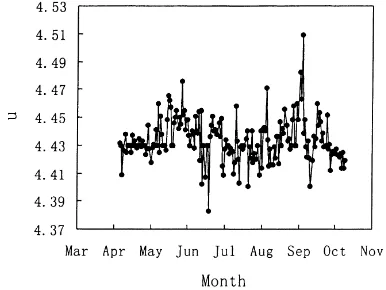
Using the measured data of spectral radiation in Lhasa, Tibet, u can be easily calculated with Eq. (11). In cal-culating, the daily values were used. The results show that the daily value u are very close to each other (Fig. 4). The average value u and standard deviation is 4.43±0.016mmol photon J−1with variation coeffi-cient 0.4%. This means that in April–October in Lhasa, a constant PAR quantum conversion coefficient i.e.
u=4.43mmol photon J−1can be used to convert PAR energy into quantum. In plain areas, McCree (1972) reported that the ratio of the photon flux to the en-ergy flux was 4.57mmol photon J−1, approximately 3% higher than that u in Lhasa, Tibet Plateau.
With the combination of Eqs. (7), (8) and (11), the climatological estimation model of the daily total PAR
Fig. 4. The variation of daily average u values in Lhasa, Tibet in 1994.
quantum UPAR(mol photon m−2per day) can be de-termined:
UPAR=(1.7339+0.0842 lnE∗)Q (12) Here, Q (MJ m−2 per day) is the daily solar global radiation.
4. Conclusions
From the measurement of spectral solar radiation in Lhasa, Tibet in the period of April to October in 1994, the relative flux densities of different wave-bands of solar global radiation can be calculated. The PAR coefficientηPAR, the ratio of PAR energy to the solar global radiation, is a very important parameter to determine the energy flux density. According to the observed data, its average value is 0.439, which is not higher than that in plain areas although the solar radi-ation in Tibet Plateau is much stronger. In Lhasa, the energy of 1 J of PAR is equivalent to about 4.43mmol quantum. With climatological calculation and anal-ysis, this value would be very useful in conversion between energy and quantum in Tibet Plateau. The statistical models of energy flux density (QPAR) and photo flux density (UPAR) were set up respectively.
References
Briton, C.M., Dodd, J.D., 1976. Relationships of photosynthetically active radiation and shortwave irradiance. Agric. Meteorol. 17, 1–7.
Howell, T.A., Meek, D.W., Hatfield, J.L., 1983. Relationship of photosynthetically active radiation to shortwave radiation in the San Joaquin Valley. Agric. Meteorol. 28, 157–175.
Judd, D.B., Mac Adam, D.L., Wyszecki, G., 1964. Spectral distribution of typical daylight as a function of correlated color temperature. J. Opt. Soc. Am. 54, 1031–1040.
Karalis, J.D., 1989. Characteristics of direct synthetically active radiation. Agric. For. Meteorol. 48, 225–234.
McCartney, H.A., 1978. Spectral distribution of solar radiation Part II. Global and diffuse. Q.J.R. Met. Soc. 104, 911–926. McCree, K.J., 1966. A solarimeter for measuring photo
synthetically active radiation. Agri. Meteorol. 3, 353–366. McCree, K.J., 1972. Test of current definitions of
photo-synthetically active radiation against leaf photosynthesis data. Agric. Meteorol. 10, 443–453.
Moon, P., 1940. Proposed standard solar radiation curves for engineering use. J. Franklin Inst. 230, 583–618.
Papaioannou, G., Papanikolaou, N., Retails, D., 1993. Relation-break ships of photosynthetically active radiationand shortwave irradiance. Theor. Appl. Climatol. 48, 23–27.
Rao, C.R., 1984. Photosynthetically active components of global solar radiation: measurements and model computations. Arch. Meteorol. Geophys. Bioclim. Ser. B 33, 89–98.
Rodskjer, N., 1983. Spectral daily insolation at Uppsala, Sweden. Arch. Meteoro. Geophys. Bioclim. Ser. B 33, 89–98.
Ross, J., 1981. The Radiation Regime and Architecture of Plant Stands, W. Junk. The Hague.
Szeicz, G., 1974. Solar radiation for Plant growth. J. Appl. Ecol. 11, 617–636.
Stanhill, G., Fuchs, M., 1977. The relative flux density of photosynthetically active radiation. J. Appl. Ecology. l4, 317– 322.
Stigter, C.J., Musabilha, V.M.M., 1982. The bonservative ratio of photo synthetically active to total radiation in the tropics. J. Appl. Ecology 19, 853–858.
Tian, G., Lin, Z., Wu, X., 1982. Some characteristics of ultrariolet visual and infra-red radiation in eastern Tibet during the growing season, Acta Meteorologica Sinica 40 (3), 344–352 (in Chinese with English abstract).
Yocum, C.S., Allen, L.H., Lemon, E.R., 1969. Photosynthesis under field conditions Part VI. Solar radiation balance and photosynthetic efficiency. Agron. J. 56, 249–253.
Yocum, C.S., 1964. Photosynthesis under field conditions VI. Solar radiation balance and photo synthetic efficency. Agron. J. 56, 249–253.
Zhou, Y., Xiang, Y., 1992. Measurement and empirical estimate of photo synthetically active radiation. J. Chinese Geogr. 3 (1), 55–71.