i
THESIS – PM 147501
SERVICE QUALITY ANALYSIS AND
IMPROVEMENT OF PURCHASING DEPARTMENT
IN OIL AND GAS COMPANY (CASE STUDY: PT.A)
Hendra Wahyudi
Student ID. 9115 2017 14
Supervisor:
Dr. Ir. Bambang Syairudin, MT Dr. Ir. Fuad Achmadi, MSME
MAGISTER PROGRAM
MAJOR OF INDUSTRIAL MANAGEMENT
DEPARTMENT OF MANAGEMENT TECHNOLOGY
FACULTY OF BUSINESS AND MANAGEMENT TECHNOLOGY INSTITUT TEKNOLOGI SEPULUH NOPEMBER
ii
PREFACE
Praise and thanks to God Almighty for His plenty of grace and His guidance, so we can carry out this research and finish this thesis as expected and as good as possible.
This thesis is submitted to fulfill one of the requirements for master degree of Master Management of Technology with concentration in Management Industry in Institute Technology of Sepuluh Nopember (ITS) Surabaya. In this occasion, the writer would like to convey the gratitude for every people who have given their kind help in performing the research, they are:
1. Bapak Dr. Bambang Syairudin, MT, as the Advisor who has given his valuable time, feedbacks and guidance to finalize the thesis,
2. Bapak Dr. Fuad Achmadi, MSME, as the Advisor who has given his valuable time, feedbacks and guidance to finalize the thesis,
3. Ibu Dr. Endah Angreni, MT, as examiner of Thesis Proposal who has given their feedbacks to refine this thesis,
4. Ibu Dyah Santhi Dewi, MSc, PhD, as examiner of Thesis Proposal who has given their feedbacks to refine this thesis,
5. Bapak Dr. Ir. Mokh. Suef, MEngSc, as examiner of Thesis who has given their feedbacks to refine this thesis,
6. Bapak Dr. Ir. Bustanul Arifin Noer, MSc, as examiner of Thesis who has given their feedbacks to refine this thesis,
7. All Lecturers in MMT-ITS who have given all the supports and knowledge, 8. All MMT-ITS Academic team and Librarian, who have given the writer the
assistance in administration side,
9. All colleagues in MMT-ITS especially Balikpapan Batch 4, who have given the writer the encouragement and support,
iv
11. Mr. Hadi Wahyudi, my father, Mrs. Laniwati, my mother, who always give the writer her best supports,
12. Mrs. Mariyana, my wife, and Valerie Ava, my daughter, who always give me their patience and their best supports,
13. And all other person who cannot be said one by one who have given the writer the assistance and helped until finishing process.
Finally, the writer realizes there are unintended errors in writing this thesis. The researcher really appreciates all readers to give their suggestion to improve its content in order to be made as one of the good examples for the next thesis.
Balikpapan, April 2017
vi
ABSTRACTS
PT. A is the Oil and Gas Company operated in Indonesia, works with the supplier to do the operations thru contracts agreement. The user, who uses the contract thru Contract and Procurement Division, drive the needs of the service or material. C&P Division objective is to satisfy the users thru the statement: "To provide Goods and Services at optimal cost, in order to achieve effective, efficient operations and customer satisfaction". Refer to the Customer Satisfaction Survey; Purchasing Department's service quality is 68%, therefore this study intends to analyze and to improve Service Quality of Purchasing Department.
In this research, there are 3 top biggest gaps effecting the users' satisfaction that identified: The procurement process already included in the business framework; Knowledge on Know-How on the operation in OG applied in the procurement process; Fastest procurement lead-time. To improve the gap that identified, there are 11 technical response as priority that potentially bring up service quality satisfaction, such as: Conduct regular DUET meeting, Review of purchasing objective, Clear specification of PR, Conduct C&P staff competency assessment, Socialization of related regulation, Sharing Knowledge (Contact), Enhance Procurement Compliances, Survey/Visit Field/Workshop/Supplier premises, Issue procurement planning, Regular training for Purchase Engineer, Utilize and enhance REX+, Ensiklo. After having the technical response priorities, using Altshuller’s principles, to improve the technical response, considering the aspect of improving and worsening from those Altshuller’s principles.
These actions plan for improvements are recommended to be implemented and to be closely monitor and recommence to its objective, in order to improve the Service Quality of Purchasing Department.
CONTENTS
PREFACE ... iii
ABSTRACTS ... vi
CONTENTS... vii
LIST OF FIGURES...11
LIST OF TABLES ...12
CHAPTER 1 ...14
INTRODUCTION...14
1.1. Background ... 14
1.2. Problem Identification ... 20
1.3. Research Objectives ... 20
1.4. Research Benefit... 21
1.5. Research Scope ... 21
1.6. Thesis Organization ... 22
CHAPTER 2 ...24
LITERATURE REVIEW ...24
2.1 Oil and Gas Operations ... 24
2.1.1 Drilling Operation ...24
2.1.2 Production operations ...26
2.1.3 From Production to Sale ...26
2.2Contract and Procurement ... 27
2.2.1 Supply Chain Management ...27
2.2.2 Purchasing ...29
2.3Research Theory ... 34
viii
2.3.2 SERVQUAL Method ...38
2.3.3 QFD Method...43
2.3.4 TRIZ (Theory of Inventive Problem Solving) ...47
2.3.5 Correlation TRIZ and QFD ...53
2.2 State of Art on Previous Research ... 53
CHAPTER 3 ...61
RESEARCH METHODOLOGY ...61
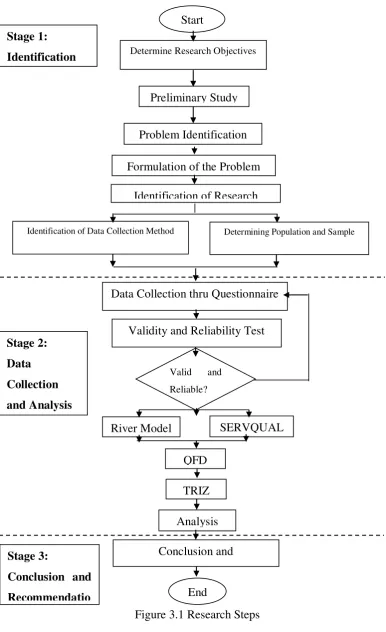
3.1. Research Steps ... 61
3.2 Stage 1: Identification ... 63
3.3. Stage 2: Data Collection and Processing ... 67
3.3.1 Data Collection and early Processing ...67
3.3.2 Validity and Reliability Test ...68
3.3.3 River Model ...68
3.3.4 QFD ...73
3.3.5 Construction of House of Quality (HoQ) ...76
3.3.6 TRIZ ...79
3.4. Stage 3: Analysis and Conclusion ... 82
CHAPTER 4 ...84
ANALYSIS AND DISCUSSION ...84
4.1Validity and Reliability test ... 86
4.2ServQual Analysis ... 90
4.3 River Model ... 93
4.4 Quality Function Deployment (QFD) ... 99
4.4.1 Identify the Voice of the Customer ... 100
4.4.2 Determine the level of importance of service attributes ... 101
4.4.4 Determine the relationship between voice of customer and technical
response ... 102
4.4.5 Determine the relationship of technical response ... 102
4.4.6 House of Quality (HoQ)... 103
4.4.6.1 Analysis Importance of Customer ... 104
4.4.6.2 Analysis of Technical Correlation ... 105
4.4.6.3 Analysis Voice of Customer with Technical Response ... 106
4.4.6.4 Analysis of the Result House of Quality ... 106
4.5 TRIZ ... 108
4.5.1 Preliminary Improvement ... 110
4.5.2 Impact of the Improvement ... 111
4.5.3 Contradiction based on TRIZ Inventive Principles ... 113
4.5.4 Proposal of Improvement using TRIZ based on Inventive Principles ... 114
4.5.4.1 Conduct regular DUET meeting ... 114
4.5.4.2 Review of Purchasing Objective ... 115
4.5.4.3 Clear specification of PR ... 115
4.5.4.4 Conduct C&P staff competency assessment ... 116
4.5.4.5 Socialization of Related Regulation ... 117
4.5.4.6 Sharing Knowledge (Contact) ... 117
4.5.4.7 Enhance Procurement Compliances... 118
4.5.4.8 Survey/ Field Visit /Workshop/Supplier premises ... 119
4.5.4.9 Issue Procurement Planning ... 120
4.5.4.10 Regular training for Purchase Engineer ... 121
4.5.4.11 Utilize and enhance REX+, Ensiklo ... 122
CHAPTER 5 ... 124
x
5.1 Conclusion ... 124
5.2 Recommendation ... 127
REFERENCES ... 129
APPENDIX 1 – RIVER QUESTIONNAIRE ... 132
APPENDIX 2 – SERVQUAL QUESTIONNAIRE ... 137
APPENDIX 3 – DATA SUMMARY OF SERVQUAL_EXPECTATION ... 142
APPENDIX 4 – DATA SUMMARY OF SERVQUAL_PERCEPTION ... 144
APPENDIX 5– DATA SUMMARY OF RIVER MODEL_TARGET... 146
11
LIST OF FIGURES
Figure 1.1 Organization Contracts & Procurement Division ... 15
Figure 1.2 Supply Chain Fundamental in PT. A ... 16
Figure 1.3 Purchasing Activities in PT. A ... 16
Figure 1.4 Satisfaction Survey of Purchasing Department ... 18
Figure 1.5 Global objective of Purchasing Department in PT. A ... 18
Figure 2.1 Rotary drilling and mud system ... 24
Figure 2.2 Well with four casing strings ... 25
Figure 2.3 Model of Supply Chain Management (Mentzer, et.al., 2001) ... 28
Figure 2.4 Conceptual model of Service Quality (Zeithaml, et al., 1990) ... 39
Figure 2.5 The Extended Gaps Model of Service Quality (Zeithaml, et.al.,1990) 42 Figure 2.6 House of Quality (Bernal, 2009)... 46
Figure 3.1 Research Steps ... 62
Figure 3.2 River Model ... 70
Figure 3.3 Gap Actual and Target of River Model... 73
Figure 3.4. HoQ general model ... 77
Figure 4.1 River Model KM Strategy of Purchasing Department ... 96
Figure 4.2 River Model Leadership of Purchasing Department ... 97
Figure 4.3 River Model Networking of Purchasing Department ... 97
Figure 4.4 River Model Learning of Purchasing Department ... 98
Figure 4.5 River Model Capturing of Purchasing Department ... 98
Figure 4.6 House of Quality ...103
12
LIST OF TABLES
Table 2.1 Buyer profiles and division of responsibilities (Van Weele, 2005)... 31
Table2.2Frameworks & Models for Knowledge Management Implementation . 36 Table 2.3 Systematic Innovation through TRIZ (Zhang, et al., 2003) ... 52
Table 2.4 Previous Researches ... 54
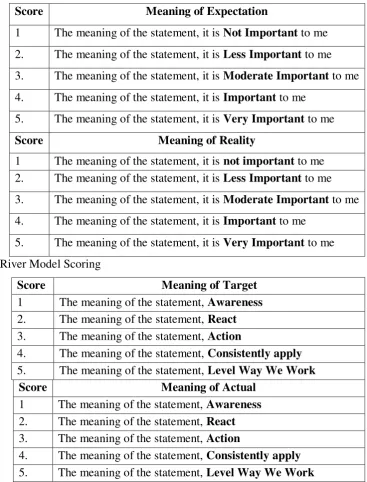
Table 3.1 Score use in the research. ... 66
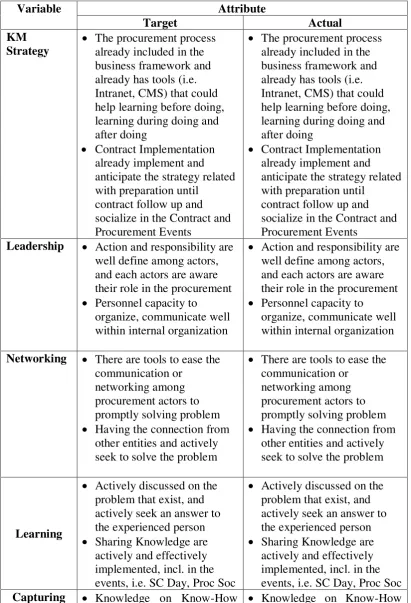
Table 3.2 Attribute KM River Model ... 69
Table 3.3 Evaluation Parameter for KM River Model ... 71
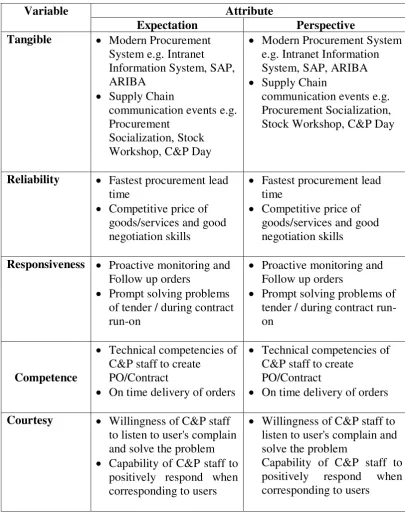
Table 3.4 Attribute SERVQUAL ... 74
Table 4.1 Pearson Product Moment (r) ... 86
Table 4.2 Validity and Reliability test of Expectation ... 87
Table 4.3 Validity and Reliability test of Perception ... 88
Table 4.4 Validity and Reliability test of Target ... 89
Table 4.5 Validity and Reliability test of Actual ... 90
Table 4.6 Distribution of answer from the Expectation... 91
Table 4.7 Questionnaires result of Expectation and Perception ... 92
Table 4.8 Distribution answer of the Target ... 93
Table 4.9 Distribution answer of the Actual ... 94
Table 4.10 Questionnaire result of the Target and Actual ... 95
Table 4.11 Questionnaire result of the River Model ... 96
Table 4.12 Variable Voice of Customer ...100
Table 4.13 Technical Response Attributes ...101
Table 4.14 Degree of Importance according to users ...104
Table 4.15 ABC classification based on HoQ result ...109
Table 4.16 Improving Feature ...110
Table 4.17 Worsening Feature...112
13
14
CHAPTER 1
INTRODUCTION
1.1.Background
Oil and gas activities are classified in two categories: upstream and downstream activities. Upstream activities can be defined as exploring, acquiring, drilling, developing and producing oil and gas reserves. They include all activities that lead oil and gas reserves to be processed from reserves in the ground to resources ready to be sold or used. Downstream activities refer to refining, processing, marketing and distribution.
PT. A is subsidiary company of Group Paris with operation site in East Kalimantan. PT. A supply more less 8% of oil needs in Indonesia in 2014,also supplying 32% of gas for Indonesia needs in 2014 (Perrine Toledano, Indonesia Associated Gas Utilization Study, 2015).
PT. A is the world's 5th ranked Oil and Gas Company (Company Internal Net, 2016). These companies explore oil and gas in 130 countries with production field in 30 areas such as North Sea, Africa, Middle East, Southeast Asia, North America, South America. PT. A has a contract with SKK Migas (Satuan Kerja Khusus Minyak dan Gas Bumi), the contract was build in Jakarta, August 1968 with the operation in Mahakam Area, East Kalimantan, Indonesia.
At the beginning, fields that owned by PT. A is Bekapai and Handil, then Tambora field was found in 1974 and Tunu in 1977. PT. A Indonesie not only produced crude oil but also produces gas that will be supply to Bontang directly via Senipah site.
15
Ordering services and goods and receiving them into inventory, but also making sure that they are delivered to the users at the right time.
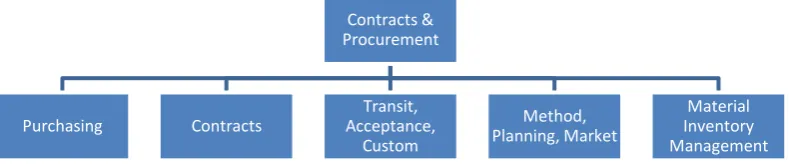
Figure 1.1 Organization Contracts & Procurement Division
All the Contract and Procurement activities are based on Company Regulation (CR) with its three main phases (Planning Phase, Procurement Phase and Commitment Follow-up). And in accordance to the Rule 1 of that CR, to respect the local rules and regulations, specific phase and methodology in the activities shall fully comply with the applicable guideline from the government, i.e. SKKMIGAS PTK 007 (Guideline to Contract and Procurement for Production Sharing Contract). C&P is only one actor in doing the Contract-Procurement process within the company. It can contribute as a co-responsible with other actors, namely: requesters, users, line management, government, and suppliers. But it cannot solve these problems alone. The exercise to be conducted actually is the interdependent search for a joint approach, to which everyone should contribute.
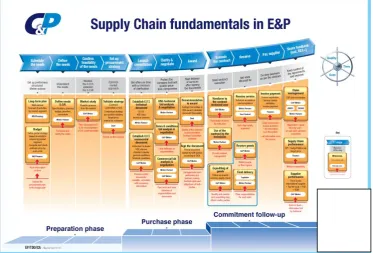
The supply chain process in PT A is defined in the main C&P rule as below figure.
Contracts & Procurement
Purchasing Contracts
Transit, Acceptance,
Custom
Method, Planning, Market
16
Figure 1.2 Supply Chain Fundamental in PT. A
Figure 1.3 Purchasing Activities in PT. A
Contract & Procurement Division involves the activity of planning, implementing, and controlling operations, which covers procurement of goods (C&P/PRC), contracting supply of services (C&P/CTC), development of methods and Contract & Procurement improvements (C&P/MPM), management of stock inventory (C&P/MIM), freight forwarding, importation operations (C&P/TCA). As shown in figure above, main works the Purchasing Department in Contract and Procurement Division to support the users are:
17
• To review the Statement of Requirement (SOR) and Scope of Work (SOW) to indicate into Instruction to Bidder (ITB) for the bidders in the tender preparation
• To monitor and follow up orders
• To negotiate on behalf of user on the purchasing
• To procure the material within the required time line, in the corridor of the regulation from the Government and Head Quarters
• To request for an approval to the authorities
• To expedited the delivery of material
• To review the performance of the vendors that supplied the material
18
Figure 1.4 Satisfaction Survey of Purchasing Department
Seeing from the Performance Monitoring data as figure above, and from the general feedback of users to management of C&P division during the Annual Performance review in, found that the Service Quality of the Contract & procurement division needs to be improved, especially for the Purchasing Lead Time, Delivery time of the vendor, quality of the material, best price can be obtained (especially in the environment of the low oil and gas price), simplicity but still comply with the regulation of the Company and Government.
Figure 1.5 Global objective of Purchasing Department in PT. A
19
that often occurs that would cause harm to the company and its supplier in the frame of time and costs, as well as the completion of quality deviations. In addition, it will also cause the decrease of credibility in front of the stakeholders. Delay is one of the biggest problems faced by the industry engaged in oil and gas due to material required in the oil and gas business is categorize as Long Lead Items (LLI), which caused by long manufacturing time, sometimes more than one year to make the material.
The problem of quality of material also found when the material delivered is not same as the Scope of Work; this will cause another delay to return the material, and may cause failure in the operation due to unavailability of the material.
Issues of competence and knowledge of the personnel in this case is Purchase Engineer (Buyer) which is owned by a team of Purchasing Department is also common, with frequent inaccuracy in identifying risk and mitigation in the contract and as well as having knowledge in the Statement of Requirement (SOR) may cause wrong purchasing of material.
Problems of high price of the material bought will cause the budget depleted before the fiscal year, and by this the purchased material will be less rather than required by the operation.
20
TRIZ (Theory of Inventive Problem Solving) to propose the solution as per required needs.
The results of this study are expected to be useful for improving the quality of service Procurement Department to the users, which can be identify in which services need to be improved and maintained so that users' expectations reached that will eventually be able to support the works in the completion of work on time, right cost and quality.
1.2.Problem Identification
Based on the description above background, the issues that will be discussed is a gap between the reality from the users of service from Contract & Procurement Division with the target needed, also the proposal of corrective action that should be done to improve the quality of services at the Contract & Procurement Division.
1.3.Research Objectives
The purpose of this study is as follows:
1. To identify the gap of service quality between target and actual services received in terms of five dimensions of quality: Tangible, Reliability, Responsiveness, Competence, and Courtesy.
2. To give priority based on category for the corrective measures to the problems encountered.
21
1.4.Research Benefit
The benefits obtained from this research are:
1. For the organization’s benefit, input to the management of Contract & Procurement Division regarding service quality given to its user and to give recommendation to improves its quality services
2. For academic’s benefit, this research will be useful to enrich knowledge on Service Quality in the Contract and Procurement sector pertinently in oil and gas industry considering there is a difference between the Contract and Procurement in manufacturing and the Contract and Procurement in Oil and Gas.
1.5.Research Scope
The limitation of this research will be as follow:
1. The research is conducted limited only to internal user of Purchasing Department within the Company of PT.A, in the working area of East Kalimantan, Indonesia.
2. Data and information is derived from the historical period 2014-2016.
3. Analysis of Knowledge Management Framework is using River Model, limited to KM Strategy, Leadership Behavior, Networking, Learning before, during and after, and Capturing Knowledge.
4. Analysis of SERVQUAL limited to Gap 5 is the gap between the expectations of consumers with the services received by consumers.
5. Analysis of Quality Function Deployment (QFD) is limited to Level 1 without derivatives.
22
1.6. Thesis Organization
Chapter outline used in this research consists of several chapters divided as follows:
CHAPTER I INTRODUCTION
This chapter described the basic things underlying this research such as; determining the root cause to be investigated, the purpose of the research and the benefits in terms of academic and organizational view.
CHAPTER II LITERATURE REVIEW
This chapter contains the theories used in the research. The theory is derived from a variety of sources such as scientific journals and books. CHAPTER III RESEARCH METHODOLOGY
This chapter elaborated the stages in conducting the research so that the process will be done in a good and systematic approach. The process starts from preliminary studies, literary studies, data collection, data processing, and elaboration of conclusions and recommendation.
CHAPTER IV ANALYSIS AND DISCUSSION
This chapter describes the process of data collection which will be used for the calculations in this research, analysis and evaluation of the results of the information obtained from data processing based on existing theory. Analysis carried out with the methods and tools used in this research. Also give the analysis about result from the previous chapter.
CHAPTER V CONCLUSIONS AND RECOMMENDATIONS
23
24
CHAPTER 2
LITERATURE REVIEW
2.1 Oil and Gas Operations
As specified, one of the scopes of the study is to analyze the Service Quality of the Purchasing Department in Drilling and Well Services needs for the material; therefore the preliminary literature review is on the drilling operations.
2.1.1 Drilling Operation
When an E&P company has identified an area with potential presence of oil and gas reserves, it will seek to acquire the right to explore, develop and produce the resources that might exist beneath the property, this is basically the right to share proceeds from the sale of any minerals produced.
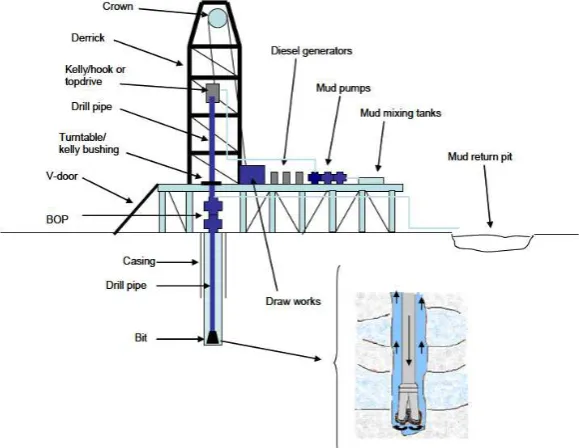
Figure 2.1 Rotary drilling and mud system
25
Figure 2.2 Well with four casing strings
Wells are nearly always drilled in stages. When the bottom of each stage is reached the newly drilled hole (“open-hole”) is cased off using steel pipe and becomes a “cased-hole”. This is done to prevent the hole from collapsing on top of the drill pipe. To “set” the casing, it is first lowered into the well. Then the drill-pipe is lowered (without a drill bit on the end) down inside the casing to the bottom, and is used to pump cement up the annulus between the outside of the casing and the hole. This cement sets and bonds the casing to the rock formation that has been drilled through. In this way then, the casing and cement together isolate different reservoirs from each other and from the surface.
26
define whether any oil or gas has been found. A device is lowered to the bottom of the well and then pulled back up to the surface. As the device passes up the well, it measure and records properties of the fluids in it. Based on those measurements, the well may be judged unable to provide oil and gas in commercial quantities. Then, it will be plugged and abandoned. Otherwise, it is completed and production may start. A well is deemed ready for commercial production if the expected net proceeds from production exceed the cost of completing the well.
2.1.2 Production operations
To complete a well and place it on production, the E&P companies should obtain and install production casing, install tubing, which consists in a steel pipe suspended in the well through which the oil and gas are produced, set off charges to create holes in the casing and cement to allow fluids to flow from the formation to the wellbore. Then, they will have to install a blow-out preventer (or Christmas tree) which is consists of valves and fittings that control production at the wellhead. Finally, the company will have to construct production facilities such as separators, tanks, heater-treaters and install flow lines.
2.1.3 From Production to Sale
27
2.2 Contract and Procurement
2.2.1 Supply Chain Management
Supply Chain Management defined as the systemic, strategic coordination of the traditional business functions and the tactics across these business functions within a particular company and across businesses within the supply chain, for the purposes of improving the long-term performance of the individual companies and the supply chain as a whole (Supply Chain Management at a Global Level – A Challenge and an Opportunity for Leading
Oil Field Service Company). Based on this definition can observed that the emphasis is not on simply minimizing cost or reducing inventories but rather on taking a systems approach to supply chain management as explained by
Simchi-Levi, et.al., (2003). Normally, several independent firms are involved in manufacturing a product and placing it in the hands of the end user in a supply chain—raw material and component producers, product assemblers, wholesalers, retailer merchants and transportation companies are all members of a supply chain.
Supply Chain Management defined as the systemic, strategic coordination of the traditional business functions and the tactics across these business functions within a particular company and across businesses within the supply chain, for the purposes of improving the long-term performance of the individual companies and the supply chain as a whole.
There are 3 degrees of Supply Chain Complexity: • Direct Supply Chain
It consists of company, supplier and customer that involved in upstream or downstream flow of product, service, finance and information.
28
It includes suppliers of the immediate supplier and customers of the immediate customer, all involved in the upstream and/or downstream flows of products, services, finances, and/or information.
• Ultimate Supply Chain
It includes all the organizations involved in all the upstream and downstream flows of products, services, finances, and information from the ultimate supplier to the ultimate customer.
Figure 2.3 Model of Supply Chain Management (Mentzer, et.al., 2001)
The connection or network between organizations is extensive, thus it is important to distinguish the resources flows of a supply chain, namely:
1) Material Flow
Material flow can be described as the way of a material from its production as raw material through the various stages of finishing up to the stage of end product, the use of the product, and its recovery to its disposal. All manufacturing supply chains have material flows from the raw materials at the beginning of the supply chain to the finished products at the end of the supply chain.
29
Throughout a supply chain there are abundance of information flows such as demand information, forecasting information, production and scheduling information, and design information flows. In contrast to the material flow, the information can flow both directions both upstream and downstream. Any supply chain will have its own set of information flows that are important to its existence.
3) Financial Flow
Financial flow is the flow of money in a supply chain, it is perceived as the blood stream of supply chain. Supply chain will collapse without this flow. The source of finance flow is the consumer. This understanding of single source of finance has led to a concept of “single entity” perspective of a supply chain, which is a very useful foundation for supply chain integration and collaboration. The distribution and sharing of this single financial resource fairly across a supply chain will allow for the better alignment between the contribution and reward for the participating companies. Hence, it can be concluded that supply chain is the network that consists of two or more separated organizations, being linked by material, information and financial flow.
2.2.2 Purchasing
30
Purchasing includes activities and events before and after the signing of a contract as well as the general management activities associated with a range of contracts (CIPS Australia Pty Ltd, 2005):
• Pre-contract activities such as planning, needs identification and analysis, and sourcing
• Post-contract activities such as contract management, supply chain management and disposal, and
• General activities such as corporate governance, supplier relationship management, risk management and regulatory compliance (CIPS Australia Pty Ltd, 2005).
CIP has identified seven core benefits of procurement (CIP Australia Pty Ltd, 2005):
• Security of supply
• Lower costs
• Reduced risk
• Improved quality
• Greater added value
• Increased efficiency
• Innovation
Thus it can be concluded that Purchasing has the linkage with:
1. Work activities (e.g. requirements determination, source selection) 2. Actors (e.g. market researchers, buyers)
3. Organizations (e.g. purchasing and contract management)
4. Technologies (e.g. electronic catalogues, communication networks) Cross-function, inter-organizational, and system are required to conduct the Purchasing process. As result, the view on that perspective allows one to approach the important aspects of organizations activities.
31
Table 2.1 Buyer profiles and division of responsibilities (Van Weele, 2005)
Function Responsibility
Corporate procurement Officer (CPO)
Developing corporate purchasing strategies, systems, reporting.
Corporate buyer Strategic commodities – large volumes, high investment projects and services. Responsible for developing sourcing strategy for key commodities. Long planning horizon.
Purchasing engineer New materials and components. New suppliers. Discussing specs, market research, selection of suppliers, negotiations. Work on decentralized level. Liaisons between purchasing and R&D.
Project buyer Similar to purchasing engineer but focus on equipment and services.
Material planner Materials planning and ordering, order handling – ensuring material supply, calling off materials against annual agreements. Vendor rating monitor and control supplier's quality and delivery performance.
MRO buyer MRO supplies – management of the entire assortment of MRO items with regard to overall performance rather than just price focused.
32
1. Support organizational goals and objectives
The most critical objective for purchasing is to support organizational aims. As this may seem obvious, the purchasing goals may not always in line with the organizational goals. For example, a firm might prefer exclusive partnership with a single supplier rather than selecting competitive quotations.
2. Develop integrated purchasing strategies that support organizational
strategies
Traditionally, purchasing has been long perceived as lower level function support and senior management has been slow to recognize the benefits of effective purchasing, which oftentimes purchasing function fails to design strategies that are aligned with the strategies of other function. However, this brings access to a pool of expertise and a source of market intelligence such as
a) Monitor supply markets
b) Monitor emerging trends in market
c) Identify critical materials needed to support company strategies d) Develop alternatives for ensuring supplies of key materials, and
contingency plans if there are problems with primary supplies e) Supporting the organization’s need for a diverse and globally
competitive supply base
3. Support operational requirements
In order to satisfy the needs of internal costumers, purchasing has to be managed efficiently. Thus, purchasing must assure a supply of materials by:
a) Buying materials from the right sources b) At the right price
c) With specification that meets user needs d) In the right quantity
33
4. Using purchasing resources efficiently and effectively
Since resources such as people, facilities, money, time, information, and knowledge are scarce, it is important to efficiently use them by:
a) Determining appropriate staffing levels b) Developing and keeping within budgets
c) Providing professional training and opportunities for employees d) Ensuring high utilization of capacity at facilities
e) Designing operations that give high productivity
f) Monitoring performance and continually looking for improvements
g) Doing anything else needed to efficient and effective
5. Supply Base Management
Selecting, developing and maintaining a suitable set of suppliers is a key activity in purchasing. Purchasing must keep abreast of current conditions in supply markets in order to:
• Ensure current suppliers are competitive
• Improve and develop existing suppliers, particularly those who are failing behind competitors
• Identify new suppliers who can provide good service and join the supply chain
• Develop new potential of new suppliers whose performance is not yet good enough to join the supply base
In short, procurement process is the set activities and procedures related to acquire materials for an organization. (Van Weele, 2005) presents a basic model of the procurement process. This process has six steps:
34 5) Expediting
6) Evaluation
This process gives a rather good overall picture of the operative handling of procurement, but it lacks descriptions of other parts of procurement such as measuring performance and advanced supplier management.
2.3Research Theory
2.3.1 Knowledge Management, River Model
In terms of knowledge management, rely on the knowledge management models introduced by Romhardt (1998). Synthesizing these models to a knowledge management cycle model, this model with its different knowledge cycle activities (identify, acquire, structure, combine, share, distribute, use, preserve, eliminate.
Robbins (2003) defines knowledge management (KM) as a ‘‘process of organizing and distributing an organization’s collective wisdom so the right information gets to the right people at the right time. Laudon (2003) goes a step further by introducing ‘‘knowledge-level decision making based on the evaluation of new ideas for products, services, ways to communicate new knowledge, and ways to distribute information throughout the organization.’’ This suggests that firms can only sustain a competitive advantage when valuing its customers input and employee interaction. This interaction sometimes requires an employee to use innovation in order to ‘‘devise problems, define them, and develop new knowledge from them’’ (Van Beveren, 2002). A number of studies Defining knowledge management by Choi, 2000, Barclay and Murray, 2000, American
Productivity Quality Center(1999), Liss(1999), Murray (1998), Corrall (1998),
Mayo (1998), Martinez (1998), Chait (1998), Beckman (1997), Stewart (1997),
Pascarella (1997), Bassie (1997), O’Dell (1996), Manasco, (1996), Garvin (1993).
35
Nonaka & Takeuchi, 1995;Ruggles, 1998; Shin et al., 2001; Skyrme &Amidon,
1998; Spender, 1996; Teece, 1998). They have identified many key aspects to this knowledge management process: capture, transfer, and use (DeLong, 1997);
acquire, collaborate, integrate, and experiment (Leonard-Barton, 1995); create, transfer, assemble, integrate, and exploit (Teece, 1998); create, transfer, and use (Skyrme & Amidon, 1998; Spender, 1996).
For example, Alavi and Leidner (2001) considered four processes including creation, storage, transfer, and application. Gold, et.al., (2001) clustered various capabilities into four broad dimensions of process capability—acquiring knowledge, converting it into a useful form, applying or using it, and protecting it.
Lee and Choi (2003) focused on the knowledge creation process, and they adopt the SECI (socialization, externalization, combination, internalization) process model by Nonaka and Takeuchi (1995) to explore knowledge creation. Ruggles (1998) divided company’s knowledge management processes by four categories
including generating and accessing, facilitating and representing, embedding and usage, and transferring and measuring.
Many KM models with different approaches and mindsets have been proposed in literature McAdam and McCreedy (1999) have identified three broad categories of KM models, namely knowledge category models, intellectual capital models, and socially constructed models. These models are important in enriching our understandings on the essentials of KM activities; yet do not provide an integrative perspective for actual KM implementation. Another type of KM framework includes those that have been developed by researchers to serve as a basis for examining how KM has been performed in industry. These frameworks provide a reference to facilitate the structuring, analysis and evaluation of the KM initiatives undertaken in various case companies. The frameworks developed by
36
Table2.2Frameworks & Models for Knowledge Management Implementation Framework and Model
Researcher
Perform strategic plan, perform business need analysis, conduct cultural assessment and establish,
performance conceptual modeling, perform physical modeling, capture and secure knowledge, represent knowledge, organize and store knowledge in the knowledge management system , combine knowledge, create knowledge and share knowledge Rubenstein. (2001)
Form powerful coalition, Communicate vision of KM, Establish teams for needs assessment, Analyze the needs of KM, Identify and collect knowledge, Design a technological structure to warehouse knowledge, Test the technology, Maintenance of the technology, Retest the technology, Training of knowledge workers, Roll out the use of KM practices, Track usage, Make systems go live, Measure quality and productivity, measure the performance of KM practices, conduct a need assessment review.
McCampbell et al. (1999)
Build management understanding and commitment to pursue KM, Map perspectives of the knowledge landscape, Plan the organization KM priorities, focus and strategy, Identify sought KM benefits, Adjust KM priorities and Create KM-related incentive programmed.
Wiig (1998)
Obtain management buy-in, Survey and map the knowledge landscape, Plan the knowledge strategy, Create and define knowledge-related alternatives and potential
initiatives, Portray benefit expectations for knowledge management initiatives, Set knowledge management priorities, Determine key knowledge requirements, Acquire key
knowledge, Create integrated knowledge transfer programmes, Transform, distribute and apply knowledge assets, Establish and update a KM infrastructure, Manage knowledge assets, Construct incentive programmers, Coordinate KM activities and functions enterprise- wide, Facilitate knowledge-focused management and Monitor knowledge management.
Wiig (1999)
Success in establishing an enterprise knowledge culture, top management support for managing knowledge, ability to develop and deliver knowledge based goods/services, success in maximizing the value of the enterprise is intellectual capital , effectiveness in creating an environment of knowledge sharing, success in establishing a culture of continuous learning, effectiveness of managing customer knowledge to increase loyalty/ value and ability to manage knowledge to generate shareholder value
Chase,R.L.(2000)
Connecting people with other knowledgeable people, Connecting people with information, Enabling the conversion of information to knowledge, Encapsulating knowledge, to make it easier to transfer and Disseminating knowledge around the firm
Junnarkar,B.(1999)
Identify the business problem, Prepare for change – obtain executive support and make the shift to a sharing culture, Create the team, Perform a knowledge audit – identify , Define key features required for the technological infrastructure, Phase in knowledge management and Link people to knowledge- knowledge directory and content management Dataware Technologies,Inc.(1998)
Discovery – identify business goals, challenges and opportunities, Definition – determine key requirements and scope of the project, Start - up – detailed project plan is developed, Delivery – implement the plan, Evaluation – ensure results meet expectations and facilitate knowledge transfer
37
Getting Started, Explore and Experiment, Pilots and KM Initiatives , Expand and Support and Institutionalize KM APQC(1996)
(American Productivity & Quality Center)
knowledge management , knowledge processes and Business processes
McElroy
2007
Identify and verify knowledge, Capture and secure knowledge, Organize knowledge, Retrieve and apply knowledge, Combine knowledge, Learn knowledge and Distribute/sell knowledge. Liebowitz (2000)
Identify knowledge, Capture knowledge, Select knowledge, Store knowledge, Share knowledge, Apply knowledge, Create knowledge and Sell knowledge
Liebowitz & Backman(1998)
A pragmatic guide to building a knowledge management program
Frid (2002)
A common KM framework for the Government of Canada: framework for enterprise knowledge management Frid (2003)
Creating the discipline of knowledge management: the latest in university research: This model appears to be a developing methodological framework, rather than a single model, and is the subject of continuing doctoral research at
the George Washington University. Stankosky (2005)
The KM frameworks that have been presented in the literature tend to focus on different aspects of KM and have different purposes. Among them, the most notable includes the knowledge creation framework developed by Nonaka (1994) and Takeuchi (1995), which describes how the evolution and conversion between explicit knowledge (characterized by its ability to be codified or put in writing) and tacit knowledge (which is mostly people bounded and hard to articulate) can lead to a knowledge creation spiral in an organization. Arguably, this is not a KM framework per se, as it only deals with the creation of knowledge, which is only a portion of what constitutes KM.
The guidelines proposed in this paper for developing a KM implementation framework are as follows:
• KM Strategy
• Leadership Behaviors • Networking
38
2.3.2 SERVQUAL Method
SERVQUAL used to measure and manage the quality of service by distributing questionnaires that measure both customer expectations for quality of service in these five dimensions and their perception of the service they receive. As customer expectations are greater than their perception of the service quality is considered low.
This method was developed by Zeithaml, et.al., (1990) using a manual approach based-approach, which quantitatively measure service quality in the form of a questionnaire and contains the dimensions of service quality, namely tangibles, reliability, responsiveness, assurance, and empathy.
This method is divided into two parts, namely:
1. Section expectations, which contain questions to ascertain the general expectation of the consumer to a service.
2. Section perception that contain questions to gauge consumer perceptions of the companies in specific categories.
Then the consumer gives weight to the interests of each dimension there.
39
Word of Mouth
Communication Personal Needs Past Experience
Expected Service
Perceived Service
Service Delivery
Service Quality Specification
Management Perception of
Customer Expectation
External Communications to Customers
CUSTOMER
PROVIDER
Gap 1
Gap 2 Gap 3 Gap 5
Gap 4
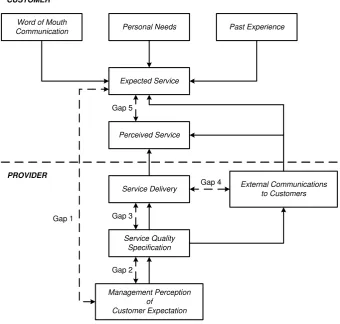
Figure 2.4 Conceptual model of Service Quality (Zeithaml, et al., 1990)
1. Gap 1: Not knowing what customers want
Gap 1 shows the difference between customer expectations with perceptions of companies about customer expectations. The main factors that affect the gap 1 is as follows:
a. Lack of orientation on market research, e.g. lack of market research, lack of use of research results, and the lack of interaction between the management with customers.
b. The lack of upward communication, such as company employees who deal directly with customers less interaction with the management.
40
2. Gap 2: Error selecting service quality standards
Gap 2 shows the difference between the perceptions of the company regarding customer expectations by setting service specifications.
The main factors that affect the gap 2 are as follows:
a. Lack of management commitment to service quality, for example: the lack of commitment of employees to increase service quality, lack or absence of internal programs to improve the quality of service to customers.
b. Perception of infeasibility, for example: the capability of companies that cannot meet the demand of customers on service quality, nonconformity existing operating system with customer expectations, the lack of the ability of employees to deliver the level of customer service requested.
c. Lack of standardization work, for example: the lack of automation in maintaining consistency in serving customers.
d. The absence of goal-setting, such as the absence of a formal process used in establishing clear objectives.
3. Gap 3: Gaps service performance
Gap 3 shows the difference between service quality specifications defined by the process of service delivery to customers.
The main factors that affect the gap 3 as follows:
a. The ambiguity of the role which shows the extent to which employees can perform tasks according to the expectations of the manager but also can satisfy the consumers
b. Role conflict which shows the extent to which employees believe that they did not satisfy all those whom it serves.
c. Conformity employees with the work they do. d. The suitability of the technology used employees
e. System control from above showing the assessment system and inadequate reward system.
41
g. Teamwork showing the extent to which employees and management to formulate a common goal to satisfy customers together and integrated.
4. Gap 4: Non-compliance with the promise given service
Gap 4 shows the difference between the qualities of services given by the company with the statements made by a company through marketing communications.
The main factors that affect the gap 4 as follows:
a. Inadequate horizontal communication, such as lack of communication between the advertising or promotion of the production, the lack of communication between the sales operations, lack of communication between the human resources, marketing, and operations, policies and procedures and the differences between divisions or departments.
b. The tendency of companies to provide excessive promises.
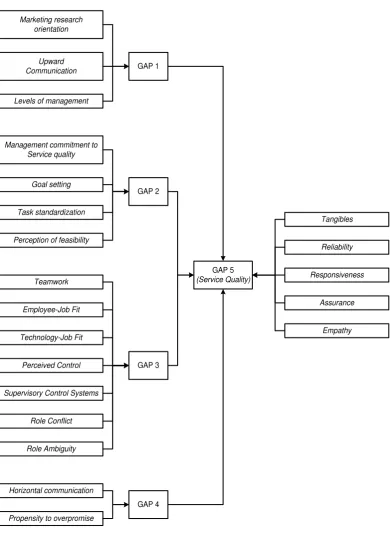
5. Gap 5: The gap between perceptions and expectations of customers
42
Marketing research orientation
Upward Communication
Levels of management
Management commitment to Service quality
Goal setting
Task standardization
Perception of feasibility
Teamwork
Employee-Job Fit
Technology-Job Fit
Perceived Control
Supervisory Control Systems
Role Conflict
Role Ambiguity
Horizontal communication
Propensity to overpromise
GAP 1
GAP 2
GAP 3
GAP 4
GAP 5
(Service Quality)
Tangibles
Reliability
Responsiveness
Assurance
Empathy
43
2.3.3 QFD Method
According to Cohen, QFD (Quality Function Deployment) is a method for structuring the planning process and product development, and allows for detailing the customer's wants and needs clearly. QFD can also be interpreted as the spread of the functions associated with the development of products and services with quality that meets customer satisfaction (Reville, Frigon and Jackson, 1995). QFD in reality is a series of components that do not all require the presence of specific applications.
According to Cohen, L (1997), the main tool used in QFD in 4 points:
1. Affinity diagram is a hierarchy that is built from the bottom up (bottom-up) and the connection between ideas based on intuition of a team making.
2. Tree diagram, as well as affinity diagram, is a hierarchical structure of ideas. The real difference is the tree diagrams is built from the top down (top down) and use the process of analysis and logical reason. Process affinity diagrams and tree diagrams are usually used together in unity. First, affinity diagrams are used to create the proposed hierarchy of data rude. Second, the process tree diagram used to supplement and re-structuring to produce a better structure.
3. Matrix diagram, providing relationship mappings between the two parts of the idea / item or concept.
4. Prioritization matrix provides a way of expressing the forces of relationships that have been built on a matrix diagram, using the values of numbers and graphs in matrix cells. Finally, by transferring the weight of the items on the left with the value of the strength of the relationship will get the priority value of items that are located on the top of the matrix.
According to Dale (1990) the benefits of QFD are: 1. Improving the quality
44 4. Improve time to market
5. The low cost in the design and manufacturing 6. Improving the reliability of the product 7. Reduce planning time
8. Improve engineering productivity and staff 9. Reduce complaints and warranty
10. Improving market opportunities 11. Improving profitability
12. Develop decision-making process (decision making) 13. Improving communications.
According to Kenneth Crow (1999), based on the QFD method engineering approach to the system consisting of the following general steps:
1. Get a top-level product requirement or the technical response of the needs of consumers (Product Planning Matrix).
2. Develop product concepts to satisfy these needs.
3. Evaluate product concepts to determine / choose the most optimal (Concept Selection Matrix)
4. Divide in parts of the system concept (Assembly / subsystems) and then lower the higher-level requirements or technical response to these subsystems.
5. Getting a lower-level product requirements (assembly or part characteristics) and specifications from subsystem (Assembly / Part Deployment Matrix). 6. To Critical Assemblies, later revealed to be lower-level product
requirements (Assembly or Part Characteristics) for the booking process. 7. Determine manufacturing process steps that correspond with the assembly or
part characteristics.
8. The basic of this process step is the initial needs, process control and quality control to ensure the attainment of Critical Assembly or part characteristics.
45
the lack of specificity as well as firmness in the existing literature, such as how to use downstream QFD matrix. According to the Monroe-Faure (1996), the principal tool that using in QFD is HoQ (House of Quality) is a matrix showing the relationship between the customer's needs with technical response.
Quality Function Deployment (QFD) is a method in the process of development of products / services that serve to translate the desires of consumers to the desire of the company correctly. QFD is then linked to internal processes, such as product planning. QFD is known in the product development process there are two types: QFD 1 and QFD 2. QFD 1 is often called House of Quality (HOQ). House of Quality is a diagrammatic representation of products / services attributes therein, consumer desire, and the ability of the company. In HOQ done by changing consumer needs into technical response that will be developed. Then do weighting process on the technical response of the most influential to enter into the next stage of the process. In determining the technical targets, need a comparison that technical benchmarking of existing products in the market during this time. In addition to technical benchmarking, should also be specified position of a competitor's product against other products in view of the consumer, so that the determination of the target as a result of an analysis of the technical benchmarking becomes valid. Here it is assumed that the reference product is a competitor product that became the basis of new product development. Having obtained the technical response is considered important along with targets and weight then do step design. After selecting the product concept is based on the criteria proposed by the consumer and manufacturing, then do the next product design process is to make QFD. At present QFD 2, the technical response that have been made are then converted into part response of each component part of the selected product concept. At this stage it will also be determined targeting of character parts.
46
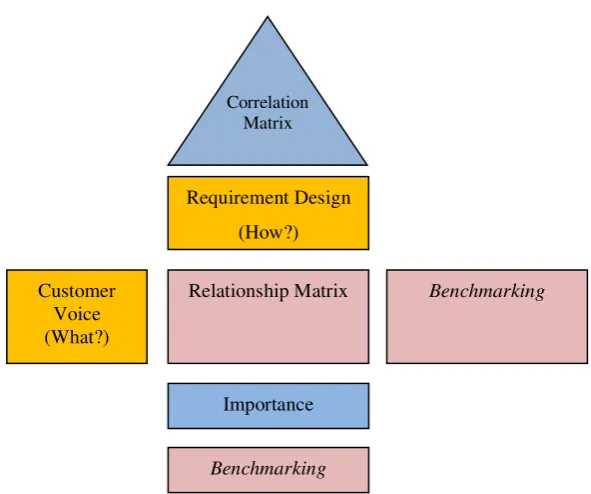
Figure 2.6 House of Quality (Bernal, 2009) About house of Quality:
1. Voice of Customer
QFD starts with the establishment of objectives, which answers the question “What?”. What desire to achieve the development of new services? These objectives are derived from the requirements of clients and called the voice of the customer.
2. Design Requirement
After completing the needs of the client, next step is to construct "How?”, to determine how the need of each client can be satisfied with the service. This is a measurable feature that can be calculated and evaluated in the end of the development process.
3. Relationship matrix
The relationship between the client's needs and the design is not always one to one. Sometimes there is a complex relationship and the different levels of strength. One single design requirements can have an influence on some of the client's needs.
4. Benchmarking
Importance
Benchmarking
Correlation Matrix
Requirement Design
(How?)
Relationship Matrix Customer
Voice (What?)
47
QFD technique allows the assessment of competitors. Benchmarking is done for "What" and "How" the services along the lines of both companies compared to client requirements.
5. Level of Importance
The level of importance expressed relative significance of each client and design requirements to achieve the desired goal. Significance of customer needs established through the evaluation by the customer.
6. Correlation Matrix
The correlation matrix is triangular table. "How" is integrated with build correlations between all elements. This matrix illustrates the strength of relationship between the requirements of the design. Aiming to identify the requirements which support one another and which are not favorable.
2.3.4 TRIZ (Theory of Inventive Problem Solving)
TRIZ is the acronym of the Russian language, Teoriya Resheniya Izobreatatelskikh Zadatch. Translated in English became "Theory of Inventive Problem Solving". TRIZ is the result of analyze whole world of technological innovation as a description to most creative literature patents. This analysis has been carried out over a period of 50 years with the total number roughly 3 million of patents analyzed (Skrupskis and Ungvari, 2000). TRIZ were applied in the industry, as the replacement of of trial-and-error method that does not have systematic problem solving.
TRIZ developed by G.S Altshuller and his colleagues from Soviet Union. TRIZ is a philosophy of technology, method of science and technology, a systematic way of thinking for development of creative ideas, a system which includs knowledge of technology, software for databases, and others. Long story short, TRIZ provides great principles and tools that concrete for creative thinking in a series of technology (Nakagawa, 2004).
In TRIZ there are number of methods to analysis, among others are:
48
2. Analysis function - take a single problem statement and through the use of statements that related to cause and effect, generate a comprehensive list of issues more explicit. The purpose of functional analysis is simplification, the trend in design development with number of parameters that decline, but not less than the number of functional purposes.
3. Algorithm for Inventive Problem Solving (Ariz) - TRIZ has develop a troubleshooting procedures in which analyzing the problems to formulate the technical contradiction, then reformulate into a physical contradictions, and finally resolve the issue with the principle of separation. This procedure is called Ariz; an alternative steps to develop definition of problem that has more difficult issues.
4. Analysis of Substance - Field - modeling the problem to the components through new thought based on structure of the system and the source. The solutions are useful for sharing a case of Substance - Field Model has accumulated and compacted into "76 Inventive Standard Solution".
In Quality Engineering (2008) describes the Knowledge-based tool shows the main observations made by fixing Altshuller on the efficiency and effectiveness of contradictions and evokes breakthrough inventive concepts. All equipment of TRIZ knowledge-based produces a concept that requires a change in practical solutions to satisfy the needs of specific issues.
1. Pattern / Prediction Evolution
49
2. The principle of contradiction
The contradiction between the two design performance parameters can be solved using one or more of 40 basic innovation. Basic usage of the successfully 1263 contradictions is shown in a contradiction matrix. To represent the condition of this technical contradiction, TRIZ has selecting 39 system parameters and provides a matrix problem size 39 x 39, then surveying a large number of patents, each patent analyzed to discover which type of technical contradictions (between 39 x 39) and which principles of invention are the most widely used in each type of 39 x 39 issues. 4 top principle in each type of problems are noted in the form of a table of 39 x 39 elements, result of the table are called " Altshuller Contradictions Matrix".
3. Principle of Separation
The inherent contradiction, sometimes called physical contradictions, the simultaneous occurrence of two conditions separated from one another which can be solved using the principle of separation.
4. Standard Solution
Is a generic system modification to a model developed using Su-Field analysis ('76 Inventive Standard Solution "). These solutions can be categorized into 5 main categories;
a) Improve the system with little or no change - 13 standard solutions
b) Improve the system by changing the system - 23 standard solutions Transition system - 6 standard solutions
c) Transition system - 6 standard solutions
d) Detection and measurement - 17 standard solutions
50
5. Effect
An effect is a physical act that generates an object a basis or any other action as a consequence. As a general rule, this is a phenomenon associated with product design.
6. Operator System
When analyzing function model after clarifying opportunities step, we can approximate the model from three views or strategy. The strategy as of following:
a) Eliminate harmful effects, b) Eliminate excessive action, and c) Enhancing the beneficial action
Features available on TRIZ can be summarized as follows (Zhang, et al., 2005): 1. TRIZ helps raise the ideal quality in the systematic and efficient shape. 2. TRIZ help resolve psychological problems by formulating possible
solutions.
3. TRIZ supports thinking without trade-offs.
When Genrich Altshuller completed basic research of world patent, he made four main observations (Quality Engineering, 2008):
1. There are five levels of invention: Level 5 : Finding a new phenomenon
Level 4 : Invention outside design paradigm requires new technology from different fields of knowledge
Level 3 : The discovery in the design paradigm requires the completion of a physical contradiction.
Level 2 : Improvements to the invention requires completion technical contradictions
Level 1 : The real solution (no innovation) result in simple improvements. 2. Inventive problems contain at least one contradiction. Altshuller introduced
51
the core problems, which is technical contradictions, and provide a hints in the form of table for solutions. Technical Contradiction is case where if we try to improve an aspect (or parameters) of systems, other aspects will decline. He also observed the repetition use of same basic solutions is often separated in several years. Altshuller concluded that if the next designer has knowledge of previous solutions, actions of designers should be simplified.
3. The same principle is used in some inventive design because it can be considered as a pattern solution. Inventive principle is the best practice that has been used in some application and quoted from several industries.
4. There is a standard pattern for development. To create a product or services, it is important to predict and make analogies for the future situation on the same concept. Previous development from the design are tested and applied to predict the future design that going to be studied.
Altshuller sure that every idea / invention have the same basic shape that he observed more than 40 years until producing TRIZ.
1. "40 Inventive Principles"
"40 Inventive Principles" is made by finding a variety of information from various patents. Almost all of the principles have sub-criteria and illustrated with a case for reference.
2. Contradiction Matrix
52
recorded in a table of 39 x 39 elements; the results table called "contradictions Altshuller Matrix".
3. Knowledge Base of Physical Effects
An effect is a physical act of an object that generates basis or any other action as a consequence. This general rule is the phenomenon associated with product design
4. Knowledge Base for Finding Means from Target Functions
In technology, we often find some way to run something that we want. TRIZ create a hierarchical general system to represent the wishes and organize technology and knowledge in the system.
5. Knowledge Base of Trends of Evolution of Technical System
Table 2.3 Systematic Innovation through TRIZ (Zhang, et al., 2003)
1. Segmentation 21. Skipping
2. Taking out 22. “Blessing in disguise” or “Turn
Lemons into Lemonade”
3. Local quality 23. Feedback
4. Asymmetry 24. “Intermediary"
5. Merging 25. Self service
6. Universality 26. Copying
7. “Nested Doll” 27. Cheap short-living objects
8. Anti weight 28. Mechanics substitution
9. Preliminary anti action 29. Pneumatic and Hidraulics (Intangability)
10. Preliminary action 30. Flexible shells and thin films 11. Beforehand cushioning 31. Porous materials
12. Equipotentiality 32. Colour changes
13. The other way round 33. Homogenity
14. Spheroidality 34. Discarding an recovering
53
16. Partial or excessive action 36. Phase transition
17. Another dimensions 37. Thermal expansion (Strategic expansions)
18. Mechanical vibration 38. Strong oxidants (Boosted interaction)
19. Periodic action 39. Inert Atmosphere
20. Continuity of useful action 40. Composite material
2.3.5 Correlation TRIZ and QFD
QFD role to TRIZ, TRIZ methodology enhanced by using voice of customer is to make innovation process and design. QFD provides process to identify the needs of consumers.
TRIZ role to QFD, QFD do not offer assistance in creating alternative design. QFD is processing the perfect job in prioritizing the issues that to be resolved. Modern TRIZ offers the most efficient tool for creative and innovative solutions that difficult to be solved using QFD concept. TRIZ is close to the problem solving that related with the satisfaction as QFD needed. Regularity discovered by Henrich Altshuller applied to all systems that exist in the organization.
The relationship between TRIZ and QFD introduced in two format. The first is using model "Step-by-step QFD" (five steps) with classical TRIZ. Classical TRIZ is a combination of science and art. The second, with ideation methodology that integrates the different perspectives that offered in classical TRIZ entirety incorporated.
In this study, the authors use QFD method to locate the problem, and then use the TRIZ method for solving the problems related to services to its users in PT. A.
2.2 State of Art on Previous Research
54
Management, QFD and TRIZ becoming the reference to improve the quality in purchasing department of contract & procurement division PT.A. Long story short, the elaboration of the State Of The Art (SOTA) on previous research can be seen in Table 2.4 below.
Table 2.4 Previous Researches
No Researcher Years Title of the Research
Type of Research Industry
Purchasing KM Servqual QFD TRIZ Industry Sub
55