e-ISSN: 2477-5282 p-ISSN: 2599-3127
Journal Terapan Manajemen dan Bisnis is licensed under A Creative Commons Attribution-NonCommercial 4.0 International License
MEASURING AUTOMOTIVE COMPANY'S CAPABILITIES IN INDONESIA IN PRODUCING PROFITS REGARDING WORKING CAPITAL
Yuniningsih Yuniningsih1), Veronika Nugraheni Sri Lestari2), Nurmawati Nurmawati3), Barid Nizarudin Wajdi4)
1)Fakultas Ekonomi dan Bisnis, Universitas Pembangunan “Nasional”Jawa Timur, Indonesia E-mail: yuniningsih@upnjatim.ac.id
2)Fakultas Ekonomi dan Bisnis, Universitas Dr. Soetomo Surabaya, Indonesia E-mail : venugra@unitomo.ac.id
3)Fakultas Industri, Universitas 45 Surabaya, Indonesia E-mail: nurmawati22765@gmail.com
4) Stai Miftahul Ula Nganjuk, Indonesia E-mail: baridnizar84@gmail.com
Abstract
The present research aims to determine company's ability to generate profit for capital or shareholders represented by proxy profitability and measured by return on equity (ROE) by taking into account working capital. The method of analysis used is multiple linear regressions with profitability as dependent variable and working capital as independent variable in terms of cash cycle conversion variables, inventory turnover and liquidity. The data used is secondary data from financial statements of automotive companies listed in Indonesia Stock Exchange (IDX) with observation period of 2012-2016. The finding indicates that cash conversion cycle variable has a significant effect on profitability with negative direction yet does not support the hypothesis. Turnaround voucher variables support hypotheses which have a positive effect on profitability. Liquidity variable has no significant effect on profitability. Limitation of this research is that working capital variable only based on 3 variables. Implications created by the present study are that independent variables in this study have only contributed in explaining the dependent variable by 27.9%. Therefore, future study needs to be expanded with other variables of working capital or other variables. In addition, unit of analysis can be extended to companies other than automotive.
Keywords: Benefits,cash conversion cycle, inventory turnover, liquidity.
Introduction
Technological advances are rapidly pushing company to be more and more competitive in producing products to be marketed. Competitiveness includes competitiveness in terms of products physically and non-physical by supporting eases and comfort in use. Consumers today are selective in choosing products. It encourages every company to always innovate continuously. Innovation is conducted continuously is an effort to maintain the survival of the company, especially in carrying out daily operational activities.
e-ISSN: 2477-5282 p-ISSN: 2599-3127
innovation. Harahap (2008) states that the result of the sale of products is expected to generate profit. The ability of firms to earn a profit greatly determines benchmarks and high performance of the company (Yuniningsih, Widodo, & Wajdi, 2017); ( Yuniningsih,Hasna, Nizarudin, & Sugeng, 2018). According to Walker (2001) there are 3 factors used in analyzing company’s performance including productivity, profitability and market premium or market value of company exceeding book value.
Measurement of company's ability to generate profit in this study ises profitability variable by using ratio or proxy of return on equity (ROE) as dependent variable. Profitability shows the ratio to assess the ability of firms to make profits (Cashmere, 2012). The opinion is clarified by Munawir (2010) that profitability shows the ability of the company to gain profits associated with total assets, sales and own capital. If concluded then companies that have high profitability shows the company more effective in running the company's operations so as to provide benefits and vice versa. One of the factors affecting the profitability is working capital. Working capital becomes the main problem facing the company as it relates to the daily operational costs. According to Brigham and Houston, (2006 ) working capital is all short-term assets in the form of cash, securities traded, inventories and accounts receivable that will be rotated to generate profit. Munawir (2002) asserts that working capital should be enough in number so as to finance the expenses or operations of the company every day. Mandiefe S.P (2016) also stated that successful working capital management requires good and continuous policy design every day.
Many factors can be used to measure working capital. According to Kumaraswamy S (2016) in a study of working capital, these factors include cash cycle variable by calculating the conversion by calculating inventory conversion period, Average receivable collection period and average accounts payable period. Bagh T, et al., (2016) examines financial performance affected by working capital. Working capital variables consist of inventory turnover, average payment period, and cash conversion cycle. In this study working capital variables used are cash conversion cycle, inventory turnover and liquidity.
The highest level of working capital liquidity is cash. With cash, a company can immediately pay the debt, buy raw materials, pay employees, finance investment and so on. According Hapsari YP (2012) the use of more efficient cash allows companies gain greater profitability. One indicator of the efficiency of cash use is cash conversion cycle.
Ulum MM and Hartono U (2017) indicates that cash conversion cycle has a positive effect on profitability. They shows that the higher the level of cash conversion cycle, the higher the level of profitability of the company and vice versa. However, Khan FN et al., (2013) asserts that cash conversion cycle has no significant relationship to profitability. Bagh T et al., (2016) confirms that cash conversion cycle negatively affect profitability proxyed with Return On Equity (ROA). Surya S et al. (2017) shows that cash turnover either simultaneously or partially has no significant effect on profitability. The three findings results show research gap on variable of cash conversion cycle with profitability.
Another working capital variable affecting profitability of a s is inventory turnover. Diana PA (2016) found that inventory turnover has significant effect on profitability. Meanwhile, Hapsari YP's (20 12 ) found that inventory turns have no effect and have a negative direction on financial performance proxyed with Return on Assets (ROA). Surya S et al. (2017) shows that inventory turnover either simultaneously or partially has no significant effect on profitability. The three researches indicate gap variable on inventory turnover with profitability of this study.
e-ISSN: 2477-5282 p-ISSN: 2599-3127
Amin (1995 ), from shareholders point of view, high liquidity is not always profitable for there is a chance of unemployment funds that should be used to invest in profitable project projects.
Putri N., et al., (2015) argues that liquidity has a significant effect on profitability. On the other hand the results of liquidity research has no significant effect on profitability is the result of research from Wibowo and Wartini (2012). Some of the research findings show contradictory results, the differences in the findings are used as a research gap of variable liquidity with profitability in this study.
This study examines automotive companies listed on the Indonesia Stock Exchange (BEI) from 2012 to 2016. The available data indicates that company's profitability shows a decline from 2012 to 2016 or during the period of observation. The calculation of the increase or decrease in profitability used Return On Equity (ROE ) proxy reverses in 2012 to 2013 by -0.30757 (-30.757%), in 2013 to 2014 by - 0.14042 (-14.042%), in 2014 to 2015 by -0.4205 (-42.05%) and decreasing in 2015 to 2016 by -0.37432 (-37.432%) . Based on the research gap of the three independent variables of cash conversion cycle, inventory turnover, liquidity with the dependent variable, profitability and the phenomenon of decreasing profitability for shareholders with the proxy of Return on Equity (ROE) during the observation year of the research then used as the basic problem in this research. The purpose of this study is to determine companies abilities of in generating profits for shareholders in the influence of working capital, especially from cash conversion cycle, inventory turnover and corporate liquidity.
Literature Review
Profitability is the company's ability to generate corporate profits. Profitability can be measured by asset and share capital. Profitability by asset is proxied with Return on Assets (ROA) which indicates economic profitability (Hanafi, MM, and Halim, A., 1995). Profitability based on share capital is proxied with Return on Equity (ROE) which shows rentability of share capital (Hanafi, MM, and Halim, A., 1995).
Cash conversion cycle is the time period needed to turn cash into cash back. Octavia S (2015) asserts that cash conversion cycle is the length of time taken by a company to spend cash to pay the debt until the cash goes back through inventory turnover and debt collection. Ashraf CK (2012) cash conversion cycle is measured by estimating the inventory conversion period and the inventory conversion period then reduced by the period of debt conversion. Subramayam (2010) states that the average payout period indicates the number of days required to pay short-term bills. The faster the time it takes to convert cash, the higher the profitability of a company.
Inventory is needed by the company in maintaining the smooth operation of the company every day. Inventories sometimes change so often that the management must be careful so that there will be no advantages or disadvantages. According to Bhunia A (2010) low inventory turnover ratio indicate that management does not properly manage inventory. Inventory turnover ratio shows how many times the number of items available in one year (Kasmir, 2010). Munawir (2004) mentioned that the higher level of inventory turnover minimizes the risk of losses caused due to the decline in prices or changes in consumer tastes. Munawir (2004) also stated that the higher the inventory turnover rate will satisfy the consumers as inventory remains available to consumers while saving on storage and maintenance costs. The conclusion is that the faster or higher the inventory turnover the faster the goods are sold so as to show the higher profitability of the company.
e-ISSN: 2477-5282 p-ISSN: 2599-3127
availability of cash or equivalent to the cash (gyro account) owned by the company. The higher the company's ability to pay debts, the larger the company produces the profits.
Based on the above explanation, this research makes three hypotheses as follows, H1. Cash conversion cycle has a positive effect on company profitability.
H2. Inventory turnover has a positive effect on company profitability. H3. Liquidity has a positive effect on company profitability.
Methodology
Dependent variable used in this study is profitability, while the independent variables include cash conversion cycle, company turnover and liquidity.
Dependent Variables (Profitability or Y)
Profitability shows the company's ability to generate profits for ordinary shareholders. The proxy of profitability uses Return on Equity (R OE). The formula of ROE according to (Hanafi, MM, and Halim, A., 1995) is as follows:
(1)
Independent Variables Include Cash conversion cycle/CCC (X1)
It shows the time period of change from cash to cash again. According to Syarief and Wilujeng (2009) Cash conversion cycle is calculated by the formula as the follow
CCC=RCP+ICP-PDP (2) Where :
CCC = Cash Conversion Cycle RCP = Payable Receipt Period ICP = Inventory Conversion Period P DP = Debt Suspension Period
Inventory turnover (X2)
Inventory turnover indicates the frequency of inventory turnover available within one year. Inventory turnover is measured using the formula: Rahayu EA Susilowibowo (2014).
(3)
Liquidity (X3)
This is company's ability to pay due short-term debt. Liquidity is with current assets regardless of inventory. Liquidity in this study is measured using Quick ratio formula: Kasmir (2012: 132)
(4)
Determination techniques of population and Sample ROE = EAT – Preferred Stock Dividend Average of common stock
Inventory turnover ratio = Cost of goods sold Average Inventory
e-ISSN: 2477-5282 p-ISSN: 2599-3127
The present researches uses population of automotive companies listed on BEI (Indonesia Stock Exchange ) period of 2012-2016 by 13 companies. Samples were taken by using purposive sampling method and sampling criteria is go public company period of 2012 - 2016, presenting the financial statements required in consecutive year of 2012 - 2016. Based on these criteria, the total sample is 12 companies. Thus, the amount of data is 12 companies X4 years = 60 data
Hypothesis Analysis and Testing Technique
This research uses multiple linier regression analysis technique with quantitative method. The analysis technique is used to find the regression equation between working capital consisting of cash conversion cycle (X1), inventory turnover (X2) and liquidity (X3) with profitability (Y).
The equation model used is:
Y = a + b1X1 + b2X2 + b2X2 + e (5)
Where : Y = Profitability a = Constants
b 1 = Regression coefficient X 1 ( cash conversion cycle )
b 2 = Regression coefficient X 2 ( inventory turnover )
b3 = Coefficient of regression X3 ( liquidity ) X 1 = cash conversion cycle
X 2 = inventory turnover
X3 = liquidity e = Standard error
Prior To Multiple Linear Regression Test, Some Tests Are Performed: Normality test
Normality test uses Kolmogrorov-Smirnov test and Scatterplot chart. The test aims to determine whether the residual value is in a normal distribution or not. The assumption that must be met in the regression model is the validity of the research shown by the residual value in the normal or near normal distribution. The data criterion distributes norm al if Asymp Sig> 5%.
Classic assumption test
Research should meet the classic assumption that is no multikolinearity, there is no heteroskedastisity and autocorrelation (Ghozali, 2011).
Hypothesis testing
Hypothesis test is performed by performing simultaneous test (F) and partial test (t test) Simultaneous Test (F Test)
This is used to determine simultaneous influence of independent variables to the dependent variable. The test formula F is as follows: (Gujarati, 2006)
F = R2/k
(1- R2(n-k-1)) (6)
Where:
R2 : Coefficient of Determination
e-ISSN: 2477-5282 p-ISSN: 2599-3127 Partial Test (T Test)
This test is used to find out how far the influence of each independent variable to the dependent variable (Ghozali, 2011). The t test formula is as follows: (Gujarati, 2006) t = βn
Sβn (7 ) Where:
t: Following t function with degrees of freedom (df). Βn : regression coefficient of each variable.
Sβn: Standard error of each variable.
Coefficient of Determination (R2)
R 2 is used to measure the degree of relationship between each variable X to variable Y partially
(Ghozali, 2011). The formulations for test R 2 (Gujarati, 2006) are as follows:
Adjusted R2 = 1 – (1-R2) n-1
n-k (8)
Where :
ESS : The Number of Squares Explained TSS : Amount of Total Squares
n : Number of Samples k : Number of Free Variables
Finding and Discussion
Normality test
Normality test in this research is shown in the following table
Table 1: Normality Test
Unstandardized Residual
N 60
Normal Parametera Mean 0.0000000
Std Deviation 8.18777651
Most Extreme Absolute 0.131
Differences Positive 0.131
Negative -0.078
Kolmogorov-Smirnov Z 1.015
Asymp.Sig.(2-tailed) 0.254
a. Test distribution is Normal.
e-ISSN: 2477-5282 p-ISSN: 2599-3127
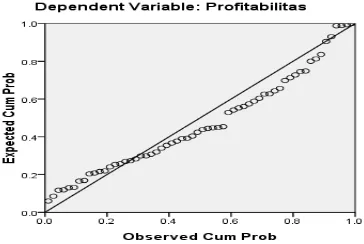
Figure 1: Graph of scatterplot Normality
Based on the picture, residual value indicates the validity of the data. The validity of the data based on the Scatterplot graph is indicated by the points of the data used in this study approaching or spreading around a straight diagonal line. The distribution of the data indicates that the data of this study is normally distributed.
Classic assumptions
After performing the normality test, a classical assumption test was conducted to find out whether the research was multicolinearity, heteroscedasticity and autocorrelation.
Table 2 : Result of Classic Assumptiom Information Result Criteria
Multicolinearity (VIF) - < 10 - Cycles conversion cash_X1 1.022 no multicolinearity - Inventory turnover_X2 1.055 no multicolinearity - Liquidity_X3 1.077 no multicolinearity
Heteroscedasticity - >0.05
- Cycles conversion cash_X1 0.192 no heteroscedasticity - Inventory turnover_X2 0.471 no heteroscedasticity - Liquidity_X3 0.474 no heteroscedasticity
Autocorrelation (Durbin Watson) 1.754 no autocorrelation Source : data processed
e-ISSN: 2477-5282 p-ISSN: 2599-3127
The three results of each independent variable indicate a value> 0.05, which means there is no homoscedasticity and heterocscedasticity. Thus, heteroskedasticity has a good regression model where the variance of the residual value from one observation to another observation is fixed.
The last classical assumption test in this research is autocorrelation test using Durbin Watson which shows the value of 1.754. The value of DL with k4 (the number of independent variables) and n = 60 (sample number) shows a value of 1.480 and a DU value of 1.727. The value of 1.754 lies between 1.480 with a value of 2,273 sought from 4-DU or 4-1727 = 2.273. based on these results it can be concluded that autocorrelation does not happen. So this research qualifies the validity of the residual value of normal distributed data, there is no multicollinearity, heteroscedasticity and no autocorrelation occurs.
The following table shows the results of statistical tests with the purpose of knowing how the variable ability of the company in generating profit or profitability (Y) is influenced by the cash conversion cycle (X1), inventory turnover (X2) and liquidity (X3). The results of statistical tests are shown in the following table:
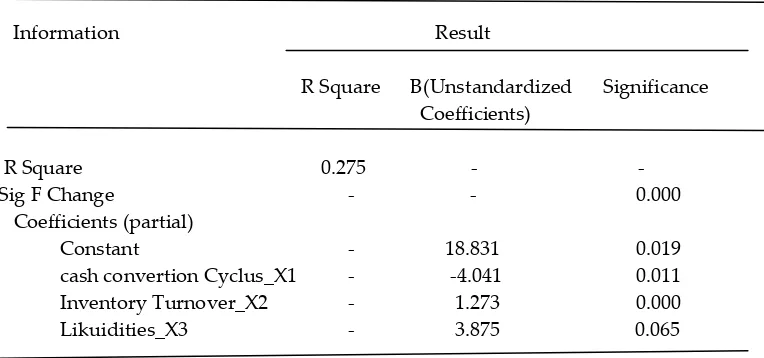
Table 3 : Result of Multiple Linier Regression Test
Information Result
R Square B(Unstandardized Significance Coefficients)
R Square 0.275 - -
Sig F Change - - 0.000
Coefficients (partial)
- Constant - 18.831 0.019
- cash convertion Cyclus_X1 - -4.041 0.011
- Inventory Turnover_X2 - 1.273 0.000 - Likuidities_X3 - 3.875 0.065
Source : data processed
Level of significance in this study is 0.05 or 5%. Table 3 above shows that R 2 or R Square has
a value of 0.279. R 2 or R Square explain that this research is explained by independent variable which
include cash conversion cycle (X1), inventory turnover (X2) and liquidity (X3) equal to 27,9% while the rest equal to 72,1% explained by other independent variable outside the variables studied in this study. The F value shows a significant value of 0.000 and less than 0.05 level of significance used in this study. It shows that the three independent variables used in this research have a significant influence on dependent variable that is profitability.
H1 hypothesizes that cash conversion cycle (X1) has a positive effect on profitability (Y). Statistical test shows that cash conversion cycle (X1) has a significant negative effect on profitability with significance value of 0.011 and less than the level of significance 0.05% used in this study. This result is not compatible with Ulum MM and Hartono U (2017) research where the conversion cycle has positive effect on profitability. It is also not compatible with the research of Khan FN et al (2013) and Surya S et al., (2017) where cash conversion cycle has no significant effect on profitability.
e-ISSN: 2477-5282 p-ISSN: 2599-3127
results of this study indicate that higher cash conversion cycle equals to lower profitability for shareholders and vice versa. While the company's cash-conversion cycle is high, the company's ability to share shareholder profits is low, this is due to the fact that profits are large but preferable to be allocated as retained earnings not to shareholders.
The company's goal when facing high profits is mostly allocated to retained earnings while still dividing shareholder dividends. This is done because the company undertakes the investment expansion of preferred funding sources from internal equity not from external equity or external finance. Cash flow and funding sources are closely linked to the prudent determination of corporate policies as they will determine the company's value or its financial performance (Yuniningsih, 2012): (Yuniningsih, 2017) ; Lestari, VNS., 2017 ). One source of internal equity funding is from retained earnings while external equity from issuing shares and external finance comes from debt. The results of this study are in accordance with pecking order theory (Donaldson, G. 1961, Myers, SC 1977 ) which discusses that funding is based on a sequence of funding taking into account the size of the cost of financing. Conversely, when cash conversion cycle is low, the profit for shareholders increases that indicates that the company will share more profit to shareholders. Both of the above is done with the aim to maintain the prospect of the company in the old investors and potential new investors so that stock prices remain higher in the capital market.
H2 hypothesizes that inventory turnover (X2) has a positive effect on profitability (Y). H test of multiple regression statistic shows that inventory turnover (X2) has positive effect to dependent variable (profitability) with significance value equal to 0.00 with significance value smaller than level of significance 0.05 or 5% specified in this research. The results of this study are in accordance to hypothesized premises. The results of this study are in accordance with Diana PA (2016). The higher the inventory turnover the more liquid the sale of goods or products and the more profits the company gains and vice versa.
The more liquid the inventory indicates the faster the item is sold to the consumer. On the other hand, the faster the inventory turnover, the more cost savings, especially the storage and other costs. With the smaller the cost of inventory, the faster it sells and the faster the company converts the inventory into cash. Thus, the greater the opportunity to gain profit and the greater the likelihood of the company in allocating profits to shareholders in the form of dividends or greater return on equity (ROE). The greater the ROE indicates the greater the profitability of the share capital or the greater the company's ability to generate profits for shareholders. Conversely, the longer or lower the inventory turnover the longer the goods are in the warehouse, the longer the goods are not sold, the longer the company gets the cash back and the lower the company in generating profit, especially profit for shareholders or Return on equity (ROE) which is a proxy of profitability.
Hypothesis 3 (H3) states that liquidity has a positive effect on profitability. Partial statistical test results or t test uses multiple regression shows significance value of 0.065 and greater than the level of significance 0.05 used in this study and with a positive direction. Significance value of 0.065 indicates that the results of research on liquidity variables have no effect on the profitability of the company. The size of the liquidity has nothing to do with the company's ability to generate profits for shareholders projected with Return on Equity (ROE). Liquidity itself is defined as the ability of companies to pay short-term debt that will mature both to external parties and internal companies (Kasmir, 2012).
e-ISSN: 2477-5282 p-ISSN: 2599-3127
and Wartini (2012). Other actions of the company when liquidity is high due to high sales volume, high sales one of which is due to the promotion of the company is right on target (Lestari VNS, 2017; Setiawan M.I., et al., 2018)
Conclusion
The emphasis in this study is profitability or ability of the company to gain profits, especially profits for shareholders as measured by return on equity (ROE). Three (3) independent variables that affect the profitability of companies using variables of working capital consist of cash conversion cycle, inventory turnover and liquidity. The result of the research shows that inventory turns have a positive effect on profitability and in accordance with the hypothesized. It shows the higher inventory turnover, the higher sales, the lower the costs in mainly inventory cost and therefore the higher the profits. The more profits gained the greater the company's ability to allocate shareholder profits.
Cash conversion cycle variables show significant but negative direction that is not in accordance with the direction of the hypothesis. So the results of this study do not support hypothesis. This shows that while cash conversion cycle is high but the return on equity of shareholders is low. This is likely to be caused by the company prioritizing internal funding in the investment compared to external funds. This is in accordance with the principle of pecking order theory which discusses the priority of funding by taking into account the cost of capital from each source of funds. Liquidity variable and proxies with quick ratio in this research do not have significant effect with positive direction with profitability. This indicates that current assets outside the inventory can cover up completely from short-term debt owned by the company. The amount of short-term and long-term debt obligations that will mature relatively small when compared with the amount of current assets beyond inventory. Another possibility is sales results can be quickly converted into cash. Thus, the high ability of the company to generate profits for shareholders is not influenced by the high level of liquidity.
Limitations
Limitation in this study is the use of independent variables that is relatively low, small role or contribution of these variables in explaining the dependent variable or profitability. Future research should be extended to the independent variables in order to play a larger role in explaining the dependent variable.
Acknowledgment
The authors in this paper express his/her gratitude to the God for giving spirit in writing. I also thank my institution UPN "Veteran" East Java which provides an extensive opportunity for writers in developing and applying the science of financial management in research.
REFERENCES
Hasna, N. A., Nizarudin, B., & Sugeng, W. (2018). Financial Performance Measurement Of With Signaling Theory Review On Automotive Companies Listed In Indonesia Stock Exchange, 1(2), 167–177.
Yuniningsih, Y. (2012). Insider Ownership, Free Cash Flow dan Dividend Policy Perusahaan Manufaktur Terdaftar Di BEJ. Jurnal Riset Ekonomi & Bisnis, 8(1), 20–25.
Yuniningsih, Y. (2017). Seberapa Besar Kepemilikan Saham Berperan Dalam Penentuan Nilai Perusahaan Dengan Tinjauan Agency Theory. Jurnal Darussalam: Jurnal Pendidikan, Komunikasi
Dan Pemikiran Hukum Islam, 9(1), 107–115.
Yuniningsih, Y., Widodo, S., & Wajdi, M. B. N. (2017). Entrepreneurship and Business Development, Volume 1, Number 2. 2018. ISSN. 2597-4785 (online). ISSN: 2597- 4750 (Printed). Economic:
e-ISSN: 2477-5282 p-ISSN: 2599-3127
Ashraf C.K (2012). The Realtionship between working capital efficiency and profitability. Journal of Accounting and Management Vol 2 No 3.
Brigham dan Houston, 2006. Fundamental of Financial Management: Dasar-Dasar Manajemen Keuangan. Edisi 10. Jakarta. Salemba Empat.
Bhunia A. (2010). Financial Performance of Indian Pharmaceutical Industry-A Case study. Asian Journal of Management Research ISSN 229-3795.
Bagh T, et al., .2016. The impact of working capital management on Firms Financial Performance: Evidence from Pakistan. International Journal of Economics and Financial Issues, ISSN: 2146-4138, 2016, 6(3), 1097-11-5
Donaldson, G. 1961. Corporate Debt Capasity: A study of corporate debt policy and the determination of corporate debt capacity. Boston , Division of research, Harvard Graduate Shool of Business Administration.
Diana P.A . 2016). Pengaruh perputaran kas, pihutang, persediaan terhadap profitabilitas pada perusahaan Semen di BEI. Sekolah tinggi ilmu ekonomi Indonesia (STIESIA) Surabaya. Jurnal Ilmu dan Riset Manajemen. Volume 3, Nomer 3, Maret 2016
Ghozali, 2011. Aplikasi Analisis Multivariat dengan Program SPSS. Badan Penerbit Universitas Diponegaoro. Semarang.
Gujarati. 2006. Dasar-dasar Ekonometrika. Erlangga. Jakarta.
Harahap. 2008. Analisis kritis atas laporan keuangan. Jakarta: PT. Raja Grafindo Persada.
Hapsari Y.P .2012. Analisis pengaruh pengelolaan modal kerja terhadap kinerja keuangan pada perusahaan manufaktur yang terdaftar di bursa efek Indonesia (BEI) tahun 2012. Program studi manajemen, Fakutas Ekonomi dan Bisnis, Universitas Muhammadiyah Surakarta. Hanafi,M., and Halim, A.1995. Analisis Laporan Keuangan, Edsi Revisi. UPP AMP YKPN.
Yogyakarta. 1995
Kasmir. 2010. Pengantar Manajemen Keuangan. Jakarta: Kencana Pranada Media Group. Kasmir (2012) Analisis Laporan Keuangan. PT. Raja Grafindo Persada, Jakarta
Khan, F.N. 2013. Impact of Capital Structure on Firm Financial Performance: A Case of The Pakistani Engineering Firms Listed On KSE. University of Sargodha Sub-Campus Bhakkar.
Kumaraswamy.2016. Impact of Working Capital on Financial Performance of Gulf Cooperation Council Firms, International Journal of Economics and Financial Issues, ISSN: 2146-4138, 2016, 6(3), 1136-1142. Department of Economics and Finance, College of Business Administration, University of Bahrain, Kingdom of Bahrain.
Lestari, VNS. 2017. Analisis Rasio Keuangan untuk menilai keuangan pada PT. Indofood Sukses Makmur, Tbk, Di Bursa Efek Surabaya (BES) Periode 1988-2002.INA-Rxiv, 2017
Lestari, VNS. 2017. Analisis Faktor-faktor promosi dalam usaha untuk meningkatkan volume penjualan. INA-Rxiv, 2017
Myers, Stewart C. 1977. Determinants of Corporate Borrowing. Journal of Financial Economics. No. 5. Pp 145-175.
Munawir. 2002. Analisis Laporan Keuangan. Yogyakarta. Liberti.
Munawir. 2004. Analisis Laporan Keuangan. Edisi ke 4. Liberty Yogyakarta. Munawir. 2010. Analisa Laporan Keuangan. Yogyakarta: Liberti.
Mandiefe S.P. 2016. How Working Capital affect the profitability of commercial bank: case of afriland Cameroon. TTRECED-CAMEROON, University of Yaounde II, SOA
Oktavia S. 2015. Pengaruh Indikator Pengelolaan Modal Kerja dan Ukuran Terhadap Profitabilitas. SEkolah Tinggi Ilmu Ekonomi Perbanas Surabaya.
Putri, N., S. E., Safitri, dan T Wijata. 2015. Pengaruh Leverage, Ukuran Perusahaan, perputaran Modal Kerja dan Likuiditas. Jurnal STIP MDP.3(1):1-15
e-ISSN: 2477-5282 p-ISSN: 2599-3127
Syarief and Wilujeng. 2009. Cash conversion Cycle dan Hubungan dengan Ukuran Perusahaan, Profitabilitas dan Manajemen Modal Kerja. Jurnal Ekonomi dan Bisnis. Tahun 14 Nomor 1 Maret 2009
Subramayam. 2010. Analisis Laporan Keuangan . Jakarta . Salemba Empat.
Surya S, Ruliana R, Soetama D.R. 2017. Pengaruh Perputaran Kas dan Perputaran Persediaan Terhadap Profitabilitas. Akuntabilitas: Jurnal Ilmu Akuntansi. Volume 10(2), Oktober 2017. P-ISSN:1979-858X: E-ISSN:2461-1190. Page 313-332.
Tunggal, Wijata Amin (1995). Dasar-Dasar Analisis Laporan Keuangan. Jakarta: Rineka Cipta.
Ulum,MM and Hartono U. 2017. Pengaruh Cash Conversion Cycle, Inventory turnover, Average {ayment Period, Cash Turnover dan Leverage terhadap profitabilitas perusahan (study pada perusahaan sector trade, Service dan investment periode 2012-2015). Jurusan Manajemen, Fakultas Ekonomi, Universitas Surabaya.
Walker. 2001. Exploring the Human Capital Contribution to Productivity, Profitability and the Market Evaluation of the firm, available on :http://wwwlib.umi.com/dissertations
Wibowo, A and S Wartini. 2012. Efisiensi Modal Kerja, Likuiditas dan Leverage terhadap Profitabilitas pada Perusahaan Manufktur Di BEI. Jurnal Dinamika Manajemen 3(1):49-58 Yuniningsih, Y., Hasna, N. A., Nizarudin, B., & Sugeng, W. (2018). Financial Performance
Measurement Of With Signaling Theory Review On Automotive Companies Listed In Indonesia Stock Exchange, Journal of Entrepreneurship and Business Development, Volume 1, Number 2. 2018. ISSN. 2597-4785 (online). ISSN: 2597- 4750 (Printed). 1(2), 167–177.
Yuniningsih, Y. (2012). Insider Ownership, Free Cash Flow dan Dividend Policy Perusahaan Manufaktur Terdaftar Di BEJ. Jurnal Riset Ekonomi & Bisnis, 8(1), 20–25.
Yuniningsih, Y. (2017). Seberapa Besar Kepemilikan Saham Berperan Dalam Penentuan Nilai Perusahaan Dengan Tinjauan Agency Theory. Jurnal Darussalam: Jurnal Pendidikan, Komunikasi
Dan Pemikiran Hukum Islam, 9(1), 107–115.
Yuniningsih, Y., Widodo, S., & Wajdi, M. B. N. (2017). Entrepreneurship and Business Development, Volume 1, Number 2. 2018. ISSN. 2597-4785 (online). ISSN: 2597- 4750 (Printed). Economic: