PENERAPAN BUSINESS INTELLIGENCE
SEBAGAI PENGHASIL PENGETAHUAN
UNTUK MENDUKUNG
STRATEGI MARKETING BINUS UNIVERSITY
Fendy Heryanto, Benedictus Steven Agre, Johanes Budi
Gunawan, Suparto Darudiato
BINUS University, Jalan K.H. Syahdan No. 9 Kemanggisan/Palmerah, Jakarta Barat, Indonesia, (021) 535 0660/(021) 530 0244,Fendi_Heryanto@yahoo.com
Abstrak
Penelitian dilakukan pada Binus University divisi marketing. Yang bertujuan untuk melakukan identifikasi kebutuhan informasi dan pengetahuan serta permasalahan yang dihadapi divisi marketing yang berkaitan dengan pengambilan keputusan untuk perencanaan strategi. Setelah kebutuhan teridentifikasi, tujuan selanjutnya adalah membangun sistem informasi Business Intelligence yang mampu menghasilkan informasi dan pengetahuan strategis yang mendukung pengambilan keputusan divisi marketing untuk meningkatkan jumlah student intake. Dalam penelitian ini dilakukan analisis kebutuhan informasi dan proses bisnis yang berjalan, agar dapat menentukan kebutuhan informasi dan model sistem yang tepat. Pembangunan Business Intelligence menggunakan arsitektur Independent Data Marts yang mengolah data transaksional menjadi pengetahuan dan dikelompokkan dalam mart-mart tertentu. Pembangunan Business Intelligence ini menghasilkan informasi dan pengetahuan seperti KPI student intake, cost and student intake comparison, maupun forecasting student intake. Dengan adanya informasi dan pengetahuan yang dihasilkan, maka divisi marketing Binus akan mudah dalam mengambil keputusan untuk melakukan perencanaan strategi dalam rangka meningkatkan jumlah student intake.(J) Kata Kunci : Business intelligence, sistem informasi, independent data mart, marketing
Pendahuluan
Perusahaan-perusahaan kini tengah berusaha melakukan terobosan-terobosan IT untuk menciptakan suatu solusi yang dapat mengatasi data-data perusahaan dalam volume yang besar (Ferguson, 2013). Perusahaan menginginkan setiap data dapat memiliki nilai dan memberikan suatu informasi dan pengetahuan baru yang bermanfaat. Oleh karena itu kesuksesan dalam menjalankan bisnis tidak disebabkan oleh faktor bagaimana cara mengoperasikan bisnis saja, akan tetapi ada faktor-faktor lain yang mendukung bagaimana bisnis dapat berhasil.
Salah satu kunci kesuksesan bisnis terletak pada pendayagunaan data yang dimiliki perusahaan dimana data tersebut digunakan untuk kepentingan bisnis sehari-hari (I-Hsien & Yu-Cheng, 2011). Salah satu hasil dari pemrosesan data yaitu kemampuan informasi atau pengetahuan yang dapat digunakan untuk memprediksi fakta dalam lingkungan bisnis. Hal ini membuat kita mampu melakukan tindakan proaktif dibandingkan hanya reaktif. Data membantu kita mengoperasikan bisnis secara optimal, yaitu dengan cara diolah melalui teknik dan teknologi sehingga menghasilkan informasi dan pengetahuan yang mendukung pengembangan market share dan meningkatkan customer share. Permasalahannya adalah bagaimana cara mendapatkan informasi dan pengetahuan yang berguna bagi bisnis perusahan dari data yang dimiliki.
Sebagai salah satu universitas yang memiliki misi untuk menjadi “world class university”, BINUS University berusaha untuk terus berkembang dan mengungguli universitas lain yang ada di Indonesia. BINUS University merupakan salah satu penyedia jasa pendidikan tingkat atas. Tingginya
tingkat persaingan dengan universitas lain, menjadi tantangan tersendiri bagi BINUS untuk melakukan pengembangan dan peningkatan teknologi yang sudah ada agar mampu meningkatkan performa dari BINUS University. Selain pengembangan sistem dan kurikulum pendidikan, pengembangan di sisi lain seperti bagian marketing juga perlu di tingkatkan. Marketing merupakan salah satu ujung tombak dari sebuah perusahaan dalam memperkenalkan produk kepada konsumen dalam hal ini tentunya adalah calon mahasiswa, karena selain dinilai dari kualitas mahasiswanya perguruan tinggi juga dilihat dari segi banyaknya jumlah mahasiswa itu sendiri. Sistem yang berjalan pada marketing BINUS masih belum mampu menghasilkan suatu informasi maupun knowledge yang dapat digunakan untuk mendukung level manajer dalam pengambilan keputusan dan perencanaan strategi.
Berdasarkan tantangan yang dihadapi divisi marketing BINUS dibutuhkan sebuah alat yang mampu menyediakan pengetahuan dan informasi secara cepat dan tepat untuk mendukung para manajer tingkat atas dalam mengambil keputusan dan perencanaan bisnis yang strategis. Business Intelligence mampu menjawab kebuuhan dengan menampilkan laporan dari hasil-hasil analisis dan pengolahan data dalam bentuk grafik yang dibuat khusus untuk memenuhi kebutuhan level manajer seperti tampilan student intake trend, analisis media promosi, persebaran jurusan per-tiap provinsi, serta business forecasting berkaitan dengan forecasting jumlah student intake , maka user dari level manajer akan mendapatkan banyak informasi dan pengetahuan yang bersifat strategis yang bermanfaat untuk pengambilan keputusan dan perencanaan strategi bisnis. Dengan dibangunnya konsep dan sistem business Intelligence pada marketing diharapkan mampu mengoptimalkan performa serta mampu menentukan keputusan yang tepat dalam pembuatan strategi melalui informasi dan pengetahuan yang dihasilkan oleh business Intelligence itu sendiri.
Ada beberapa ruang lingkup yang akan di bahas, yaitu 1.Melakukan analisis dan perancangan business intelligence pada BINUS University yang berfokus pada pendukung keputusan untuk strategi marketing BINUS University, 2 Pembuatan dashboard berbasis web untuk menampilkan laporan berupa informasi-informasi dan pengetahuan yang strategic dalam bentuk graphic dan chart sehingga mudah untuk dilihat, dipahami, dan digunakan untuk mendukung proses pengambikan keputusan dan perencanaan strategi, dan 3. Implementasi business intelligence pada divisi marketing BINUS University yang mendukung user untuk merencanakan strategi guna meningkatkan jumlah mahasiswa baru dan mengukur performa strategi marketing yang ada.
Tujuan yang ingin dicapai dalam penelitian business intelligence pada BINUS University adalah 1. Mengidentifikasi kebutuhan informasi dan permasalahan yang di hadapi dalam pengambilan keputusan strategi marketing pada BINUS University, 2. Merancang aplikasi business intelligence yang dapat mendukung pengambilan keputusan dan perencanaan strategi marketing dengan mampu memberikan informasi dan pengetahuan strategis dalam rangka mendukung peningkatan jumlah student intake, serta mengukur performa strategi marketing yang digunakan.
Metode Penelitian
Dalam penulisan Skripsi ini ada beberapa metode yang digunakan, antara lain : Metode Pengumpulan Data, Metode Analisis, dan Metode Perancangan.
Metode Pengumpulan data yang digunakan adalah : 1 Pengumpulan data dilakukan dengan melakukan wawancara dengan pihak marketing manager dan pihak-pihak terkait dengan tujuan untuk mengetahui permasalahan yang dihadapi perusahaan, kebutuhan informasi seperti apa yang dibutuhkan seorang marketing manajer dalam pengambilan keputusan. 2 Penyebaran kuesioner digunakan untuk mendapatkan data yang akan digunakan dalam analisis penerimaan teknologi business intelligence yang dibuat. Analisis yang digunakan adalah TAM (Technology Acceptance Model). 3. Studi Pusta dilakukan dengan mengumpulkan informasi dari media-media kepustakaan seperti buku, artikel, dan jurnal yang berkaitan dengan topik business intelligence dan data warehouse yang dapat dijadikan bahan referensi dalam penulisan karya ilmiah.
Metode analisis dilakukan dengan tujuan untuk mengumpulkan data dan informasi. Pengumpulan data dan informasi dilakukan dengan teknik sebagai berikut : 1. Analisis kebutuhan informasi dilakukan dengan melakukan analisis data yang telah diperoleh dari hasil wawancara. 2. Analisis proses bisnis berjalan pada bagian Marketing dilakukan dengan penggambaran rich picture. Data flow diagram digunakan untuk mendapatkan input, proses, dan output pada bagian tersebut. Sedangkan ERD digambarkan agar dapat menganalisis struktur database perusahaan. Dari hasil analisis ini akan digunakan untuk menjadi dasar perancangan.
Metode perancangan yang digunakan untuk merancang business intelligence dibagi menjadi : 1. Perancangan dimensional modeling yang akan dipakai untuk pembuatan idependent data mart yang merupakan sumber data business intelligence. 2. Pembuatan query-query yang sesuai untuk kebutuhan laporan. 3. Perancangan tampilan antar muka dalam bentuk dashboard.
Hasil dan Bahasan
Model Arsitektur Pengembangan
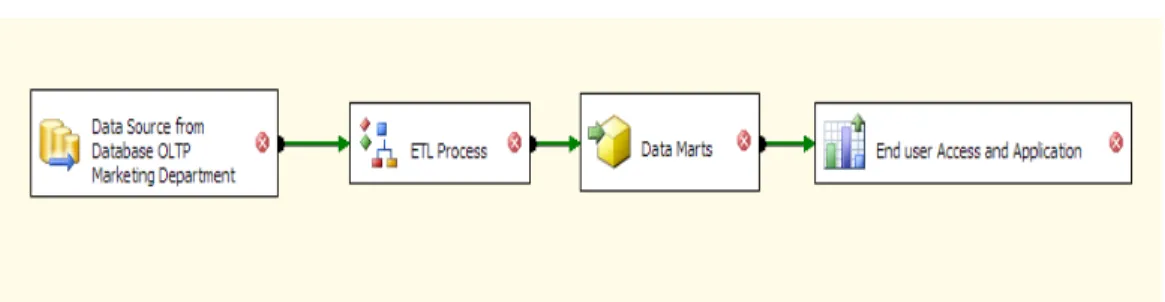
Gambar 1- Independent Data Marts Architecture
Gambar 1 merupakan independent data marts architecture yang digunakan sebagai pondasi dari konsep business intelligence yang akan diterapkan pada divisi marketing BINUS University. Dalam konsep arsitektur ini, data mart dikembangkan untuk beroperasi secara independen satu dengan yang lain. Arsitektur ini menggunakan independent data mart yang dibangun secara spesifik untuk menyediakan kebutuhan data guna mendukung analisis bisnis yang diperlukan oleh end user application. Sumber data diambil dari database OLTP marketing yang ada kemudian ditarik dan dilakukan proses ETL kemudian dikelompokkan menjadi data mart yang independen dan spesifik. Data mart di sini dapat bersifat atomic atau summarized data, sehingga kemudian langsung dapat dilakukan proses querying data melalui DBMS SQL Server 2008 R2 dan dikoneksikan ke aplikasi dashboard yang telah dikembangkan untuk menghasilkan visualisasi laporan-laporan ataupun informasi yang dibutuhkan oleh bagian marketing BINUS University.
Arsitektur independent data mart ini dipilih karena sesuai dengan kriteria yang dibutuhkan oleh konsep businesss intelligence yang akan diterapkan pada divisi marketing BINUS di mana menggunakan independent data mart yang spesifik untuk mendukung proses analisis dan penghasilan informasi yang akurat. Berikut merupakan penjelasan dari proses arsitektur independent data mart yang akan diterapkan : a) Data source berperan sebagai sumber data utama yang dibutuhkan untuk mendapatkan data-data
yang diperlukan yaitu didapat dari database OLTP marketing.
b) sistem yang sedang berjalan. OLTP ini berisi data-data pada operational database misalnya seperti dbo.StudentProfile berisi data-data mahasiswa baru yang masuk ke BINUS, dbo.HighSchool berisi data-data sekolah asal dari mahasiswa, dbo.Competitor berisi data-data mengenai pesaing dari BINUS, dan masih banyak data-data lain yang dibutuhkan untuk proses ETL selanjutnya. Data operasional pada OLTP ini bersifat transactional dimana dapat dilakukan modifikasi untuk keperluan proses bisnis yang berlangsung.
c) ETL process merupakan proses yang dibutuhkan untuk melakukan pengekstrakan sumber data (extract) dari sumber data operasional OLTP marketing kemudian mengubah bentuk format data (transform) dan melakukan pembersihan data terhadap data yang tidak dibutuhkan (cleansing) lalu dikirimkan (loading) ke sumber data tujuan yaitu marts-marts independen.
d) Independent Data mart berfungsi sebagai fasilitas penyimpanan data yang berorientasi subjek. Setelah proses ETL dilakukan, maka dihasilkan data yang telah siap untuk disimpan dan diolah kembali pada data marts yang diorganisasikan dengan dimensional model yaitu star-schema. Seperti pembangunan Student Intake data mart dengan penerapan model student intake star-schema. Untuk menghasilkan suatu summary dari data-data yang dimiliki perlu dilakukan proses querying pada marts-marts yang tersedia, misalkan untuk menghasilkan summary jumlah total student intake BINUSIAN 2013 maka dibutuhkan proses select query yang memotong 2 digit pertama dari data studentID kemudian dilakukan rows calculate sehingga didapatkan total dari jumlah student intake mahasiswa BINUSIAN 2013. Pengembangan business intelligence pada
marketing BINUS membutuhkan tidak hanya satu data marts melainkan beberapa data marts yang digunakan untuk mendukung kebutuhan-kebutuhan analisis bisnis lebih lanjut.
e) End user access and application yang akan digunakan pada divisi marketing BINUS ini adalah suatu web-based application yang dikembangkan dengan teknologi HTML5, jQuery, dan PHP. Web-based application disini berfungsi sebagai user interface atas hasil analisis dan pengolahan data yang memberikan visualisasi dalam bentuk chart, graphic, table, serta bentuk-bentuk lain kepada system user. Dengan adanya penarikan data dari data marts ke bentuk visualisasi yang bersifat user friendly, maka diharapkan aplikasi ini mampu mendukung pengambilan keputusan atau penentuan strategi dari pihak pengguna divisi marketing BINUS.
Data Mart Business Intelligence Marketing
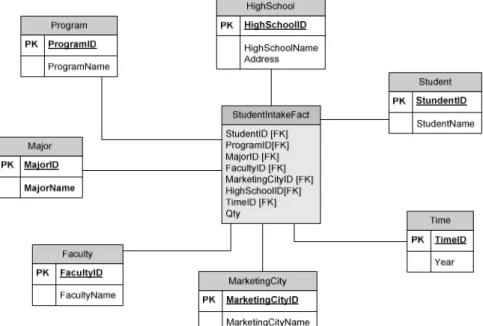
Perancangan data mart yang dibangun khusus untuk memenuhi kebutuhan data, berikut ini adalah rancangan skema bintang untuk data mart :
Gambar 2-Skema Bintang Student Intake Fact
Gambar 3-Skema Bintang Target Fact
Gambar 5-Skema Bintang UniversityIntakeFact
Gambar 6-Skema Bintang Competitors Fact
Gambar 7-Skema Bintang Favorite Major Fact
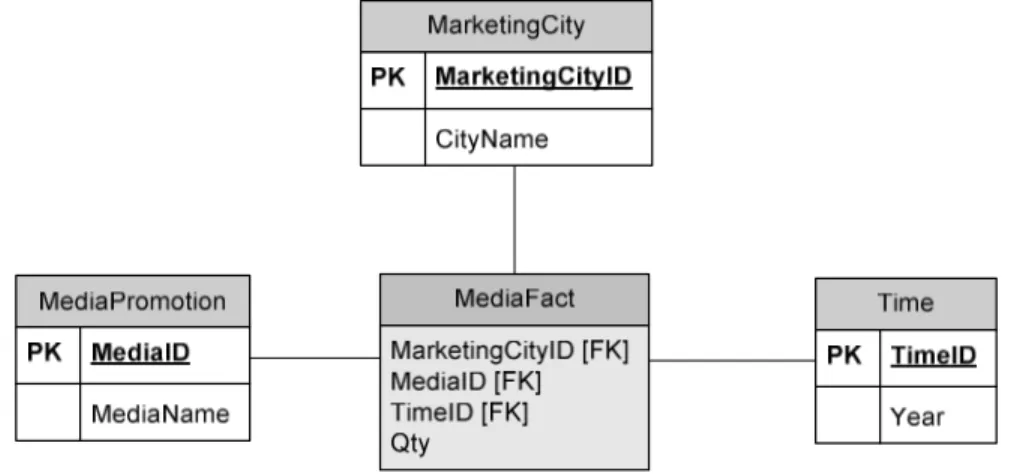
Gambar 8-Skema Bintang Media Fact Rancangan Layar Dashboard Business Intelligence
Rancangan Layar aplikasi ini berbentuk dashboard yang menampilkan informasi-informasi dengan tujuan mempermudah general manager dalam menganalisis informasi yang dibutuhkan. Dalam memberikan informasi rancangan dashboard menggunakan tampilan peta, diagram (barchart, linechart, dan piechart), dan tabel. Sebagian besar dari dashboard yang dibuat memiliki fitur untuk mampu melakukan drill down dan pop up information untuk mendukung penyampaian informasi yang lebih lengkap.
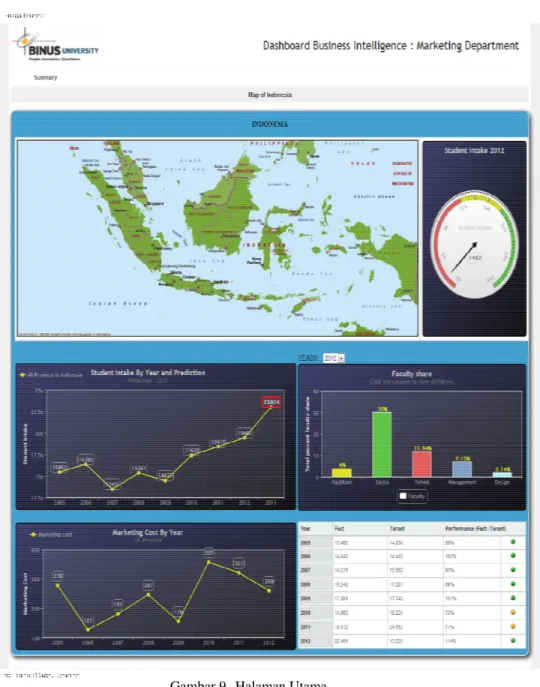
Gambar 9-Halaman Utama
(Gambar 9) merupakan halaman utama dimana terdapat beberapa dashboard yang menyajikan informasi kepada general manager. Berikut merupakan penjelasan detail dari bagian-bagian yang ada pada Halaman Utama :
1. Map of Indonesia
Pada dashboard ini menampilkan peta Indonesia dimana area ini merupakan pasar dari marketing BINUS. Peta Indonesia ini terbagi-bagi atas area-area provinsi-provinsi yang ada di Indonesia. Pada tampilan ini dashboard menyajikan informasi kepada pengaksesnya besar student intake pada tahun terakhir.
Peta Indonesia yang telah terbagi atas area provinsi-provinsi, dapat di klik dan akan masuk kehalaman utama ke-2 (dua) yang menampilkan secara khusus informasi-informasi provinsi yang dipilih. Untuk informasi-informasi yang dapat diperoleh dari proses ini, akan dijelaskan pada bagian-bagian selanjutnya.
2. KPI Student Intake
Key Performance Indicator Student Intake ini merupakan dashboard berbentuk gauge yang memaparkan performa dari Student intake pada tahun terakhir. Area dari intake yang ada pada KPI of Student intake adalah area seluruh Indonesia.
Gauge KPI Student Intake ini memiliki 3 bagian warna yang menjadi indikator, yaitu merah, kuning, dan hijau. Batasan untuk pengukuran performa yang menjadi batas antara warna merah dan warna kuning ditentukan berdasarkan target dari jumlah Stundent Intake yang telah ditentukan oleh bagian marketing. Sedangkan antara merah dan kuning ditentukan berdasarkan 75% nilai dari target.
3. Student Intake By Year and Prediction
Student Intake By Year and Prediction merupakan dashboard berbentuk linecart yang memaparkan jumlah dari Student Intake per tahun. Dengan dashboard ini, user dapat melihat perkembangan dari Student Intake yang terjadi selama beberapa tahun terakhir. Di akhir grafik, akan ditampilkan prediksi jumlah intake pada tahun berikutnya. Penentuan dari prediksi ini ditentukan menggunakan rumus tertentu dengan melihat data-data intake tahun-tahun sebelumnya. Berikut merupakan penjelasan dari diagram :
- Sumbu x adalah rentetan tahun. Jumlah dari rentetan ini adalah 9 tahun yang terdiri dari 8 tahun terakhir dan 1 tahun yang akan datang.
- Sumbu y adalah jumlah besaran mahasiswa. - Nilai prediksi diambil dari :
Hasil nilai forecasting dari Student Intake seluruh Indonesia dikalikan dengan persentase Student Intake BINUS pada tahun terakhir.
4. Faculty Share in Indonesia
Faculty Share in Indonesia merupakan dashboard berbentuk drilldown barcart yang memaparkan persentase dari intake per-fakultas pada tahun tertentu dengan area se-Indonesia. Tahun ini dapat dipilih sesuai dengan yang diinginkan user. Dengan melihat dashboard ini, dapat diketahui persentase dari intake pada tahun tertentu per-fakultas. User dapat meng-klik bar pada fakultas tertentu yang dapat menampilkan dashboard lain untuk melihat informasi major share dari fakultas yang dipilih.
Berikut merupakan penjelasan dari diagram :
- Sumbu x adalah rentetan fakultas-fakultas yang ada pada binus. - Sumbu y adalah persentase dari intake.
5. Major Share in Indonesia
Major Share in Indonesia merupakan dashboard berbentuk drilldown barcart yang muncul setelah User meng-klik bar pada fakultas tertentu. Bentuk dan struktur pada dashboard ini mirip dengan Faculty Share in Indonesia. Hanya informasi yang ditampilkan bukan fakultas, tetapi jurusan-jurusan yang merupakan jurusan yg ada pada fakultas yang telah dipilih sebelumnya.
6. Marketing Cost by Year
Marketing Cost by Year merupakan dashboard berbentuk linecart yang memaparkan nominal dari pengeluaran yang dikeluarkan pertahunnya. Dengan dashboard ini, user dapat melihat biaya pengeluaran marketing pertahun serta grafik dari marketing cost yang terjadi selama beberapa tahun terakhir.
Berikut merupakan penjelasan dari diagram :
- Sumbu x adalah rentetan dari 8 tahun terakhir dari hari ini ini. - Sumbu y adalah nominal dari cost yang dikeluarkan.
7. Performance Table
Performance Table merupakan tabel yang menunjukan performa dari student intake selama 8 tahun terakhir. Dengan melihat tabel ini, user dapat melihat jelas baik jumlah student intake, target, serta performa dari student intake selama beberapa tahun terakhir. Kolom-kolom yang ada pada tabel tersebut adalah sebagai berikut: 1. Year (tahun student intake), 2. Fact (jumlah dari student intake), 3. Target (target dari student intake), 4. Performance (persentase jumlah student intake dibandingkan dengan target intake).
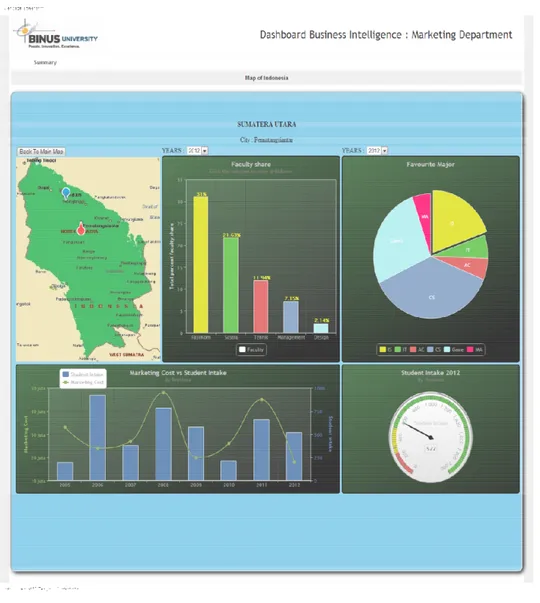
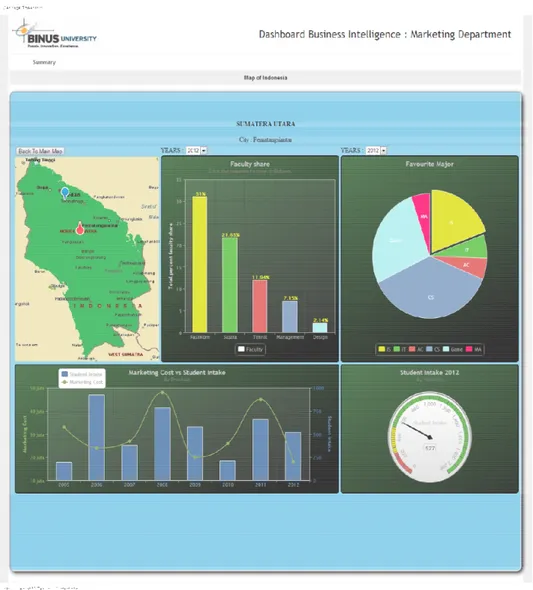
Gambar 10-Halaman Kedua
Halaman Kedua merupakan halaman yang akan muncul ketika user meng-klik provinsi tertentu pada peta indonesia di halaman awal. Gambar diatas merupakan susunan dari halaman kedua dimana terdapat beberapa dashboard yang menyajikan informasi kepada general manager. Berikut merupakan penjelasan detail dari bagian-bagian yang ada pada Halaman Kedua :
1. Map of Province
Pada dashboard ini menampilkan peta provinsi yang telah di klik pada peta Indonesia. Di dalam peta provinsi ini menampilkan kota-kota yang telah ada Ujian Saringan Masuk BINUS. Dalam peta ini, ditampilkan data-data sebagai berikut :
- Marketing Cost Tahun terakhir, Target Student Intake terakhir. - Student Intake tahun terakhir.
- Jumlah kompetitor dan persentase BINUS pada provinsi tersebut. - Sekolah-sekolah yang menjadi target pemasaran utama.
- Media Marketing yang paling efektif pada kota tersebut . - Favorit jurusan pada kota tersebut.
Untuk menampilkan informasi diatas, cukup mengarahkan mouse tepat diatas kota-kota yang telah diberi tanda. Dari beberapa informasi yang ditampilkan, ada beberapa informasi yang dapat
di klik untuk melihat data lebih detil. Adapun informasi tersebut adalah Kompetitor, Sekolah, serta Media Marketing.
2. Faculty Share in Marketing City
Faculty Share in Marketing City merupakan dashboard berbentuk drilldown barcart yang memaparkan persentase dari intake per-fakultas pada tahun tertentu dan dari kota tertentu. Diagram ini dilengkapi dengan pemilihan tahun untuk melihat data pada tahun-tahun sebelumnya. Dengan melihat dashboard ini, dapat diketahui persentase dari intake pada tahun tertentu per-fakultas. User dapat meng-klik bar pada fakultas tertentu yang dapat menampilkan dashboard lain untuk melihat informasi major share dari fakultas yang dipilih.
Berikut merupakan penjelasan dari diagram :
- Sumbu x adalah rentetan Fakultas-fakultas yang ada pada binus. - Sumbu y adalah persentase dari intake.
3. Major Share in Marketing City
Major Share in Marketing City Dashboard merupakan dashboard berbentuk drilldown barcart yang muncul setelah User meng-klik bar pada fakultas tertentu. Bentuk dan struktur pada dashboard ini mirip dengan Faculty Share in Marketing City. Hanya informasi yang ditampilkan bukan fakultas, tetapi jurusan-jurusan yang merupakan jurusan yg ada pada fakultas yang telah dipilih sebelumnya.
4. Favourite Major
Dashboard ini merupakan dashboard berbentuk piecart yang menampilkan jurusan-jurusan favorit pada kota yang dipilih. Jurusan ini bukan hanya sekedar orang-orang yang masuk ke binus, tetapi juga orang-orang yang masuk ke universitas-univertas lain. Dengan melihat dashboard ini, bagian marketing dapat mengetahui jurusan-jurusan favorit pada daerah itu yang memungkinkan marketing untuk dapat memilih strategi yang tepat dalam melakukan pemasaran. 5. Marketing Cost vs Student Intake
Marketing Cost vs Student Intake adalah dashboard yang menggambarkan marketing cost, serta student intake dari beberapa tahun terakhir. Dengan melihat dashboard ini, dapat terlihat dengan jelas perbandingan marketing cost dan student intake yang masuk, dapat dibandingkan juga dengan tahun-tahun lain, serta dapat terlihat jelas perkembangannya dari tahun ke tahun.
Berikut merupakan penjelasan dari diagram :
- Sumbu x adalah rentetan tahun dari 8 tahun terakhir. - Sumbu y sebelah kiri adalah marketing cost.
- Sumbu y sebelah kanan adalah jumlah student intake. 6. Key Performance Indicator Student
Key Performance Indicator Student Intake ini merupakan dashboard berbentuk gauge yang memaparkan performa dari student intake pada tahun terakhir. Area dari intake yang ada pada KPI Student intake ini adalah berdasarkan provinsi yang dipilih.
Gauge KPI Student Intake ini memiliki 3 bagian warna yang menjadi indicator, yaitu merah, kuning, dan hijau. Batasan untuk pengukuran performa yang menjadi batas antara warna merah dan warna kuning ditentukan berdasarkan target dari jumlah stundent intake yang telah ditentukan oleh bagian marketing. Sedangkan antara merah dan kuning ditentukan berdasarkan 75% nilai dari target.
Simpulan dan Saran
Berdasarkan dari seluruh rangkaian penelitian yang telah dilakukan, dapat diuraikan menjadi simpulan sebagai berikut :
1. Aplikasi Business Intelligence membantu dalam menghasilkan laporan, informasi, dan pengetahuan yang cepat, tepat, dan strategis bagi divisi marketing BINUS.
2. Merancang sebuah aplikasi Business Intelligence yang menampilkan kinerja dan performa marketing BINUS mengenai trend dari hasil student intake yang dikaitkan dengan usaha dan strategi yang diterapkan marketing BINUS sehingga mendukung user dalam pengambilan keputusan.
3. Aplikasi Business Intelligence menyajikan informasi dan pengetahuan yang bernilai dan dikemas dalam bentuk sederhana serta mudah dimengerti user dengan menggunakan visualisasi bar chart, line chart, dan pie chart.
4. Aplikasi Business Intelligence yang dirancang dalam bentuk web based dapat diakses oleh seluruh user dari marketing BINUS, sehingga dapat memenuhi kebutuhan informasi tanpa terbatas ruang dan waktu.
Berikut adalah beberapa saran yang dapat di berikan untuk mendukung pengembangan lebih lanjut dari sistem ini :
1. Pengembangan aplikasi Business Intelligence agar dapat melakukan analisis lebih mendalam mengenai informasi-informasi eksternal seperti jumlah penduduk daerah dan jumlah siswa per-sekolah.
2. Mengembangkan cakupan dari implementasi Business Intelligence untuk dapat mencakup ke bidang-bidang lain seperti mengukur performa tim marketing hingga ke penjualan formulir.
3. Menambahkan fitur otomatisasi data update tanpa harus melakukan manual update sehingga implementasi Business Intelligence menjadi real time.
Daftar Pustaka
[1]Ariyachandra, T., & Watson, H. J. (2006). Which Data Warehouse Architecture Is Most
Successful. Business Intelligence Journal , 4-6.
[2]Bennett, S., McRobb, S., & Farmer, R. (2010). Object-Oriented Systems Analysis and
Design Using UML (4th ed.). United Kingdom: McGraw-Hill.
[3]Bishop, B. W., Mandel, L. H., & McClure, C. (2011). Geographic Information Systems
In Public Library Assessment. 1-18.
[4]Chonoles, M. J., & Schardt, J. A. (2003). UML 2.0 for Dummies. Wiley Publishing, Inc.
Connolly, T., & Begg, C. (2010). Database Systems : A practical Approach to Design,
Implementation, and Management (5 ed.). (A. Wesley, Ed.) US.
[5]Coronel, C., Morris, S., & Rob, P. (2010). Database Systems Design, Implementation,
and Management. US: Course Technology Cengage Learning.
[6]Davis, F. (1989). Perceived Usefulness, Perceived Ease of Use, and User Acceptance of
Information Technology. MIS Quarterly , 319-339.
[7]Ferguson, R. B. (2013). The Big Deal About a Big Data Culture (and Innovation). MIT
Sloan Management Review , 1-5.
[8]Inmon, W. H. (2005). Building the Data Warehouse. US: Wiley.
[9]I-Hsien, T., & Yu-Cheng, L. (2011). What is Missing? Using Data Mining Techniques
with Business Cycle Phases for Predicting Company Financial Crises. Asia Pacific
Management Review , 1-8.
[10]Kimball, R., Ross, M., Becker, B., Mundy, J., & Thornthwaite, W. (2010). The Kimball
Group Reader : Relentlessly Practical Tools for Data Warehousing and Business
Intelligence. Canada: Wiley.
[12]Kripanont, N. (2006). Using Technology Acceptance Model to Investigate Academic
Acceptance of the Internet. journal of Business Systems, governance and Ethics , 13-26.
[13]Kroenke, D. M., & Auer, D. J. (2012). Database Processing : Fundamentals, Design,
and Implementation. US: Pearson.
[14]Mathiassen, L., Munk-Madsen, A., Nielsen, P. A., & Stage, J. (2000). Object Oriented
Analysis and Design. US: Marko.
[15]Miller, D. (2007, September). SourceMedia. Retrieved January 2013, from Source
Media webside: http://www.information-management.com
[16]O'Brien, J. A., & Marakas, G. M. (2009). Management Information Systems (9th ed.).
New York: McGraw-Hill.
[17]Pilone, D., & Pitman, N. (2005). UML 2.0 in a Nutshel. USA: O'Reilly Media.
[18]Ramos A., Layton R. (2009). Key Performance Indicators [KPIs] For Search Engine
Marketing. (1st Edition). USA: McGraw-Hill Companies, Inc.
[19]Rouse, M. (2005, November). definition/OLTP. Retrieved 2012, from About
TechTarget, Inc.: http://searchdatacenter.techtarget.com/definition/OLTP
[20]Satzinger, J., Jackson, R., Burd, S. (2004). Object-Oriented Analysis and Design with
the Unified Process. USA: Course Technology.
[21]Satzinger, J., Jackson, R., Burd, S. (2010). Systems Analysis and Design in a Changing
World. USA: Course Technology.
[22]Scheps S. (2008). Business Intelligence for Dummies . (1st Edition). Indiana: Wiley
Publishing, Inc.
[23]Stair, R. M., & Reynolds, W. G. (2010). Principles of Information Systems a
Managerial Approach. (9th, Ed.) USA: Course Technology.
[24]Stone, M. L. (1998).The Utility of Geographic Information System (GIS) and Spatial
Analysis In Tuberculosis Surveillance in Harris County.Public Health and GIS Researcher,
Center for Health Policy Studies, 1-22.
[25]Team, I. (n.d.). iDashboard company. Retrieved November 2012, from iDashboard
company web site: www.idashboard.com
[26]Turban, E., Rainer, R. K., Potter, R. E., & Cegielski, C. G. (2010). Introduction to
Information Systems : Enabling and Transforming Business. US: Wiley.
[27]Turban, E., Sharda, R., & King, D. (2011). Business intelligence : A managerial
Approach. (2nd, Ed.) Pretice Hall.
[28]Williams, B., & Sawyer, S. C. (2011). Using Information Technology: A Practical
[29]Whitten, J. L., Bentley, L. D., & Dittman, K. C. (2004).
System Analysis and Design
IMPLEMENTATION OF BUSINESS
INTELLIGENCE AS KNOWLEDGE
PRODUCER TO SUPPORT MARKETING’S
STRATEGY AT BINUS UNIVERSITY
Fendy Heryanto, Benedictus Steven Agre, Johanes Budi
Gunawan, Suparto Darudiato
BINUS University, Jalan K.H. Syahdan No. 9 Kemanggisan/Palmerah, Jakarta Barat, Indonesia, (021) 535 0660/(021) 530 0244,Fendi_Heryanto@yahoo.com
Abstract
The research was conducted at Binus University marketing division. Which aims to identify the needs of information and knowledge as well as the problems faced by the decision-making in marketing division related to strategic planning. Once the needs are identified, the next goal is to build Business Intelligence information system that capable to generating information and knowledge to support decision-making in strategic marketing division to increase the number of student intake. In this research, analysis of information needs and business processes are being analyzed, in order to determine the information needs and appropriate system model. Development of Business Intelligence architecture using Independent Data Marts that process transactional data into knowledge and grouped in certain marts. This resulted in the development of Business Intelligence information and knowledge such as KPI student intakes, cost comparison and student intake, as well as forecasting student intake. With the information and knowledge generated, it will be easy for Binus marketing division in the makes decision to undertake strategic planning in order to increase the number of student intake. (J)
Keywords: Business intelligence, information systems, independent data marts, marketing
Introduction
Nowaday the companies are trying to make IT-breakthroughs to create a solution that can address the organization’s data in a large volume (Ferguson, 2013). Every company wants every single data have a value and provide a new information and useful knowledge to company. Therefore success in running a business is not caused by how to operate your business, but there are other factors that support how businesses can succeed.
One of the key for business success lies in the utilization of company’s data held where the data is used for day-to-day business interests (I-Hsien and Yu-Cheng, 2011). One of the results of the data processing capabilities of information or knowledge that can be used to predict the facts in a business environment. This enables us to undertake proactive measures than just reactive. Data helps our business operate optimally, by processed through techniques and technologies to produce information and knowledge to support the development of market share and increase customer share. The problem is how to get the information and knowledge that is useful to the business of the company that owned the data.
As one of the university's mission is to be a "world class university", Binus University seeks to continue to grow and outperform other universities in Indonesia. Binus University is one of the top-level provider. The high level of competition with other universities, a challenge for BINUS to undertake the development and improvement of existing technologies in order to improve the performance of Binus University. In addition to the development of the education system and curriculum, the development on
the other side as part of marketing also needs to be improved. Marketing is one of the spearheads of a company in introducing the product to the consumer in this case certainly is a prospective student, except assessed because of the quality of the college students are also viewed in terms of the large number of students themselves. The system runs on marketing BINUS still not able to produce an information and knowledge that can be used to support the level of managers in decision-making and planning strategies.
Based on the challenges facing marketing division BINUS needed a tool that is able to provide knowledge and information quickly and accurately to support the top-level managers in decision making and strategic business planning. Business Intelligence is able to answer everything company needed by displaying a report of the results of the analysis and processing of data in the form of graphs that are made specifically to meet the needs of student-level managers such as intake trend display, analysis of the media campaign, the distribution of majors per each province, as well as business-related forecasting forecasting number of student intake, the user of level managers will get a lot of information and knowledge that is useful for strategic decision making and business strategy planning. With the construction of the concept and business intelligence systems on marketing is expected to optimize the performance and be able to determine the right decision in making strategies through information and knowledge generated by the business itself Intelligence.
There is some scope that will be discussed, namely 1.Melakukan analysis and design of business intelligence at Binus University that focuses on decision support for marketing strategy Binus University, 2 Making web-based dashboard to display the report in the form of information and strategic knowledge in the form of graphic and chart making it easy to view, understand, and are used to support the decision process pengambikan and planning strategies, and 3. Implementation of business intelligence at Binus University marketing department that supports the user to plan a strategy to increase the number of new students and measuring the performance of an existing marketing strategy.
Objectives to be achieved in business intelligence research at Binus University is 1. Identify information needs and problems faced by the marketing strategy decision at Binus University, 2. Designing a business intelligence application that can support decision making and planning marketing strategies to be able to provide strategic information and knowledge in order to support the increasing number of student intake, as well as measuring the performance of marketing strategies used.
Methodology
In writing this thesis there are several methods that are used, among other things: Data Collection Methods, Methods of Analysis and Design Methods.
Data collection methods used were: 1 The data was collected by conducting interviews with the marketing managers and stakeholders in order to find out the problems faced by the company, such as what information needs required a marketing manager in decision making. 2 The spread of the questionnaire used to obtain data to be used in the analysis of business intelligence technology acceptance are made. Analysis is used TAM (Technology Acceptance Model). 3. Pusta study conducted by collecting information from the media library such as books, articles, and journals related to the topic of business intelligence and data warehouse that can be used as reference material in the writing of scientific papers.
The method of analysis was conducted to collect data and information. Data collection and information carried by the following techniques: 1. Information needs analysis is done by analyzing the data that has been obtained from interviews. 2. Analysis of business processes running in the Marketing done by describing the rich picture. Data flow diagrams are used to get the input, process, and output in that section. While ERD described in order to analyze the structure of the company database. From the results of this analysis will be used for a basic design.
Design method is used to design business intelligence is divided into: 1. Dimensional modeling design that will be used for the manufacture of independent data mart which is the data source business intelligence. 2. Making appropriate queries for reporting needs. 3. The design of the display interface in the form of the dashboard.
Result and explanation
Architecture Development ModelPicture 1- Independent Data Marts Architecture
Picture 1 is independent of data marts architecture is used as the foundation of the concept of business intelligence that will be applied to the marketing division of Binus University. In the concept of this architecture, the data mart is developed to operate independently from one another. This architecture uses independent data marts are built specifically to provide data to support the needs of business analysis required by the end user application.
Sources of data extracted from the OLTP database marketing are then drawn and carried ETL process then grouped into independent data marts and specific. Data mart here can be atomic or summarized data, so then the process can be done directly querying data through DBMS SQL Server 2008 R2 and connected to a dashboard application that has been developed to generate visualizations reports or information required by the marketing Binus University.
Architecture independent data marts have been due in accordance with the criteria required by the businesss intelligence concepts to be applied on marketing division BINUS where using independent data marts to support specific analytical process and income information is accurate. The following is an explanation of the independent data mart architecture that will be implemented:
a) The data source acts as the primary data source is required to obtain the necessary data are obtained from OLTP database marketing.
b) The system is running. The OLTP contains data such as the operational database contains data dbo.StudentProfile new students coming into BINUS, dbo.HighSchool contains data from the original school students, dbo.Competitor contains data about competitors from BINUS, and there are many other data needed for the next ETL processes. Operational data on this OLTP transactional nature which can be modified for the purposes of ongoing business processes. c) ETL process is a process required to perform the extraction of data sources (extract) from
operational data sources OLTP marketing then change the format of data (transform) and perform data cleansing on data that is not needed (cleansing) and delivered (loading) to the data source goal-marts are marts independently.
d) Independent data marts serve as a storage facility subject-oriented data. After the ETL process is done, the resulting data is ready to be stored and processed back to the data marts are organized with dimensional models of star-schema. As the construction of the Student Intake data mart application of the model student intakes star-schema. To produce a summary of the data held on the querying process needs to be done marts-marts are available, for example to produce a summary total student intake is required BINUSIAN 2013 select query process that cuts the first 2 digits of the data rows calculate StudentID then performed to obtain the total number of student intake of students BINUSIAN 2013. Development of business intelligence at marketing BINUS requires not only one data marts but some data marts are used to support the business needs further analysis.
e) End user access and application that will be used in the marketing division BINUS This is a web-based application that was developed with HTML5, jQuery, and PHP. Web-based application here serves as the user interface on the analysis and processing of data which provide visualization in the form of charts, graphics, tables, and other forms to the system user. With the withdrawal of data from the data marts into a form of visualization that is user friendly, it is expected that the application is able to support the decision or determination of the strategy of the marketing division BINUS users.
Data Mart Business Intelligence Marketing
Designing data marts are built specifically to meet the needs of the data, the following is a draft for the star schema data mart:
Picture 2- Student Intake Fact Star Schema
Picture 3- Target Fact Star Schema
Picture 4- Cost Fact Star Schema
Picture 6- Competitors Fact Star Schema
Picture 7- Favorite Major Fact Star Schema
Picture 8- Media Fact Star Schema
User Interface Design of Business Intelligence Dashboard
The design of this application form dashboard screen that displays information in order to facilitate the general manager in analyzing the information needed. In providing design information dashboard using the map view, diagram (barchart, linechart, and PieChart), and tables. Most of the dashboard that is made has a feature to be able to drill down and pop-up information to support the delivery of more complete information.
Picture 9-Halaman Utama
(Picture 9) is the main page where there is a dashboard that presents information to the general manager. The following is a detailed explanation of the parts are there in the Home :
1. Map of Indonesia
On the dashboard which displays a map of Indonesia is a market area of marketing BINUS. Indonesia map is divided over areas of the provinces in Indonesia. In this view dashboards present information to large pengaksesnya student intake in the last year.
Map of Indonesia has been divided into provinces area, you can click and it will go to the main kehalaman-2 (two) that displays information specifically selected provinces. For information that can be obtained from this process will be explained in later sections.
2. IBC Student Intake
Key Performance Indicators Student Intake is shaped dashboard gauge that describes the performance of Student intake in the last year. Area of the existing intake on the KPI of Student intake is the area around Indonesia.
Student Intake KPI gauge has 3 parts to the indicator color, namely red, yellow, and green. Limits for performance measurement to be the boundary between the red and yellow color is determined based on the target of a number of Stundent Intake determined by the marketing. While between the red and yellow are determined based on 75% of the target value.
3. Student Intake By Year and Prediction
Student Intake By Year and Prediction is linecart shaped dashboard that presents the number of Student Intake per year. With this dashboard, users can see the progress of the Student Intake that occurred during the last few years. At the end of the graph, the amount of intake predictions will be shown next year. Determination of these predictions is determined using a specific formula to look the intake data of previous years. The following is an explanation of the diagram:
- The x-axis is a series of years. The number of rounds is 9 years consisting of the last 8 years and 1 year to come.
- The y axis scale is the number of students. - Value prediction is taken from:
Results of Student Intake forecasting value throughout Indonesia multiplied by the percentage of Student Intake BINUS last year.
4. Faculty Share in Indonesia
Faculty Share in Indonesia drilldown barcart is shaped dashboard that presents the percentage of intake per-faculty in certain areas in Indonesia. This year can be selected according to the desired user. By looking at the dashboard, it can be seen the percentage of intake in a given year per-faculty. Users can click on the bar that can display certain faculty another dashboard to see the major share information from selected faculty.
The following is an explanation of the diagram: - The x-axis is a series of existing faculties on BINUS. - The y axis is the percentage of intake.
5. Major Share in Indonesia
Major Share in Indonesia drilldown barcart is shaped dashboard that appears after a user clicking a particular bar on the faculty. The shape and structure of the dashboard is similar to the Faculty Share in Indonesia. Only the information displayed is not the faculty, but the majors are the majors that no faculty who have been previously.
6. Marketing Cost by Year
Marketing Cost by Year is shaped dashboard that exposes linecart nominal expenditure incurred annually. With this dashboard, users can see the annual marketing expenses as well as graphs of marketing costs that occurred during the last few years.
The following is an explanation of the diagram: - The x-axis is a series of 8 years from today's. - The y axis is the nominal of the cost incurred. 7. Performance Table
Performance Table is a table that shows the performance of the student intake over the last 8 years. By looking at this table, the user can clearly see a good number of student intake, the target, as well as the performance of the student intake over the last few years. Existing columns in the table are as follows: 1. Year (year student intake), 2. Fact (number of student intake), 3. Target (target of student intake), 4. Performance (percentage of intake compared with the target student intake).
Gambar 10-Halaman Kedua
The second page is the page that will appear when the user clicks on a particular province on Indonesia map on the home page. Pictured above is an arrangement of the second page where there are several dashboard that presents information to the general manager. The following is a detailed explanation of the parts are there on Page Two:
1. Map of Province
On the dashboard that displays a map of the province have clicked on a map of Indonesia. In the province map showing the cities that have no entrance exam BINUS. In this map, display the data as follows:
- Marketing Cost last year, Target Student Intake final. - Student Intake last year.
- The number and percentage BINUS competitors in the province. - The schools are a prime marketing target.
- Media Marketing is the most effective in the city. - Favorites majors in the city.
To display the above information, simply point your mouse just above the cities that have been marked. Of some information is displayed, there is some information that can be clicked to view the data in more detail. The information that is competitor, School, and Media Marketing.
2. Faculty Share in Marketing City
Faculty Share in Marketing City is shaped dashboard drilldown barcart which describes the percentage of intake per-faculty in particular and of the particular city. This diagram comes with the election year to see the data in previous years. By looking at the dashboard, it can be seen the percentage of intake in a given year per-faculty. Users can click on the bar that can display certain faculty another dashboard to see the major share information from selected faculty.
The following is an explanation of the diagram: - The x-axis is a series of existing faculties on BINUS. - The y axis is the percentage of intake.
3. Share in Marketing Major City
Major Share in Marketing City Dashboard is shaped dashboard drilldown barcart that appears after user clicking a particular bar on the faculty. The shape and structure of the dashboard is similar to the Faculty Share in Marketing City. Only the information displayed is not the faculty, but the majors are the majors that no faculty who have been previously.
4. Favourite Major
This dashboard is shaped dashboard that displays piecart favorite majors in the city selected. School is not just the people who go into BINUS, but also the people who go to university-University other. By looking at the dashboard, the marketing departments can find your favorite in the area that allows marketing to be able to choose the right strategy in marketing.
5. Marketing Cost vs. Student Intake
Marketing Cost vs. Student Intake is a dashboard that describes the marketing costs, as well as the student intake of the last few years. By looking at the dashboard, one can clearly see the cost comparison of marketing and incoming student intake, also can be compared with other years, and can be seen clearly progress from year to year.
The following is an explanation of the diagram: - The x-axis is a series of 8 years last year. - The y axis left is marketing cost.
- The right y-axis is the number of student intake. 6. Key Performance Indicator Student
Key Performance Indicators Student Intake is shaped dashboard gauge that describes the performance of the student intake in the last year. Area of the existing intake on the KPI Student intake is based on the selected provinces.
Student Intake KPI gauge has a 3 piece color indicator, namely red, yellow, and green. Limits for performance measurement to be the boundary between the red and yellow colors of the target is determined based on the amount of intake stundent determined by the marketing. While between the red and yellow are determined based on 75% of the target value.
Conclusion
Based on a whole series of studies that have been done, can be broken down into the following conclusions:
1. Business Intelligence applications help in generating reports, information, and knowledge are fast, precise, and strategic marketing division BINUS.
2. Designing a Business Intelligence application that displays performance and marketing performance BINUS the trend of the results of student intake is associated with a business and marketing strategies adopted BINUS to support user in decision-making.
3. Business Intelligence Applications provide information and knowledge that is valuable and is packaged in a simple and easy to understand user by using visualization bar charts, line charts, and pie charts.
4. Business Intelligence applications are designed in the form of web based can be accessed by all users of marketing BINUS, so as to meet the information needs without limited space and time.
Here are some suggestions that can be given to support the further development of this system:
1. Business Intelligence application development in order to conduct more in-depth analysis of the external information such as the number of inhabitants per area and number of students per school. 2. Develop the scope of the implementation of Business Intelligence to be able to cover other areas
such as measuring the performance of marketing teams up to form sales.
3. Adding automation features of data updates without having to manually update so that the implementation of Business Intelligence to be real time.