THIS REPORT CONTAINS ASSESSMENTS OF COMMODITY AND TRADE ISSUES MADE BY USDA STAFF AND NOT NECESSARILY STATEMENTS OF OFFICIAL U.S. GOVERNMENT POLICY
Abundant rainfall, sufficient number of chill hours, and spring conditions are expected to remain favorable for fruit development while high temperatures and low relative humidity is expected in the summer of MY2017/18. Post forecasts apple exports to increase up to 780,000 MT or 4% in line with good climatic conditions and the recovery of production from MY 2016/17. Table grape exports are projected to remain flat and reach 733,000 MT following the steady production trend. Fresh pear exports are expected to increase by 3.3% and reach 155,000 MT since new orchards start production.
Sergio Gonzalez, Agricultural Specialist Marcela Rondon, Agricultural Attaché
Chilean Fresh Fruit Exports Remain Strong in MY 2017/18
Fresh Deciduous Fruit Annual
Chile
CI 1719
10/31/2017
Commodities:
Production:
MY 2016/17 apple planted area was 36,132 hectares (ha) and has remained steady around 36,000 ha in the last 10 years (see graph 1). 86% of apple planted area in Chile is in the central-south regions of Maule and O’Higgins which accounts for 22,025 ha and 9,155 ha respectively. Maule region has grown 0.5% between 2003 and 2016, while O’Higgins has decreased planted area by 0.8% (see graph 2).
In the southern regions of Araucania and Biobio, apple planted area has grown 5.3% and 0.8%, respectively between 2003 and 2016.
Apple production has been displaced from the region of O’Higgins to the southern regions of Chile (Biobio ad Araucania) due to higher water availability for irrigation, increased average temperatures and decrease in rainfall in the southern regions all of which have allowed for planting of fruits in areas where it was not possible before. In addition, the higher profits that cherry and walnut orchards have experienced in the last years have shifted the interest towards planting those crops in O’Higgins region.
The main challenges that the Chilean apple industry faces are renewing old orchards with new varieties to increase productivity, improving the condition that the fruit has to be exportable (i.e. cold storage potential) and increasing overall quality (color, taste, caliber and firmness).
MY2017/18 has presented good climatic conditions so far, rainfall has allowed for enough water accumulation in the reservoirs for irrigation and number chill hours during the winter were sufficient. Spring conditions are expected to remain favorable for fruit development, although summer is
expected to be dry and with high temperatures. Considering climatic conditions, production is projected to increase by 4% up to 1.35 million MT.
Source: ODEPA/CIREN
Consumption:
Post estimates that 60% of total apple production of apples is destined for exports. In general, fruit that does not comply with the quality requirements for export (i.e. caliber or color defects) is sold to the processing industry or for domestic consumption, where prices obtained are lower.
Post projects MY2017/18 domestic fresh consumption at 260,000 MT or 14.0 KG per capita. The official population estimate is 18,373,917 habitants in Chile for 2017 (National Statistics Institutes, INE).
Trade:
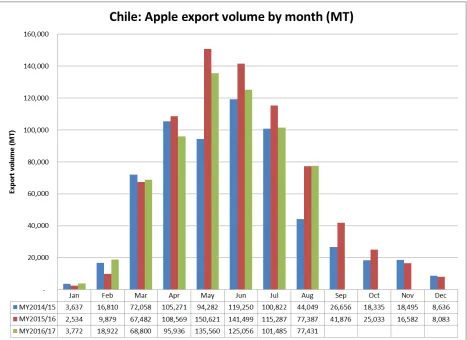
In MY2015/16 exports reached 764,883 MT, which represented a 22% increase over MY2014/15. Chilean apple exports are diversified and exported to many markets. The main market for Chilean apple exports is the United States, which holds a 14% market share followed by Colombia and Taiwan with 9% and 8% market share respectively.
In MY2016/17 (Jan- Aug) exports have reached 626,961 MT which represent a 7% decrease over MY2015/16. Chilean apple exports to the U.S. decreased by 17% in the same period while exports to Colombia have increased by 4% and 5% to Taiwan. In MY2016/17 apple exports are projected to reach 750,000 MT.
Table 1: Chile Export Statistics Commodity: 080810, Apples, Fresh
Partner Country
Quantity (MT) Share (%)
Variation (%) MY2015/16 (Jan-Aug) MY2016/17 (Jan - Aug) MY2016/17
World 673,259 626,961 100% -7%
United States 104,935 87,230 14% -17%
Colombia 56,483 58,652 9% 4%
Taiwan 49,353 52,029 8% 5%
Saudi Arabia 45,536 44,968 7% -1%
Netherlands 45,977 38,504 6% -16%
Peru 34,361 36,640 6% 7%
Ecuador 29,335 34,898 6% 19%
United Kingdom 26,808 27,970 4% 4%
Russia 20,592 26,702 4% 30%
India 32,189 24,102 4% -25%
Others 227,690 195,266 31% -14%
Partner Country
Quantity (MT) Share (%)
Variation (%)
MY2014/15 MY2015/16 MY2015/16
World 628,301 764,833 100% 22%
United States 78,290 105,039 14% 34%
Brazil 35,820 86,261 11% 141%
Colombia 75,593 76,392 10% 1%
Taiwan 39,332 49,899 7% 27%
Peru 43,715 47,894 6% 10%
Saudi Arabia 39,981 47,075 6% 18%
Netherlands 42,943 46,164 6% 8%
Ecuador 41,348 37,898 5% -8%
India 19,997 32,189 4% 61%
United Kingdom 25,373 27,150 4% 7%
Others 185,909 208,872 27% 12%
Source: Based in Servicio Nacional de Aduana, 2017.
Table 2. Production, Supply and Demand Data Statistics:
Apples, Fresh 2015/2016 2016/2017 2017/2018
Market Begin Year Jan 2016 Jan 2017 Jan 2018
Chile USDA Official New Post USDA Official New Post USDA Official New Post Area Planted 36,059 35,896 36,000 36,132 0 36,000 Area Harvested 33,600 33,400 33,500 33,600 0 33,500 Bearing Trees 38,900 38,900 38,000 39,000 0 38,950 Non-Bearing Trees 2,800 2,800 2,500 2,800 0 2,800 Total Trees 41,700 41,700 40,500 41,800 0 41,750 Commercial Production 1,325,000 1,325,000 1,400,000 1,300,000 0 1,350,000 Non-Comm. Production 10,000 10,000 10,000 10,000 0 10,000 Production 1,335,000 1,335,000 1,410,000 1,310,000 0 1,360,000
Imports 2,000 2,014 1,500 2,000 0 1,000
Total Supply 1,337,000 1,337,014 1,411,500 1,312,000 0 1,361,000 Fresh Dom. Consumption 252,200 252,131 255,000 255,000 0 260,000 Exports 764,800 764,883 800,000 750,000 0 780,000 For Processing 320,000 320,000 356,500 307,000 0 321,000
Withdrawal From Market 0 0 0 0 0 0
Total Distribution 1,337,000 1,337,014 1,411,500 1,312,000 0 1,361,000
(HA) ,(1000 TREES) ,(MT)
Commodities:
Production:
Table grape planted area has been declining since MY2008/09. Despite the decline, in MY2016/17 planted area reached 47,084 ha, which continues to make tables grapes the most planted fruit in Chile (see graph 4).
Table grape planted area in Chile is located in the central regions of O’Higgins, Valparaiso, and Metropolitana and also in the northern regions of Coquimbo and Atacama, which produce the earliest grapes (see graph 5). Planted area in the regions of O’Higgins, Metropolitana, and Coquimbo has decreased in the 2003-2016 period. Planted area in Atacama and Valparaiso has been steady in the same period.
In MY2016/17 producers in the northern regions faced low prices, led by an early harvest and an overlap in the supply with other countries (for more details see GAIN report). The planted area in the Atacama region remains steady at 7,743 ha, where there are not many alternatives to planting table grapes, but it decreased to 7,921 ha in Coquimbo region where planted area of other alternative crops like walnuts and olives have increased.
In the O’Higgins and Metropolitan regions, table grape reduction in planted area has also taken place in replacement of other fruits like walnuts, cherries, olives and pears.
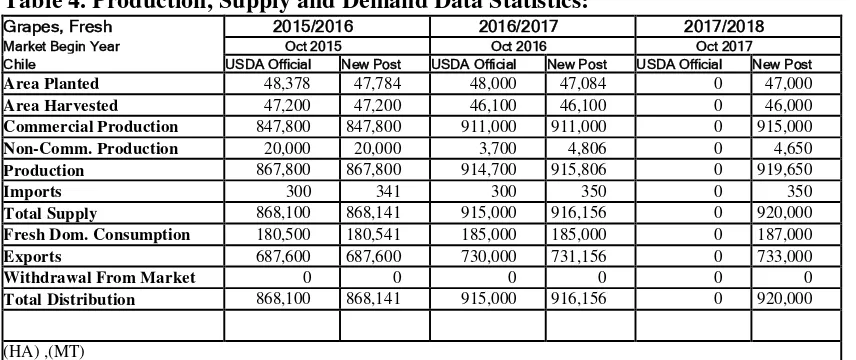
In MY 2016/17 high temperatures favored maturity and early fruit development during the spring and summer and table grape production reached 911,000 MT, which represented a 7.5% increase over the previous marketing year.
MY2017/18 is expected to have regular climatic conditions in regards to the timing of the harvest and the influence in average yields, thus production is expected to remain flat and reach 915,000 MT, considering a slight reduction trend in planted area.
Source: ODEPA/CIREN
Consumption:
62% of total table grape production is destined for fresh table grapes (911,000 MT in MY2016/17), 22 percent for raisins, 11 percent for juice production, and 5 percent for wine production. Post estimates that out of the fresh table grape production, 80% is exported and the remainder is domestic
consumption. In MY2017/18 consumption is expected to reach 187,000 MT which is equivalent to 10.2 kg per capita.
Trade:
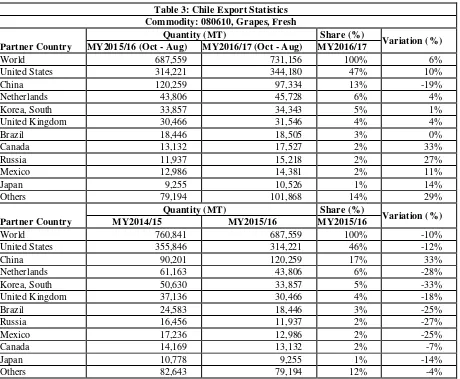
The main market destination for table grapes is the United States with 47% market share, which grew 10% in exported volume in MY2016/17.
Table grape exports increased by 6% in MY2016/17 over MY2015/16 and reached 731,156 MT.
The second top destination for Chilean table grape exports is China, with a 13% market share, but volume exported decreased by 19% in MY2016/17. Fruits exported to China travels 30 days, which is longer than the 14 days it takes to reach the United States from Chile.
In MY 2016/17, high summer temperature impacted table grape quality condition, thus less fruit complied with China’s export requirements. Table grape exports normally peak in April, but in MY 2016/17 export volume peaked in March because of the early harvest (see graph 6).
The third largest market for Chilean table grapes is the Netherlands, with 6% market share and a 4% increase in volume in MY2016/17 over MY2015/16.
In MY2017/18 exports post expects to remain flat and reach 733,000 MT following the production trend.
Table 3: Chile Export Statistics Commodity: 080610, Grapes, Fresh
Partner Country
Quantity (MT) Share (%)
Variation (%) MY2015/16 (Oct - Aug) MY2016/17 (Oct - Aug) MY2016/17
World 687,559 731,156 100% 6%
United States 314,221 344,180 47% 10%
China 120,259 97,334 13% -19%
Netherlands 43,806 45,728 6% 4%
Korea, South 33,857 34,343 5% 1%
United Kingdom 30,466 31,546 4% 4%
Brazil 18,446 18,505 3% 0%
Canada 13,132 17,527 2% 33%
Russia 11,937 15,218 2% 27%
Mexico 12,986 14,381 2% 11%
Japan 9,255 10,526 1% 14%
Others 79,194 101,868 14% 29%
Partner Country
Quantity (MT) Share (%)
Variation (%)
MY2014/15 MY2015/16 MY2015/16
World 760,841 687,559 100% -10%
United States 355,846 314,221 46% -12%
China 90,201 120,259 17% 33%
Netherlands 61,163 43,806 6% -28%
Korea, South 50,630 33,857 5% -33%
United Kingdom 37,136 30,466 4% -18%
Brazil 24,583 18,446 3% -25%
Russia 16,456 11,937 2% -27%
Mexico 17,236 12,986 2% -25%
Canada 14,169 13,132 2% -7%
Japan 10,778 9,255 1% -14%
Others 82,643 79,194 12% -4%
Source: Based in Servicio Nacional de Aduana, 2017.
Source: Based in Servicio Nacional de Aduana, 2017.
Policy:
The Ministry of Agriculture, through SAG (Servicio Agrícola y Ganadero) continues to carry out the National Program for the control of the European grapevine moth (EGVM) or Lobesia botrana.
The strategy for MY 2017/18 considers:
1) Monitoring trough pheromone traps 2) Rural and urban control
3) Auditing internal quarantine actions
4) Develop and implement a communications plan
5) Supervise and support the National Research Plan by INIA
The National Program Goals include:
i) Contain, suppress and eradicate the plague:
- Contention and suppress strategy in Metropolitana, O’Higgins and Maule regions.
ii. Establish a monitoring network that allows knowledge on the distribution, absence and population of the plague.
iii. Establish quarantine actions that avoid dispersion of the plague.
iv. Give technical support through information and compliance of conditions stablished by the phytosanitary authorities in the country of destination to the SAG Sub-Department of
Phytosanitary certification. Additionally, provide the technical background in order to maintain or improve the entrance conditions of exported fruit products due to the presence of Lobesia botrana.
v. Auditing the compliance of SAG measures.
The control actions are mandatory for table grapes (Vitis vinifera) as a primary host from Atacama region (Copiapó province to the south) to Araucanía region.
Table 4. Production, Supply and Demand Data Statistics:
Grapes, Fresh 2015/2016 2016/2017 2017/2018
Market Begin Year Oct 2015 Oct 2016 Oct 2017
Chile USDA Official New Post USDA Official New Post USDA Official New Post Area Planted 48,378 47,784 48,000 47,084 0 47,000 Area Harvested 47,200 47,200 46,100 46,100 0 46,000 Commercial Production 847,800 847,800 911,000 911,000 0 915,000 Non-Comm. Production 20,000 20,000 3,700 4,806 0 4,650 Production 867,800 867,800 914,700 915,806 0 919,650
Imports 300 341 300 350 0 350
Total Supply 868,100 868,141 915,000 916,156 0 920,000 Fresh Dom. Consumption 180,500 180,541 185,000 185,000 0 187,000 Exports 687,600 687,600 730,000 731,156 0 733,000
Withdrawal From Market 0 0 0 0 0 0
Total Distribution 868,100 868,141 915,000 916,156 0 920,000
Chile’s pear planted area reached 9,146 ha in MY2016/17 and it has grown at a 4% average rate in the last 10 years (see graph 7). Pear planted area is located in O’Higgins and Maule regions, which hold 58% and 31% of plated area in MY2016/17 (see graph 8). In both regions, planted area has grown in the 2003-2016 period. Nevertheless, pear producers claim that they have had difficulty finding
profitable varieties and current prices for pears are low which has caused stagnation in production and exports.
The Packam’s triumph variety has been the most planted variety in the past, but now other varieties are being planted and tested in order to increase profits including Abate Fetel, Forelle and Coscia. To date, no new variety has increased profits dramatically.
Source: ODEPA/CIREN
Consumption:
Fresh pear domestic consumption is not expected to increase dramatically in the next years, the main variety consumed locally is Packam’s triumph, while other varieties like Abate Fetel are not too popular among Chileans. In MY 2017/18, Post expects domestic consumption to reach 84,600 MT and 4.6 KG
per capita.
Trade:
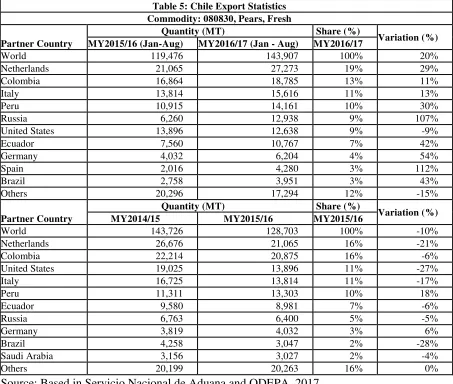
The main market for Chilean pears is the European Union (EU). In MY2016/17, 19% of the Chilean pears were exported to The Netherlands and 11% were exported to Italy (see table 5). Chilean pear exports compete with Argentinian, South African, and with European supply since post-harvest fruit life has increased with the use of new technologies.
Colombia is the second market for Chilean per exports with 13% market share in MY2016/17. In Russia, Chilean Abate Fetel pears have been a success, and 12,938 MT were exported in MY2016/17. China would likely grant market access for Chilean pears in the near future.
Table 5: Chile Export Statistics Commodity: 080830, Pears, Fresh
Partner Country
Quantity (MT) Share (%)
Variation (%) MY2015/16 (Jan-Aug) MY2016/17 (Jan - Aug) MY2016/17
World 119,476 143,907 100% 20%
Netherlands 21,065 27,273 19% 29%
Colombia 16,864 18,785 13% 11%
Italy 13,814 15,616 11% 13%
Peru 10,915 14,161 10% 30%
Russia 6,260 12,938 9% 107%
United States 13,896 12,638 9% -9%
Ecuador 7,560 10,767 7% 42%
Germany 4,032 6,204 4% 54%
Spain 2,016 4,280 3% 112%
Brazil 2,758 3,951 3% 43%
Others 20,296 17,294 12% -15%
Partner Country
Quantity (MT) Share (%)
Variation (%)
MY2014/15 MY2015/16 MY2015/16
World 143,726 128,703 100% -10%
Netherlands 26,676 21,065 16% -21%
Colombia 22,214 20,875 16% -6%
United States 19,025 13,896 11% -27%
Italy 16,725 13,814 11% -17%
Peru 11,311 13,303 10% 18%
Ecuador 9,580 8,981 7% -6%
Russia 6,763 6,400 5% -5%
Germany 3,819 4,032 3% 6%
Brazil 4,258 3,047 2% -28%
Saudi Arabia 3,156 3,027 2% -4%
Others 20,199 20,263 16% 0%
Source: Based in Servicio Nacional de Aduana and ODEPA, 2017.
Policy:
Table 6. Production, Supply and Demand Data Statistics:
Pears, Fresh 2015/2016 2016/2017 2017/2018
Market Begin Year Jan 2016 Jan 2017 Jan 2018
Chile USDA Official New Post USDA Official New Post USDA Official New Post Area Planted 8,646 8,810 8,900 9,146 0 9,300 Area Harvested 7,200 7,400 7,500 7,900 0 8,200 Bearing Trees 7,600 7,770 7,800 8,295 0 8,610 Non-Bearing Trees 1,400 1,480 1,500 1,308 0 1,155
Total Trees 9,000 9,250 9,300 9,603 0 9,765
Commercial Production 265,000 265,000 278,000 288,000 0 294,000 Non-Comm. Production 2,000 2,000 2,000 2,000 0 2,000 Production 267,000 267,000 280,000 290,000 0 296,000
Imports 600 600 600 600 0 600
Total Supply 267,600 267,600 280,600 290,600 0 296,600 Fresh Dom. Consumption 83,200 83,200 84,000 84,000 0 84,600 Exports 128,700 128,703 140,000 150,000 0 155,000 For Processing 55,700 55,700 56,600 56,600 0 57,000
Withdrawal From Market 0 0 0 0 0 0
Total Distribution 267,600 267,603 280,600 290,600 0 296,600