The influence of changes in forest management over the past 200 years
on present soil organic carbon stocks
Jana Wäldchen
⇑, Ernst-Detlef Schulze, Ingo Schöning, Marion Schrumpf, Carlos Sierra
Max Planck Institute for Biogeochemistry, Hans Knöll Str. 10, 07745 Jena, Germany
a r t i c l e
i n f o
Article history:Received 25 April 2012
Received in revised form 4 October 2012 Accepted 7 October 2012
Available online 28 November 2012
Keywords: Soil organic carbon Carbon stocks Light fraction Heavy fraction Forest management Historical forest management
a b s t r a c t
Forest ecosystems in Europe have been affected by human activities for many centuries. Here we inves-tigate, if current forest soil organic carbon stocks are influenced not only by present ecological conditions and land use, but also by land management in the past. Based on the forest management history of the Hainich-Dün region a total of 130 inventory plots were selected in age-class forest and selectively cut for-ests under present management practice. The age-class forest originated from (1) former coppice-with-standards, (2) former selectively cut forests and (3) afforestation. The selectively cut forest contains ‘‘early regulated’’ forest where selective cutting has been practised for centuries, and forest, which was managed as coppice-with-standards through the 18th and the 19th centuries. We hypothesise that past management influences present soil organic carbon stocks. Density fractionation of soils in three physical fractions (HF: heavy fraction, o-LF: occluded light fraction, f-LF: free light fraction) was carried out to increase the probability of detecting long-lasting effects of management history. No detectable differ-ences in soil organic carbon (SOC) stocks, as measured in kg m2ground area, of the mineral soil and
the heavy fractions, were found between present and historical forest management types (average total organic carbon (OC) stocks of mineral soil: 9.7 ± 2.3 kg m2; average OC stocks of the organic layer:
0.5 ± 0.3 kg m2; average total inorganic carbon (IC) stocks of mineral soil: 5.0 ± 3.7 kg m2). The
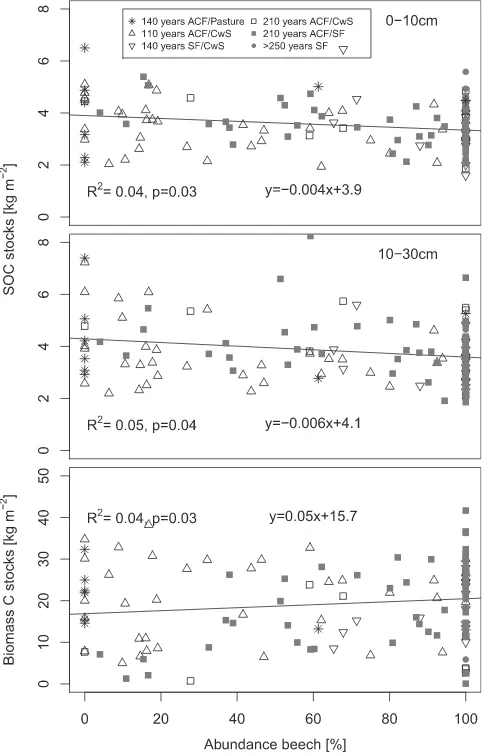
varia-tion of samples was overlapping. There was no consistent trend with management history. The upper mineral soil (0–30 cm) contained about 74% of total SOC, with f-LF contributing 24% in 0–10 cm and 20% in 10–30 cm, and o-LF 9% in 0–10 cm and 6% in 10–30 cm. The HF contained 85% (0–10 cm) and 86% (10–30 cm) of SOC stocks in the bulk soil. There was a significant decrease of total SOC stocks in the 0–10 and 10–30 cm depth increment with increasing abundance of beech. Mean14C concentrations
in the HF were 102.0 pMC in 0–10 cm, and 93.4 pMC in 10–30 cm, corresponding to a mean14C age of
around 100 years and 550 years, respectively. Modelling C-dynamics based on the present measurements reveals that disturbances depleting 50% of soil C-stocks would equilibrate after 80 years. Thus, there is no memory effect of 19th century forest management. We conclude that past and present management has no detectable effect on present SOC.
Ó2012 Elsevier B.V. All rights reserved.
1. Introduction
Forest use and management is generally thought to create ma-jor ecosystem disturbance comparable to natural events such as storms and forest fires (Buergi and Gimmi, 2007). Thus, there is a growing interest in quantifying land-use intensity (Luyssaert et al., 2011) and the effects of human activity on forest ecosystem structure and functioning. Most forest ecosystems in Europe have been affected by human activities for centuries. At present it is not clear how long major changes in land-use intensity persist, nor if there are ‘‘memory’’ signals of past land use in present forest soils.
Most studies about the historical influence of human activities on forest soils have been carried out with the aim of investigating the impact of afforestation and deforestation. These studies show that management practices introduced in the 19th and 20th centu-ries reduced soil organic carbon (SOC) stocks (Compton et al., 1998; Gragson and Bolstad, 2006; Guo and Gifford, 2002; Verheyen et al., 1999). Not only agricultural use, but also different types of forest management, by removing different amounts of biomass and timber could have affected soil organic carbon stocks (Jandl et al., 2007; Mund and Schulze, 2006).
The separation of soil organic matter (SOM) into physical fractions with different turnover times is expected to increase the probability of detecting historic management effects. The light fraction (LF) of organic matter consists of weakly decom-posed plant and animal tissues and is generally characterised
0378-1127/$ - see front matterÓ2012 Elsevier B.V. All rights reserved.
http://dx.doi.org/10.1016/j.foreco.2012.10.014
⇑ Corresponding author. Tel.: +49 3641 576213; fax: +49 3641 577102. E-mail address:[email protected](J. Wäldchen).
Contents lists available atSciVerse ScienceDirect
Forest Ecology and Management
by a rapid turnover of <10 years. The amount of organic carbon (OC) held in the light fraction is therefore controlled by the pres-ent forest managempres-ent. In contrast, the mineral associated or-ganic matter (or heavy fraction, HF) is stabilised through interaction with the mineral surfaces and characterised by turn-over times ranging from decades to centuries (Baisden et al., 2002; Crow et al., 2007; Ellert and Gregorich, 1995; Janzen et al., 1992; Six et al., 2002; Yamashita et al., 2006). Therefore if long-term effects of historical forest management exist, they should be visible in the HF fraction.
Forest management has changed from practices such as coppice forestry or coppice-with-standards, towards modern forestry, which aims at sustainable production of wood. To our knowledge, the effects of past forest management on present SOC stocks have not yet been studied.
There are historical reports that unregulated use of coppice and coppice-with-standards forest led to degradation of these stands (Hasel and Schwarz, 2006). Based on these reports of for-estry in the 18th and 19th century, we hypothesise that stands which experienced intensive wood extraction 100–200 years ago, still exhibit lower carbon stocks, especially in the mineral-associated heavy fraction of SOM. Following this initial hypothe-sis we argue that a former coppice-with-standards stand should now have lower SOC stocks than less intensively used, former selectively cut forests, where only single trees are cut and re-moved. In addition, stands where management changed from coppice-with-standards to a less intensive regime in the distant past should have higher SOC contents than stands where man-agement changed more recently. We assume that present SOC stocks are influenced not only by present, but also by historical forest management.
We investigate SOC stocks in bulk soil and in the different den-sity fractions in forest stands in Thuringia, Germany, where changes in forest management can be dated from the operational management plans of the forest administrations since 1800 (Wäldchen et al., 2011). Management has changed from coppice-with-standards forest into high forest; in comparison to forest stands, which were used for more than 250 years as high forests of continuous cover (selective cuttings).
The overall objective of this study is to quantify the influence of former and present forest management on the SOC stocks of the forests of the Hainich-Dün region, thereby enhancing the under-standing of the ecosystem processes that link forest management with changes in SOC stocks.
2. Materials and methods
2.1. Study sites
This study was conducted in the Hainich-Dün region of Thurin-gia, Germany (51°120N 10°180E). Elevations range from 100 to
494 m above sea level, the mean annual precipitation from 600 to 800 mm and the mean annual temperature from 6 to 7.5°C (average temperature in January:0.65°C and July 17.17°C). The parent material is Triassic limestone, which is covered by a Pleisto-cene loess layer of variable thickness (ca. 10–50 cm) at most sites. Main soil groups of the study area are Cambisols, Luvisols and Stagnosols (Grüneberg et al., 2010). The humus form (type of the organic layer) varied between L-mull and F-mull. The climate and soil conditions of the region provide optimum growing condi-tions for beech (Fagus sylvatica) dominated forests. Admixed tree species areFraxinus excelsior,Acer pseudiplatanusandAcer
platano-ides.Grasslands have been afforested with spruce (Picea abies) in
the past (Wäldchen et al., 2011).
2.2. Forestry history and forest management types
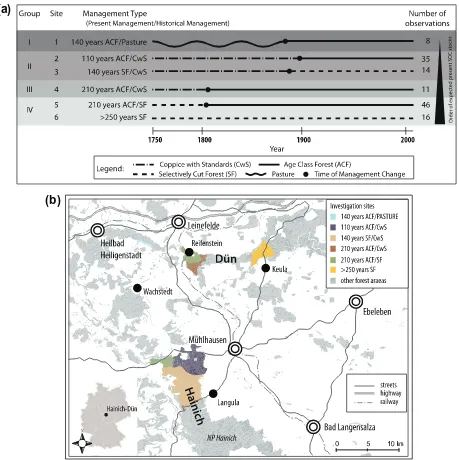
Our study is based on documented forest management changes between 1800 and 1900 (Fig. 1a). At the beginning of the 19th cen-tury, most of the forest sites in the Hainich-Dün region were under the coppice-with-standards system, a silvicultural system in which timber trees with an open canopy are grown above a coppiced woodland. Small areas of selectively cut forests were also present, with selective harvesting of single trees and irregular forest use. In the 19th century, all coppice-with-standards forests were con-verted to age-class forest or to selectively cut forest (Wäldchen et al., 2011). The forest under age-class management is character-ised by a sequence of relatively homogenous, even-aged stands. Coppice-with-standards management is no longer practiced in the Hainich-Dün region. However, remnants of coppice forest and coppice-with-standards forest still exist in other parts of Thu-ringia, being managed as historic reserves, but these sites grow on shallow Leptosols. In this study these sites were only used for leaf area index (LAI) measurements.
2.3. Plot selection
The experimental design is based on an initial estimate of the number of plots which would be needed to detect a certain differ-ence of carbon stocks between sites at a certain variation between samples (Minimum detectable difference approach (Zar, 1984)), based on known present soil carbon accumulation rates in this re-gion (Schulze et al., 2010). We estimated that 10–30 repetitions would be sufficient to detect 1 kg m2differences in the Ah, 0–10
and 10–30 cm depth increments between treatments, after 100 years carbon accumulation. This difference was expected to exist between management types 100–200 years ago.
The investigation plots were distributed across four forest dis-tricts, which had independent administrations and history. Thus, we are confident in having independent samples on six different forest sites, where four sites are managed today as age-class forest (ACF) and two sites are selectively cut forests (SF). The age-class forest comprised (1) 11 plots that were used as coppice-with-standards (CwS) until the beginning of the 19th century, (2) 35 plots that were used as coppice-with-standards until the beginning of the 20th century, (3) 46 plots that were used as selectively cut forests until the beginning of the 19th century and (4) 8 plots that were afforested (AF) in the second half of the 19th century. The two presently selectively cut forest sites contain ‘‘early regulated’’ for-est where selective cutting has been applied for centuries (16 plots), and forest that was used as coppice-with-standards forest in the 18th and 19th century (14 plots). Thus, in total 130 plots were sampled as shown inFig. 1a in an overview of the forest sites and their management histories. All study plots that belonged to the same forest type were located within an area of about 10– 20 km2. The distance between the forest sites in the south
(140 years SF/CwS) and the forest sites at the Dün (110 years ACF/CwS) was about 20 km (Fig. 1b).
sites which have been managed for more than 250 years as high forest.
2.4. Forest inventory, woody biomass, mean stand age, land use and disturbance index (LUDI)
At all 130 plots a forest inventory was carried out on circles with an area of 500 m2. For all trees with a diameter at breast height
(DBH)>7 cm, DBH, tree height and tree species were recorded. Thus, each inventory point yields information about stand density and diameter distribution. The conversion into wood volume follows allometric relationships, which include the shape of the forest trunk (Lockow, 2003; Gerold, 1977; Bergel, 1973). For the conversion of woody biomass into carbon pools, we assumed an average carbon concentration of 50% of dry weight (Wirth et al., 2003).
Mean stand age for all plots and management types was calcu-lated according toSchulze et al. (2012)(Eq.(1)), which is based on measured tree ages.
Age¼17:5þ2:6DBH
R2¼0:58; p<0:05 ð1Þ
To quantify the management intensity of these forests, the Land-Use and Disturbance Index, LUDIp was used (Luyssaert et al., 2011). This index quantifies the long-term management decision at which height and density this forest shall produce certain products. LUDIp is expressed in relation to the natural self-thinning line, and in relation to the stand density (N) of undisturbed pristine forests. For every plot LUDIp was calculated as (Eq.(2)):
LUDIp¼dAB=dmax100 ð2Þ
wheredABis the distance on the self-thinning line between any two pointsA andBwith stand densityNAandNB, anddmaxgives the
length of the self-thinning curve between Nmin andNmax (Nmin=
0.001 m2or 10 trees ha1, representing the lower boundary, and Nmax= 0.36 m2or 3600 trees ha1).
(a)
(b)
2.5. LAI measurements
LAI was measured with the LAI-2000 (LICOR, Lincoln, Nebraska, USA) on the following sites: 140 years ACF/Pasture (Group I), 210 years ACF/CwS (Group III)>250 years SF and 210 years ACF/SF (Group IV). Additionally, we measured the LAI on remnants of cop-pice forest (Tännreisig: 50°460N 11°30E, Hayn: 50°480N 10°540E)
and coppice-with-standards forest (Gottesholz: 50°460N 11°30E).
These three sites are not located in the Hainich-Dün region. 15 un-der-canopy measurements per site were taken to achieve an aver-age LAI for each location. A second LAI-2000 unit, cross-calibrated with the former, was used to automatically take ‘‘above-canopy’’’ readings from a nearby clearing or agricultural field.
2.6. Soil analysis
2.6.1. Soil sampling
At each sampling point the organic layers were sampled with a metal frame (20 cm20 cm). On each study plot soils were sam-pled down to the bedrock or 110 cm depth with a motor-driven soil column cylinder (Cobra, Eijkelkamp, 8.3 cm in diameter). Due to the significant effect of soil-types on SOC stocks (Batjes, 2002; Grüneberg et al., 2010) only Luvisols were considered for this study (WRB, 2006). The soil cores were divided into depth increments of 0–10, 10–30, 30–50, 50–70, 70–90, and 90–110 cm. Depending on the thickness of the Ah horizon, either the 0–10 cm or 10–30 cm layer was further divided into two parts to allow separate samples of the Ah-horizon.
2.6.2. Soil preparation and SOC analysis
Mineral soil samples were air-dried and sieved to <2 mm to re-move roots and stones. Dry root mass was measured. An aliquot of the soil sample was ground and analysed for total carbon and nitrogen by dry combustion with a C:N analyser ‘‘Vario Max’’ (Ele-mentar Analysensysteme GmbH, Hanau, Germany). Inorganic car-bon was determined by measuring the total amount of carcar-bon after removal of SOC by ignition of samples for 16 h at 450°C. SOC concentrations were calculated from the difference between total and inorganic carbon concentrations. SOC stocks (kg m2)
were calculated as the product of SOC concentration, the weight of the air-dried fine earth and its volume. Several interlaboratory tests by the Routine Measurements and Analyses (Roma) Depart-ment of the Max Planck Institute for Biogeochemistry have mea-sured a variation coefficient of <1% for OC concentration measurements.
2.6.3. Density fractionation
For all six study sites, five plots were randomly selected for measurement of the density fractionation of soil in the Ah-Horizon, 0–10 and 10–30 cm depth increment (in total, samples from 30 plots were fractionated). SOM was separated into a free light fraction (f-LF), an occluded light fraction (o-LF), and a mineral-associated fraction (or HF) following the procedure ofDon et al. (2007) in which 7–10 g air-dried soil (<2 mm) were placed in a centrifuge with 100 ml sodium polytungstate solution with a den-sity of 1.6 g cm3. The suspension was treated with an ultrasonic
beak (60 J ml1) to crack unstable macro-aggregates followed by
30 min in the centrifuge at 3000 rpm. The organic particles (f-LF), which were floating on the polytungstate solution, were trans-ferred to a glass fibre filter with a pipette. The remaining sample was treated again with an ultrasonic beak (450 J ml1) to separate
occluded organic matter from the mineral fraction. The sample suspension was centrifuged again (30 min at 3000 rpm). Floating particles of the o-LF were removed from the solution and trans-ferred to a glass fibre filter. To separate the heavy, mineral associ-ated fraction (HF) from the polytungstate solution, the remaining
sample was strongly stirred and centrifuged (90 min), where HF settled as pellets. Sodium polytungstate was removed from all fractions by washing with Millipore water. Samples were then freeze-dried. All density fractions were analysed for total and organic carbon, and total nitrogen, as described for the bulk soil.
2.6.4. Radiocarbon analysis
After density fractionation radiocarbon (14C) concentrations of
all HF fractions were determined with accelerator mass spectros-copy (AMS) in Jena, Germany (Steinhof et al., 2004). Ground sam-ples were combusted to CO2and a small part of the sample mass
was analysed for its stable carbon isotope ratio (d13C). The remain-ing major part of the CO2 was reduced to graphite by heating a
mixture of H2and CO2 with Fe powder at 650°C. The resulting
graphite-coated iron was pressed into targets and measured in the AMS facility for14C. The radiocarbon activity is expressed as
D14C, the difference in parts per thousand (‰) between the
14C/12C ratio in the sample compared to that of the standard oxalic
acid (Trumbore, 2009). All values were corrected for fractionation using thed13C values. The14C content was expressed in% modern C (pMC). The average error was 0.25 pMC. Radiocarbon ages were estimated using the OxCal program (Bronk, 2001) and the IntCal09 calibration curve (Heaton et al., 2009).
2.7. Statistics
Statistical analyses were performed in the R environment (R Development Core Team, 2011). All measured variables were first characterised by classical descriptive statistics (means and stan-dard deviation). Prior to analyses, we examined for normality by diagnostic Quantile–Quantile plots and the one-sample Kolmogo-rov–Smirnov procedure. Equality of variances was examined by the Levenes test. Not normally distributed data (SOC stocks in 10–30 cm) were log-transformed to achieve normal distribution. One-way ANOVA was used to compare study sites with different forest management history. We used an ANCOVA analysis to ex-plore the influence of different factors (forest stand characteristics, soil properties and management history) on SOC stocks in the bulk soil and in density fractions. Given the limited number of investi-gation plots (n= 130 for bulk soil and 25 for the different fractions), to avoid over-fitting we restricted the number of predictors in the full model to 10 (see Table 7) after removing highly correlated independent variables (multi-colinearity).
2.8. Modelling soil organic carbon recovery after management changes
To model SOC recovery after management changes in the 0– 10 cm depth increment, we used a single compartment model of the form:
dC
dt ¼IkC ð3Þ
whereCis the amount of carbon in the bulk soil,Iis the input of or-ganic carbon andkis the decay constant. We assumed that: (1) an-nual carbon inputs to SOC pools have been constant since management change, and (2) SOC pools are at a steady state (Inpu-t = Ou(Inpu-tpu(Inpu-t). Accordingly, (Inpu-thekconstant is calculated as follows:
k¼R
C ð4Þ
whereRis the heterotrophic respiration flux from the 0 to 10 cm depth increment per year. Respiration fluxes in soils of the Hainich region in 0–10 cm were 136 g C m2year1, which were estimated
was shown that DOC transport did not affect SOC (Kahl, 2008). Based on mean SOC stocks in 0–10 cm in the old selectively cut for-ests (Group IV) of 3.7 kg m2we estimated akvalue of 0.037. We
ran the model with two different assumptions: carbon stocks of the historical coppice-with-standards and pastures were depleted in carbon by 25% (Scenario 1) and by 50% (Scenario 2) in compari-son to SOC stocks in old selectively cut forests. The model reveals, how many years after the management change a new equilibrium will be reached. Models with greater depth and more layers would have included additional processes, but could not be used here be-cause they require many variables, which were not investigated in this study (e.g. DOC transport). However, this one compartment model seems to simulate the time response adequately.
3. Results
3.1. Present forest structure
The selected sites were different in their present forest struc-ture (Table 1). The wood volume at 400 m3ha1 was highest in
the 110 years ACF/CwS forest, where it was more than one-and-a-half times higher than in the 210 years ACF/CwS site (252.7 m3ha1). In contrast to the wood volume, the highest stand
density was found in the afforestation sites, where it was about five times higher than in the selectively cut forest (>250 years SF). Accordingly, the mean tree DBHs of afforestation sites were lower than in selectively cut forests. Due to the dependency of tree diameter on tree age the mean stand age showed similar patterns. The selectively cut forests were the oldest stands, and contained the highest proportion of beech. The mean LUDIp ranged between 4.7 at the more than 250 years old selectively cut forest to 27.7 at the afforestation sites. LAI was remarkably constant across all sites ranging between 5.1 and 5.2. LAI in remnants of historic manage-ment types was 5.4 ± 0.2 for coppice forest and 4.7 ± 0.3 for
coppice-with-standards forest (4.0 ± 0.4 without understorey and 5.4 ± 0.2 with understorey).
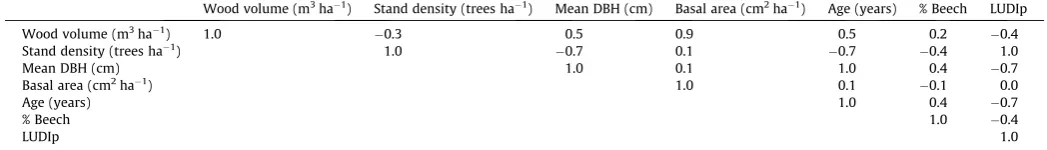
The correlation matrix of stand-level predictors (Table 2) showed a strong correlation between mean stand DBH and the three variables age, stand density, and LUDIp. Furthermore, the ma-trix showed the expected correlations between wood volume and basal area and between stand age and LUDIp. We used this matrix as the basis for selecting the main variables for describing the pres-ent forest stand structure. Only LUDIp, wood volumes and ‘‘%beech’’ (quantified as fraction of total basal area) representing the present forest structure were used for further statistical analyses.
3.2. Carbon stocks in the organic layer and in the bulk soil
Mean OC stocks in the organic layer of the study plots varied be-tween 0.3 ± 0.09 kg m2 (old selectively cut forest) and 0.7 ±
0.4 kg m2(afforestation site). OC stocks of the organic layer
con-tributes with 5.1% ± 3.0% to the sum of OC stocks of organic layer and OC stocks of the mineral soil.
Average total SOC stocks (only mineral soil) in the different management types varied between 8.8 ± 1.5 kg m2 in the old
selectively cut forest (>250 years SF) and 11.1 ± 2.3 kg m2at the
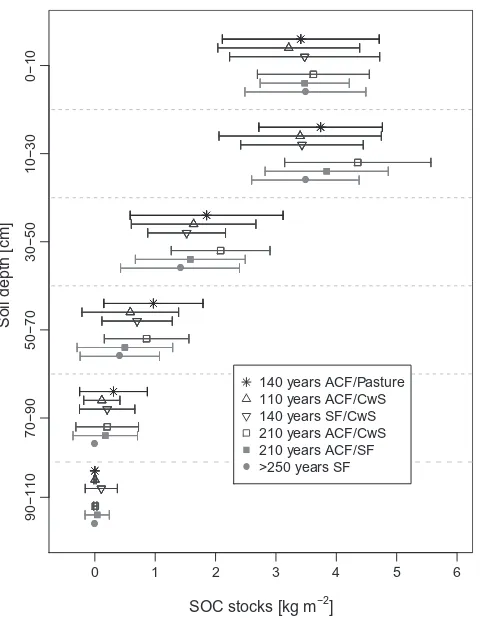
210 years age-class forest sites (Table 3) and there was no signifi-cant relationship between management and SOC stocks. Also, SOC stocks in the individual depth increments were not affected by present management or management history (Table 3andFig. 2). Across all sites 76% of SOC stocks where in the upper 30 cm and 24% between 30 and 100 cm. 72% of the SOC in the 0–10 cm and 27% of the total SOC were stored in the Ah-Horizon. There was no difference in the depth profile between management types (Fig. 2). The highest variations in total SOC stocks were found in the afforestation sites, the lowest in the old selectively cut forests. The mineral soil thickness ranged from 31 to 100 cm due to the different amounts of loess that were deposited at the different plots.
Table 2
Correlation matrix of stand-level predictors for choosing variables for further ANCOVA analysis representing the forest structure.
Wood volume (m3ha1) Stand density (trees ha1) Mean DBH (cm) Basal area (cm2ha1) Age (years) % Beech LUDIp
Wood volume (m3ha1) 1.0
0.3 0.5 0.9 0.5 0.2 0.4
Stand density (trees ha1) 1.0
0.7 0.1 0.7 0.4 1.0
Mean DBH (cm) 1.0 0.1 1.0 0.4 0.7
Basal area (cm2ha1) 1.0 0.1
0.1 0.0
Age (years) 1.0 0.4 0.7
% Beech 1.0 0.4
LUDIp 1.0
Table 1
An overview (with mean and standard deviation) of the stand characteristics of the study sites. Data are given for all trees with a DBHP7 cm.
Group I II III IV
Site 140 years ACF/
Pasture
110 years ACF/ CwS
140 years SF/CwS 210 years ACF/ CwS
210 years ACF/SF >250 years SF
Number of plots 8 35 14 11 46 16
Present management Age-class forest Age-class forest Selectively cut forest Age-class forest Age-class forest Selectively cut forest
Historical management Pasture Coppice-with-standards Selectively cut forest
Time of management change 1870 1900 1870 1800 1800 Before 1750
Time since management change 140 110 140 210 210 0
Wood volume (2009) (m3ha1) 394.9 (137.1) 400.7 (193.1) 364.8 (125.5) 252.7 (207.7) 376.3 (204.8) 465.7 (208.7)
Wood volume (1900) (m3ha1) – 330 200 300 300 280
Stand density (trees ha1) (2009) 1160.0 (709.2) 915.0 (813.6) 435.7 (265.9) 271.0 (210.0) 770.9 (709.1) 244.4 (198.4) Mean diameter at breast height (cm) (2009) 22.7 (8.2) 26.7 (14.1) 27.3 (10.9) 29.3 (15.9) 27.6 (15.1) 39.5 (13.6)
Basal area (cm2ha1) 39.2 (4.2) 31.7 (11.4) 26.2 (6.2) 17.5 (12.0) 27.3 (11.0) 27.1 (11.6)
Stand age (years) (2009) 76 (23) 88 (38) 88 (29) 94 (43) 89 (39) 120 (36)
% Beech 20.1 (36.5) 38.0 (33.0) 92.4 (13.7) 75.5 (34.7) 76.7 (29.0) 100 (0)
LUDIp (2009) 27.7 (18.0) 22.4 (20.9) 9.3 (6.8) 6.6 (4.1) 17.9 (17.8) 4.7 (4.9)
There was a significant positive relationship between total SOC stocks and total soil depth, but the explained variability was low (R2= 0.08). Inorganic carbon (IC) stocks increased with soil depth. In the 0–10 cm layer, average IC stocks were 0.05 ± 0.53 kg m2
(ca. 1% of the total carbon stock). In 10–30 cm layer average IC stocks of 0.2 ± 0.5 kg m2were measured (ca. 4% of the total carbon stock).
3.3. SOC and nitrogen concentration in density fractions
The light fractions showed a much higher SOC and N concentra-tion in different depth intervals than the heavy fracconcentra-tion (seeTable 4
andFig. 3). The average HF SOC concentration of the study sites
ranged between 20.2 ± 6.9 and 25.5 ± 5.6 g C kg1in 0–10 cm and
between 9.3 ± 2.7 and 13.7 ± 3.5 g C kg1 in 10–30 cm (Table 4).
Despite large differences among the forest types (up to 50%), the differences were not significant (ANOVA;p> 0.05). Also, we did not find any differences in SOC concentration between broadleaved sites and afforestation sites, which are mainly stocked with spruce. There were also no trends for HF SOC concentrations among pres-ent managempres-ent types (ANOVA;p> 0.05).
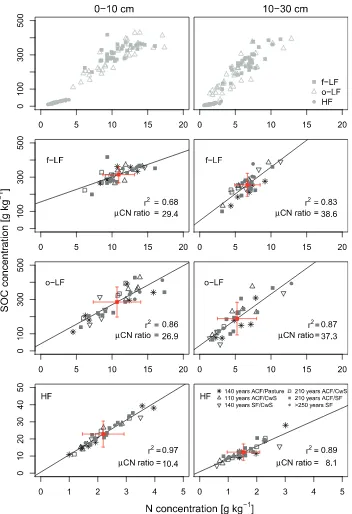
Significant linear relationships between SOC and N concentra-tions were found in all density fracconcentra-tions independent of historic management. The correlations between C and N concentrations be-came stronger with increasing decomposition of SOC in the o-LF and HF fraction (seeFig. 3). Young, less decomposed organic carbon with a high C:N ratio (29.4 ± 4.4 in 0–10 cm, 38.6 ± 6.1 in 10– 30 cm) was only found in the f-LF fraction. The C:N ratio of the o-LF in the 0–10 and 10–30 depth was intermediate between the corresponding f-LF and HF. The HF represented the fraction with the lowest C:N ratio (10.4 ± 0.8 in 0–10 cm and 8.1 ± 1.3 in 10– 30 cm) of all density fractions.
3.4. SOC stocks in density fractions
The contribution of f-LF to bulk SOC stocks was about 24% and 20% in the 0–10 cm and 10–30 cm layers respectively. The coeffi-cient of variation (CV) of the f-LF SOC stocks per site ranged be-tween 15% and 73% (mean 45%) in the 0–10 cm and 21% and 65% (mean: 41%) in 10–30 cm layer. This indicates a high variability of SOC stocks within each of the investigated sites. Differences be-tween the highest and the lowest mean f-LF SOC stocks per site were 0.2 kg m2(0–10 cm) and 0.4 kg m2(10–30 cm), which also
showed a high variability between management types. The contri-bution of o-LF to bulk SOC stocks was 9% in the 0–10 cm and 6% in the 10–30 cm layer almost one-third of the contribution to f-LF. The CV of the o-LF SOC stocks ranged between 24% and 83% (mean: 58%) in the 0–10 cm and between 12% and 80% (mean: 49%) in the 10–30 cm layer. Differences between the average o-LF SOC stocks per site were 0.2 kg m2(0–10 cm) and 0.3 kg m2(0–10 cm). As
shown for the f-LF we found a high variation between and within the investigation sites.
The light fraction (f-LF and o-LF) contributed around 30% to bulk SOC stocks (33% in 0–10 cm and 26% in 10–30 cm). The HF stored the largest proportion of total SOC stocks. The CV of the HF SOC stocks ranged between 14% and 64% (mean: 33%) in the 0–10 cm and between 12% and 70% (mean: 34%) in the 10–30 cm layer. Therefore the mean variability of the sites was smallest in
0 1 2 3 4 5 6
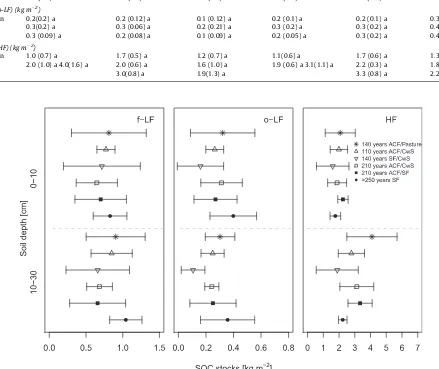
Fig. 2.Mean and standard deviation of soil organic carbon stocks (SOC) in different soil depths and under different management histories.
Table 3
Soil characteristics (mean and standard deviation) of the study sites with different management history. For the bulk density, organic carbon concentration and organic carbon stocks the Ah-horizon is presented separately. The 0–10 cm includes the Ah-horizon. Small letter (a) following a number indicates non-significant differences within rows (ANOVA,p> 0.05).
GROUP I II III IV
140 years ACF/Pasture 110 years ACF/CwS 140 years SF/CwS 210 years ACF/CwS 210 years ACF/SF >250 years SF
Soil profile thickness (cm) 64.0 (24.4) 57.5 (16.7) 61.0 (20.2) 64.3 (15.4) 52.3 (18.1) 53.8 (14.5)
Thickness of Ah-Horizon (cm) 5.3 (2.4) 7.0 (2.8) 6.0 (2.9) 7.0 (2.7) 6.4 (2.6) 10.6 (3.7)
Thickness of organic layer (cm) 5.8 (2.9) 5.7 (2.6) 5.3 (2.0) 4.8 (1.6) 5.4 (1.9) 2.9 (0.6)
OC-Stocks: Organic layer (kg m2) 0.7(0.4) 0.5 (0.2) 0.7(0.3) 0.4(0.2) 0.4 (0.4) 0.3 (0.09)
OC-concentration (Bulk soil) (g kg1)
the HF fraction. Average SOC stocks of the HF in upper 10 cm per site varied between 1.6 kg m2(140 years SF/CwS) and 2.2 kg m2
in the age-class forest (210 years ACF/SF). Average SOC stocks of the HF in the 10–30 cm layer per site varied between 1.9 kg m2
in 140 years SF/CwS and 4.1 kg m2on the afforestation site ( Ta-ble 5andFig. 4). Contrary to our expectations we found less SOC in the old selectively cut forest and a relative high amount of C in the afforestation sites. This observation is the opposite of our initial hypothesis (seeFig. 1). Also, there was no significant relation between SOC stocks and historic forest management.
3.5. Radiocarbon signatures in the HF fraction
Radiocarbon (14C) concentrations can be used to trace the mean
age of SOC and therefore the turnover time. Mean14C
concentra-tions in the HF fraction decreased with increasing soil depth at all investigation sites (seeTable 6). Mean14C concentrations of
102.0 pMC in the 0–10 cm and 93.4 pMC in the 10–30 cm layers correspond to a mean14C age of around 100 years and 550 years,
respectively. The mean14C concentration for the Ah horizon was
106.3 pMC, which corresponds to a radiocarbon age of younger than 60 years. The radiocarbon age of the upper 10 cm was there-fore less than the time since the last management change.
3.6. Analysis of differences in SOC stocks between individual sample plots
In the following ANCOVA analysis the SOC stocks in the whole soil profile, in the Ah-Horizon, in the 0–10 cm and in the 10– 30 cm layers were treated as dependent variables. Following the correlation matrix of stand-level predictors (Table 2) LUDIp, wood volume, and abundance of beech in percent were independent variables representing forest structure. The historical forest man-agement and time since the manman-agement changed was used to characterise forest history (seeTable 1). OC stocks of the organic layer, root mass, and profile depth were used as independent soil parameters.
Bulk SOC stocks were significantly explained by total depth of the soil profile. Deep soil profiles contain more SOC stocks than shallow profiles, but shallow profiles contain more SOC stocks in the upper depth increment. Root biomass in the Ah-Horizon had significant positive effects on SOC stocks in bulk soil and in all den-sity fractions, especially in the light fraction (Table 7). Because the free light fraction consisted of large, un-decomposed or partly decomposed root and plant fragments, strongest correlations were observed between root mass and f-LF-SOC stocks. Root mass had no influences on SOC stocks in deeper soil horizons.
We found a significant decrease of total SOC stocks in the 0– 10 cm and in the 10–30 cm layers with increasing abundance of beech, quantified as fraction of total basal area (seeFig. 5). The wood volume increased significantly with abundance of beech. These results did not change, if the spruce plots were excluded from the analysis.
4. Discussion
4.1. Expected SOC trends in different density fractions
The HF represents the fraction with the lowest C:N ratio of all density fractions, which indicates a higher degree of microbial decomposition (Gregorich et al., 2006; Guggenberger et al., 1995;von Lützow et al., 2006). The observation that the C:N ra-tio of the HF is 20 times lower than that of the LF confirms other studies (Rovira and Vallejo, 2003; Swanston et al., 2005, Wagai et al., 2009). Light fractions of SOC are known to respond faster to land-use and management changes than the HF fraction (Hassink et al., 1997). The LF fraction is very variable in space and time (seasonal, annual) and this limits its use as an indicator for historic land-use changes. f-LF comprises young detritus and fine roots and is considered to be mostly determined by C input levels and quality of the C input. Therefore we assumed that the LF is particularly sensitive to present forest manage-ment but not to historical forest managemanage-ment. This is also the
Table 4
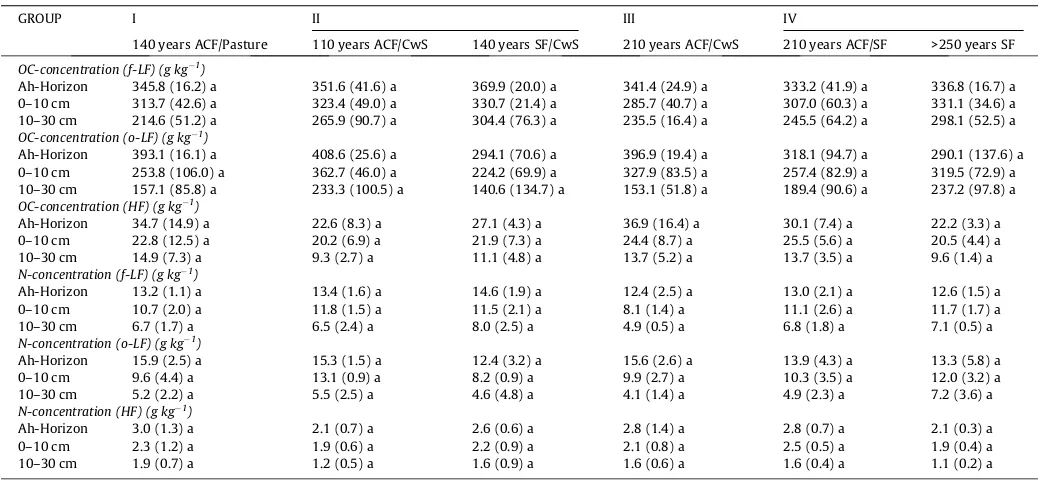
Mean and standard deviation (in brackets) of soil organic carbon (OC) and nitrogen (N) concentration measured in the three density fractions (f-LF free light fraction, o-LF occluded light fraction, HF heavy fraction) and in different depths of the soil on sites with different historical management types. The Ah-Horizon is presented separately. The 0– 10 cm includes the Ah-horizon. Small letter (a) following a number indicates non-significant differences within rows (ANOVA,p> 0.05).
GROUP I II III IV
140 years ACF/Pasture 110 years ACF/CwS 140 years SF/CwS 210 years ACF/CwS 210 years ACF/SF >250 years SF
OC-concentration (f-LF) (g kg1)
Ah-Horizon 345.8 (16.2) a 351.6 (41.6) a 369.9 (20.0) a 341.4 (24.9) a 333.2 (41.9) a 336.8 (16.7) a
0–10 cm 313.7 (42.6) a 323.4 (49.0) a 330.7 (21.4) a 285.7 (40.7) a 307.0 (60.3) a 331.1 (34.6) a
10–30 cm 214.6 (51.2) a 265.9 (90.7) a 304.4 (76.3) a 235.5 (16.4) a 245.5 (64.2) a 298.1 (52.5) a
OC-concentration (o-LF) (g kg1 )
Ah-Horizon 393.1 (16.1) a 408.6 (25.6) a 294.1 (70.6) a 396.9 (19.4) a 318.1 (94.7) a 290.1 (137.6) a
0–10 cm 253.8 (106.0) a 362.7 (46.0) a 224.2 (69.9) a 327.9 (83.5) a 257.4 (82.9) a 319.5 (72.9) a
10–30 cm 157.1 (85.8) a 233.3 (100.5) a 140.6 (134.7) a 153.1 (51.8) a 189.4 (90.6) a 237.2 (97.8) a
OC-concentration (HF) (g kg1)
Ah-Horizon 34.7 (14.9) a 22.6 (8.3) a 27.1 (4.3) a 36.9 (16.4) a 30.1 (7.4) a 22.2 (3.3) a
0–10 cm 22.8 (12.5) a 20.2 (6.9) a 21.9 (7.3) a 24.4 (8.7) a 25.5 (5.6) a 20.5 (4.4) a
10–30 cm 14.9 (7.3) a 9.3 (2.7) a 11.1 (4.8) a 13.7 (5.2) a 13.7 (3.5) a 9.6 (1.4) a
N-concentration (f-LF) (g kg1 )
Ah-Horizon 13.2 (1.1) a 13.4 (1.6) a 14.6 (1.9) a 12.4 (2.5) a 13.0 (2.1) a 12.6 (1.5) a
0–10 cm 10.7 (2.0) a 11.8 (1.5) a 11.5 (2.1) a 8.1 (1.4) a 11.1 (2.6) a 11.7 (1.7) a
10–30 cm 6.7 (1.7) a 6.5 (2.4) a 8.0 (2.5) a 4.9 (0.5) a 6.8 (1.8) a 7.1 (0.5) a
N-concentration (o-LF) (g kg1 )
Ah-Horizon 15.9 (2.5) a 15.3 (1.5) a 12.4 (3.2) a 15.6 (2.6) a 13.9 (4.3) a 13.3 (5.8) a
0–10 cm 9.6 (4.4) a 13.1 (0.9) a 8.2 (0.9) a 9.9 (2.7) a 10.3 (3.5) a 12.0 (3.2) a
10–30 cm 5.2 (2.2) a 5.5 (2.5) a 4.6 (4.8) a 4.1 (1.4) a 4.9 (2.3) a 7.2 (3.6) a
N-concentration (HF) (g kg1)
Ah-Horizon 3.0 (1.3) a 2.1 (0.7) a 2.6 (0.6) a 2.8 (1.4) a 2.8 (0.7) a 2.1 (0.3) a
0–10 cm 2.3 (1.2) a 1.9 (0.6) a 2.2 (0.9) a 2.1 (0.8) a 2.5 (0.5) a 1.9 (0.4) a
case with the organic carbon in the organic layer. OC in the or-ganic layer is subject to high seasonal variability. Therefore the smallest OC stocks in the old selectively cut forest are mainly caused by the sampling time. While the 140 years SF/CwS forest site was sampled in autumn, the old selectively cut forest site was sampled in early spring. A large amount of the litter was al-ready decomposed. Former investigation byMund (2004) in the same area showed relatively similar litter production between present selectively cut forest, unmanaged forest and age-class forest. Mean litter fall varied between 0.21 and 0.28 kg C m2
year1 (Mund, 2004).
Therefore we only expected trends due to historical forest man-agement in the SOC of the bulk soil and the HF fraction.
4.2. Mechanisms explaining similarity of SOC stocks despite differences in forest history
This study demonstrates that 100–200 years after changes in forest management from coppice-with-standards forest to differ-ent types of high forest, differences in soil carbon stocks and its fractions are no longer detectable. There are several factors, which lead to this observation.
4.2.1. Hypothesis 1: high variability of soil properties hampers detection of changes
The total SOC stocks were similar to those found in previous studies in the Hainich-Dün Region (Mund, 2004) and in studies
Fig. 3.Relationship between soil organic carbon (SOC) concentration and nitrogen (N) concentration in different density fractions (f-LF free light fraction, o-LF occluded light fraction, HF heavy fraction) in 0–10 cm and 10–30 cm soil depth increment,r2= Pearson correlation coefficient,
at the ‘‘Göttinger Wald’’, a 120-year-old beech stand, on limestone covered with loess (Meiwes and Beese, 1988). All sites of this study were located within the relatively small region ‘‘Hainich-Dün’’ (160 km2) with similar climatic and edaphic conditions. We only
sampled Luvisols to keep the soil type constant. However the bulk SOC and the density fractions did not show significant differences
between management histories. There was no consistent trend according to our initial hypothesis (Fig. 1a, black bar).
The variation between management types was high but over-lapping, reflecting the spatial heterogeneity of many soil properties such as clay content, thickness of loess layer, soil pH, or soil thick-ness. For example, deep soil profiles contain more SOC stocks than
Table 5
Soil organic carbon stocks in the different density fractions (f-LF free light fraction, o-LF occluded light fraction, HF heavy fraction) and in different depths of the soil on sites with different historical management types. The 0–10 cm includes the Ah-horizon. Small letter (a) following a number indicates non-significant differences within rows (ANOVA, p> 0.05).
GROUP I II III IV
140 years ACF/Pasture 110 years ACF/CwS 140 years SF/CwS 210 years ACF/CwS 210 years ACF/SF >250 years SF
C-Stocks (f-LF) (kg m2)
Ah-Horizon 0.5 (0.2) a 0.7 (0.1) a 0.6 (0.5) a 0.5 (0.2) a 0.6 (0.4) a 0.7 (0.3) a
0–10 cm 0.8 (0.5) a 0.8 (0.1) a 0.7 (0.5) a 0.6 (0.3) a 0.7 (0.4) a 0.8 (0.2) a
10–30 cm 0.9 (0.4) a 0.8 (0.3) a 0.6 (0.4) a 0.7 (0.2) a 0.7 (0.4) a 1.0 (0.2) a
C-Stocks (o-LF) (kg m2)
Ah-Horizon 0.2(0.2) a 0.2 (0.12) a 0.1 (0.12) a 0.2 (0.1) a 0.2 (0.1) a 0.3 (0.2) a
0–10 cm 0.3(0.2) a 0.3 (0.06) a 0.2 (0.21) a 0.3 (0.2) a 0.3 (0.2) a 0.4 (0.2) a
10–30 cm 0.3 (0.09) a 0.2 (0.08) a 0.1 (0.09) a 0.2 (0.05) a 0.3 (0.2) a 0.4 (0.2) a
C-Stocks (HF) (kg m2)
Ah-Horizon 1.0 (0.7) a 1.7 (0.5) a 1.2 (0.7) a 1.1(0.6) a 1.7 (0.6) a 1.3 (0.5) a
0–10 cm 2.0 (1.0) a 4.0(1.6) a 2.0 (0.6) a 1.6 (1.0) a 1.9 (0.6) a 3.1(1.1) a 2.2 (0.3) a 1.8 (0.3) a
10–30 cm 3.0(0.8) a 1.9(1.3) a 3.3 (0.8) a 2.2 (0.3) a
Fig. 4.Soil organic carbon stocks in the different density fractions (f-LF free light fraction, o-LF occluded light fraction, HF heavy fraction) in 0–10 cm and 10–30 cm soil depth increment.
Table 6
14C measurements table with the14C contents (pMC) of the FH fraction (mean and standard deviation). The 0–10 cm includes the Ah-horizon.
GROUP I II III IV
140 years ACF/Pasture 110 years ACF/CwS 140 years SF/CwS 210 years ACF/CwS 210 years ACF/SF >250 years SF
AMS14
C (% modern C)
Ah 105.3 (5.9) 106.6 (2.1) 105.4 (2.1) 107.5 (0.4) 106.7 (2.8) 105.8 (1.6)
0–10 99.1 (2.1) 105.4 (2.1) 99.6 (2.0) 100.0 (3.8) 103.2 (5.2) 104.3 (3.0)
shallow profiles, but shallow profiles contain more SOC stocks in the upper depth increment. This was, in part, due to differences in root distributions, which affect the vertical placement of C. Shal-lower soil profiles have significantly more roots in the upper 0–30 cm than deep soil profiles (linear regression between root mass0-30cmand profile thickness:R2= 0.04,p= 0.02). This confirms
that information about the soil thickness is necessary when esti-mating spatial SOC stocks within the same region.
Although we sampled 130 plots the large small-scale variability of soil properties reduced the strength of the statistical analysis.
4.2.2. Hypothesis 2: SOC has recovered within a century
This hypothesis is supported by the studies ofGoodale and Aber (2001)who showed in a comparison between old growth and his-torically logged forest that after 80–110 years C stocks had fully recovered from any losses that may have occurred after logging. We simulated our results using a simple one-component model (Fig. 6). Even if we assume historic differences in SOC stocks of 50% in the past, the soils would reach a kind of soil carbon ‘‘equi-librium’’ after 80 years on the fertile soils of the study area and despite management-related changes in stand carbon stocks. With differences of 25% the equilibrium would be reached even earlier. Thus, if there had been differences in SOC stocks 100 years ago, the change in management into high forests would have equili-brated all differences of the past in less than 100 years. In this
Table 7
Analysis of covariance with carbons stocks of bulks soil and different density fractions (f-LF free light fraction, o-LF occluded light fraction, HF heavy fraction) in the Ah-Horizon, 0–10 cm and 10–30 cm depth increment as response variable. In this table degrees of freedom (df), andF-values are presented.
df Total Ah-Horizon 0–10 cm 10–30 cm
Bulk soil f-LF o-LF HF Bulk soil f-LF o-LF HF Bulk soil f-LF o-LF HF
F-value F-value F-value F-value F-value F-value F-value F-value F-value F-value F-value F-value F-value
LUDIp 1 1.8 0.6 0.9 0.2 0.5 2.7 0.5 0.0 3.6 0.7 3.7 0.9 7.2*
Wood volume 1 2.1 3.0 1.3 0.1 0.7 5.7* 0.9 0.2 1.2 1.3 0.8 0.2 0.3
%Beech 1 4.8* 0.1 0.7 2.1 0.2 5.8* 1.5 2.2 0.5 4.1* 0.5 0.2 3.1
Root mass 1 13.3*** 25.7*** 14.9*** 9.8** 9.4** 5.0* 8.3* 2.7 0.3 3.3 0.1 2.3 0.1
OC stocks litter 1 0.3 2,0 0.6 0.1 0.0 0.9 0.7 0.0 0.6 0.8 1.4 0.5 1.0
Profile depth 1 8.4** 7.4** 1.4 0.7 2.0 20.6*** 0.8 0.6 3.7* 9.1** 0.0 0.1 2.5
Historical forest management
2 2.1 0.5 0.3 1.0 1.1 2.0 1.9 2.0 0.5 3.1 1.2 0.4 1.6
Time since
management change
1 1.2 0.0 0.0 0.0 0.4 0.8 0.1 0.2 0.3 2.9 0.0 0.4 2.1
*Significant result indicated byp< 0.05. ** Significant result indicated byp< 0.01. ***Significant result indicated byp< 0.001.
Fig. 5.Relationship between the abundance of beech expressed as percentage of
the total tree basal area and bulk SOC stocks in the 0–10 and 10–30 depth increment and biomass C.
0 50 100 150 200
012345
Time since management change [years]
SOC stocks [kg m
−2
]
50% of inital carbon 25% of inital carbon
Respiration=136.4 [g m−2 a−1], k=0.03
sense, our study came too late to detect effects of land manage-ment in the past. The14C data shows similar patterns. Even the
HF fraction in the 0–10 cm layer, in which we expected signals of historic forest management, has an average age of about the same as the time since the last management change.
4.2.3. Hypothesis 3: SOC did not differ significantly between the management types 200 years ago
An alternative hypothesis is that SOC stocks did not differ sig-nificantly between the management types 200 years ago. From the inventory reports of the 19th century it emerges that most cop-pice-with-standards forest in the Hainich-Dün was in fact under-used and fully covered with trees (Wäldchen et al., 2011). Govern-mental reports on forest degradation may also have been biased because they were used to rule against the peasants (Küster, 1998). Litter fall represents the largest flux of C from aboveground biomass to the soil where decomposing litter is a major driving variable of soil organic carbon. Due to similar LAI measurements on sites with different forest management in this study (Table 1) the annual input of leaf mass was probably similar for all forest management types. It is generally assumed that root turnover is re-lated to leaf turnover unless additional disturbances by manage-ment interfere. For example, the coppice with standard management systems had a higher level of stand disturbance than the selectively cut forest. Every 12–25 years (depending on the rotation period) the coppice was completely removed and only some standards were left for future timber wood growth. Shortly after the disturbance a higher decomposition rate is expected due to a higher light intensity, which causes a higher temperature on the soil surface. However these higher decomposition rates in comparison to the selectively cut system may also have been com-pensated by a higher belowground litter input (roots) in the cop-pice-with-standards forest following each rotation. Thus, we also may assume that the understorey in a coppice-with-standards sys-tem and the grass vegetation, which develops after deforestation added more root litter than the vegetation in a less disturbed selec-tively cut forest.
Considering the fact that the soils of the study sites are gener-ally very fertile and productive, it can be assumed that they have a higher resilience to disturbance than forest soils, e.g., on acid bedrock. Although, the historic forest inventory described different forest management systems, these differences in forest manage-ment system may not result in differences in the soil carbon bal-ance and associated differences in soil organic carbon stocks. It can be expected that the relation between C-gains from litter and C-losses from harvest were similar in all management types.
Our study also suggests that carbon extraction by logging of trees had no long-term adverse affect on these soils. This is con-firmed by deadwood studies ofKahl (2008)who showed that dead-wood does not add carbon to the soil carbon store. A meta-analysis byNave et al. (2010)included data from over 400 studies on har-vest impacts conducted around the world; it shows similar results. No significant differences were found in carbon stocks or concen-trations between harvested and unharvested stands in either shal-low or deep soils. Other studies confirm this observation:Mattson and Smith (1993)reported no differences in SOC content or con-centration across a chronosequence of cut and uncut plots in West Virginia. Also,Hover (2011)reported no differences in carbon stock estimates for the 0–20 cm depth increment between thinning treatments.
4.2.4. Hypothesis 4: SOC is influenced by present vegetation, which overrides the historic signal
Obviously, SOC depends not only on management history but also on other site-related factors. There is a significant decrease of SOC stocks with increasing proportion of beech, expressed as
fraction of basal area. Thoms et al. (2010) and Guckland et al. (2009) found significantly increased pH values and significantly decreased C:N ratios with increasing contribution ofAcerand Frax-inus in the existing forest stands of the same region.Finzi et al. (1998) and Neirynck et al. (2000), found much lower pH and base saturation beneath canopies ofFagusspecies than underTilia, Frax-inusandAcerspecies.Augusto et al. (2002)summarised effects of tree species on soil fertility in European temperate forests and con-cluded that the acidifying ability ofF. sylvaticaspecies was higher than that of all other deciduous tree species. Acidification pro-cesses change the activity of soil biota and affect decomposition and nutrient turnover processes. Soil acidification is accompanied by losses of base cation, nitrogen and carbon in the mineral soil. Acidification of the soil by litter ofFaguswould increase the litter carbon pool, and change the fine root distribution from the Ah into the litter layer due to changes in biological activity (Schulze, 2000;
Brumme and Khanna, 2009) when compared toAcerorFraxinus
dominated stands. This redistribution of fine roots could result in C depletion of the Ah and upper B horizon due to respiration of old C and initiate podsolisation. In this study we compare different management types on the same soil type at high base cation satu-ration. Thus, we are confident that we reached a quasi steady-state as explained byBrumme and Khanna (2009)in a fairly short time even after severe disturbance (afforestation of degraded grass-lands). The forest cover of this region has changed during historic times from mixed deciduous forests that were dominated byAcer,
FraxinusandQuercus, intoFagusdominated forests (Schulze et al.,
2012), and this change in forest species composition, which is in fact a typical modern land-use change, appears to have major neg-ative effects on SOC.
5. Conclusion
Changes in forest management and possible over-exploitation of forests in the 18th and 19th century had no detectable effect on present forest (SOC) stocks.
Historic and present wood extraction had no detectable effect on SOC stocks.
The effects of present vegetation my override historical signals.
Acknowledgements
The Max Planck Society is gratefully acknowledged for funding this project and supplying the employment opportunities for the Emeritus Prof. E.D. Schulze. The project was partly funded by the DFG Priority Program 1374 ‘‘Infrastructure-Biodiversity-Explorato-ries’’. We thank the manager of the Exploratory Hainich-Dün Sonja Gockel, and Markus Fischer, the late Elisabeth Kalko, Eduard Lin-senmair, Dominik Hessenmöller, Jens Nieschulze, Daniel Prati, François Buscot, and Wolfgang W. Weisser for their role in setting up the Biodiversity Exploratories project. Fieldwork permits were issued by the responsible state environmental offices of Thüringia. We thank Iris Kuhlmann, Silke Hengelhaupt, Kathrin Henkel, The-resa Klötzing (MPI for Biogeochemistry) for their technical assis-tance and Dr. Jens Schumacher (Friedrich Schiller University Jena) for his support with the statistics.
References
Augusto, L., Ranger, J., Binkley, D., Rothe, A., 2002. Impact of several common tree species of European temperate forests on soil fertility. Ann. For. Sci. 59, 233– 253.
Batjes, N.-H., 2002. Carbon and nitrogen stocks in the soils of Central and Eastern Europe. Soil Use Manage. 18, 324–329.
Bergel, D., 1973. Formzahluntersuchungen an Buche, Fichte, europäischer Lärche und japanischer Lärche zur Aufstellung neuer Massentafeln. Allg. Forst u. Jagd Ztg. 144, 117–124.
Bronk, R.C., 2001. Development of the radiocarbon program OxCal. Radiocarbon 43, 355–363.
Brumme, R., Khanna, P.K., 2009. Stand, soil and nutrient factors determine the functioning and management of beech forest ecosystems: a synopsis. In: Brumme, R., Khanna, P.K. (Eds.), Functioning and Management of European beech ecosystems. Springer, Berlin Heidelberg, pp. 459–490.
Buergi, M., Gimmi, U., 2007. Three objectives of historical ecology: the case of litter collecting in Central European forests. Landscape Ecol. 22, 77–87.
Compton, J.E., Boone, R.D., Motzkin, G., Foster, D.R., 1998. Soil carbon and nitrogen in a pine-oak sand plain in central Massachusetts: Role of vegetation and land-use history. Oecologia 116, 536–542.
Crow, S.E., Swanston, C.W., Lajtha, K., Brooks, J.R., Keirstead, H., 2007. Density fractionation of forest soils: methodological questions and interpretation of incubation results and turnover time in an ecosystem context. Biogeochemistry 85, 69–90.
Don, A., Schumacher, J., Scherer-Lorenzen, M., Scholten, T., Schulze, E.D., 2007. Spatial and vertical variation of soil carbon at two grassland sites - Implications for measuring soil carbon stocks. Geoderma 141, 272–282.
Ellert, B., Gregorich, E., 1995. Management-induced changes in the actively cycling fractions of soil organic matter. In: McFee, W., Kelly, J.M. (Eds.), Carbon Forms and Functions in Forest Soils. Soil Science Society American, Madison, pp. 119– 138.
Finzi, A.C., Canham, C.D., van Breemen, N., 1998. Canopy tree soil interactions within temperate forests: species effects on pH and cations. Ecol. Appl. 8, 447– 454.
Gerold, D., 1977. Erarbeitung eines Algorithmus zur rationellen und komplexen Auswertung langfristiger ertragskundlicher Versuchsfiächen sowie Nutzung des Informationsgehaltes für holzmeß- und ertragskundliche Forschung. Dissertation TU Dresden.
Goodale, C.L., Aber, J.D., 2001. The long-term effects of land-use history on nitrogen cycling in northern hardwood forests. Ecol. Appl. 11, 253–267.
Gragson, T.L., Bolstad, P.V., 2006. Land use legacies and the future of Southern Appalachia. Soc. Nat. Resour. 19, 175–190.
Gregorich, E.G., Beare, M.H., Mckim, U.F., Skjemstad, J.O., 2006. Chemical and biological characteristics of physically uncomplexed organic matter. SSSAJ 70, 975–985.
Grüneberg, E., Schöning, I., Kalko, E., Weisser, W., 2010. Regional organic carbon stock variability: a comparison between depth increments and soil horizons. Geoderma 155, 426–433.
Guckland, A., Jacob, M., Flessa, H., Thomas, F.M., Leuschner, C., 2009. Acidity, nutrient stocks, and organic-matter content in soils of a temperate deciduous forest with different abundance of European beech (Fagus sylvaticaL). J. Plant Nutr. Soil Sci. 172, 500–511.
Guggenberger, G., Zech, W., Haumaier, L., Christesem, N., 1995. Land-use effects on the composition of organic matter in particle-size separates of soil: I. Lignin and carbohydrate signature. Eur. J. Soil Sci. 46, 147–158.
Guo, L.B., Gifford, R.M., 2002. Soil carbon stocks and land use change: a meta analysis. Glob. Change Biol. 8, 345–360.
Hasel, K., Schwarz, E., 2006. Forstgeschichte: Ein Grundriss für Studium und Praxis. Verlag Dr, Kessel.
Hassink, J., Whitmore, A., Kubat, J., 1997. Size and density fractionation of soil organic matter and the physical capacity of soils to protect organic matterEur. J. Agro. 7, 189–199.
Heaton, T.J., Blackwell, P.G., Buck, C.E., 2009. A Bayesian approach to the estimation of radiocarbon calibration curves: the IntCal09 methodology. Radiocarbon 51, 1151–1164.
Hover, C.M., 2011. Management impacts on forest floor and soil organic carbon in northern temperate forests of the US. Carbon Balance Manage. 6, 17.http:// dx.doi.org/10.1186/1750-0680-6-17.
Jandl, R., Lindner, M., Vesterdal, L., Bauwens, B., Baritz, R., Hagedorn, F., Johnson, D.W., Minkkinen, K., Byrne, K.A., 2007. How strongly can forest management influence soil carbon sequestration? Geoderma 137, 253–268.
Janzen, H., Campbell, C., Brandt, S., Lafond, G., Townleysmith, L., 1992. Light-fraction organic-matter in soils from long-term crop rotationSSAJ56, 1799–1806. Kahl, T., 2008. Kohlenstofftransport aus dem Totholz in den Boden. Dissertation.
University Freiburg i.Brsg.
Kindler, R., Siemens, J., Kaiser, K., Walmsley, D.C., Bernhofer, C., Buchmann, N., Cellier, P., Eugster, W., Gleixner, G., Grünwald, T., Heim, A., Ibrom, A., Jones, S.K., Jones, M., Klumpp, K., Kutsch, W., Larsen, K.S., Lehuger, S., Loubet, B., Mckenzie, R., Moors, E., Osborne, B., Pilegaard, K., Rebmann, C., Saunders, M., Schmidt, M.W.I., Schrumpf, M., Seyfferth, J., Skiba, U., Soussana, J.F., Sutton, M.A., Tefs, C., Vowinckel, B., Zeeman, M.J., Kaupenjohann, M., 2011. Dissolved carbon leaching from soil is a crucial component of the net ecosystem carbon balance. Glob. Change Biol. 17, 1167–1185.
Küster, H., 1998. Geschichte des Waldes. Von der Urzeit bis zur Gegenwart C.H. Beck, München, Sonderausgabe.
Kutsch, W., Persson, T., Schrumpf, M., Moyano, F.E., Mund, M., Andersson, S., Schulze, E.D., 2010. Heterotrophic soil respiration and soil carbon dynamics in the deciduous Hainich forest obtained by three approaches. Biogeochemistry 100, 167–183.
Lockow, K.W., 2003. Volumentafeln und Formzahlfunktionen für Bergahorn – Grundlagen waldwachstumskundlicher Leistungsbeurteilung. Beitr. Forstwirtsch. u. Landschaftsökologie 37, 59–66.
Luyssaert, S., Hessenmöller, D., von Lüpke, N., Kaiser, S., Schulze, E.D., 2011. Quantifying land use and disturbance intensity in forestry, based on the self-thinning relationship. Ecol. Appl. 21, 3272–3284.
Mattson, K.G., Smith, H.C., 1993. Detrital organic matter and soil CO2 efflux in forests regenerating from cutting in West Virginia. Soil Biol. Biochem. 25, 1241– 1248.
Meiwes, K., Beese, F., 1988. Ergebnisse der Untersuchung des Stoffhaushaltes eines Buchenwaldökosystems auf Kalkstein. Göttinger Berichte des Forschungszentrums Waldökosysteme, Forschungszentrum Waldökosysteme. Mund, M., 2004. Carbon pools of European beech forests (Fagus sylvatica) under
different silvicultural management. Disseratation, Georg-August-Universität Göttingen.
Mund, M., Schulze, E.D., 2006. Impacts of forest management on the carbon budget of European beech (Fagus sylvatica) forests. Allg. Forst u. Jagd Ztg. 177, 47–63. Nave, L.E., Vance, E.D., Swanston, C.W., Curtis, P.S., 2010. Harvest impacts on soil
carbon storage in temperate forests. Forest Ecol. Manage. 259, 857–866. Neirynck, J., Mirtcheva, S., Sioen, G., Lust, N., 2000. Impact ofTilia platyphyllosScop.,
Fraxinus excelsiorL.,Acer pseudoplatanusL.,Quercus robur L. andFagus sylvatica L. on earthworm biomass and physico-chemical properties of a loamy topsoil. Forest Ecol. Manage. 133, 275–286.
Rovira, P., Vallejo, V., 2003. Physical protection and biochemical quality of organic matter in mediterranean calcareous forest soils: a density fractionation approach. Soil Biol. Biochem. 35, 245–261.
Schulze, E.D., 2000. The Carbon and Nitrogen Cycle of Forest Ecosystems. In: Schulze, E.D. (Ed.), Ecological Studies. Carbon and nitrogen cycling in European forest ecosystems. Springer, Verlag, pp. 3–14.
Schulze, E.D., Ciais, P., Luyssaert, S., Schrumpf, M., Janssens, I.A., Thiruchittampalam, B., Theloke, J., Saurat, M., Bringezu, S., Lelieveld, J., Lohila, A., Rebmann, C., Jung, M., Bastviken, D., Abril, G., Grassi, G., Leip, A., Freibauer, A., Kutsch, W., Don, A., Nieschulze, J., Boerner, A., Gash, J.H., Dolman, A.J., 2010. The European carbon balance. Part 4: integration of carbon and other trace-gas fluxes. Glob. Change Biol. 16, 1451–1469.
Schulze, E. D., Wäldchen, J., Bouriaud, O., Walentowski, H., Seele, C., Heinze, E., Strassbugrer, A., Pruschitzki, U., Hessenmöller, D., 2012. Changes in forest tree species composition by management, light conditions and ungulate browsing in differently managed deciduous forests in Thuringia, Germany, using forest succession in Romania as baseline Biodivers Conserv (submitted for publication).
Six, J., Conant, R.T., Paul, E.A., Paustian, K., 2002. Stabilization mechanisms of soil organic matter: Implications for C-saturation of soils. Plant and Soil 241, 155– 176.
Steinhof, A., Adamiec, G., Gleixner, G., van Klinken, G.J., Wagner, T., 2004. The new C-14 analysis laboratory in Jena, Germany. Radiocarbon 46, 51–58.
Swanston, C., Torn, M., Hanson, P., Southon, J., Garten, C., Hanlon, E.M., Ganio, L., 2005. Initial characterization of processes of soil carbon stabilization using forest stand-level radiocarbon enrichment. Geoderma 128, 52–62.
Thoms, C., Gattinger, A., Jacob, M., Thomas, F.M., Gleixner, G., 2010. Direct and indirect effects of tree diversity drive soil microbial diversity in temperate deciduous forest. Soil Biol. Biochem. 42, 1558–1565.
Trumbore, S., 2009. Radiocarbon and soil carbon dynamics. Annu. Rev. Earth Planet Sci. 37, 47–66.
Verheyen, K., Bossuyt, B., Hermy, M., Tack, G., 1999. The land use history (1278– 1990) of a mixed hardwood forest in western Belgium and its relationship with chemical soil characteristics. J. Biogeogr. 26, 1115–1128.
von Lützow, M., Koegel-Knabner, I., Ekschmitt, K., Matzner, E., Guggenberger, G., Marschner, B., Flessa, H., 2006. Stabilization of organic matter in temperate soils: mechanisms and their relevance under different soil conditions – a review. Eur. J. Soil Sci. 57, 426–445.
Wagai, R., Lawrence, M., Kitayama, K., 2009. Nature of the ‘‘occluded’’ low-density fraction in soil organic matter studies: a critical review. Soil Sci. Plant Nutr. 55, 13–25.
Wäldchen, J., Schulze, E.D., Mund, M., Winkler, B., 2011. Überblick über die Forstwirtschaft im Hainich-Dün Gebiet (Nordthüringen) im 19. Jahrhundert im Zusammenhang mit der politischen und wirtschaftlichen Entwicklung. Forstarchiv 82, 35–47.
Wirth, C., Schulze, E.-D., Schwalbe, G., Tomczyk, S., Weber, G., Weller, E., 2003. Dynamik der Kohlenstoffvorräte in den Wäldern Thüringens. Abschlussbericht zur 1. Phase des BMBF- Projektes ‘‘Modelluntersuchungen zur Umsetzung des Kyoto-Protokolls’’, Gotha.
Yamashita, T., Flessa, H., John, B., Helfrich, M., Ludwig, B., 2006. Organic matter in density fractions of water-stable aggregates in silty soils: effect of land use. Soil Biol. Biochem. 38, 3222–3234.