COLLABORATIVE MULTI-SCALE 3D CITY
AND INFRASTRUCTURE MODELING AND SIMULATION
Martin Breunig a , André Borrmann b, Ernst Rank c, Stefan Hinz b, Thomas Kolbe e, Matthäus Schilcher e, Ralf-Peter Mundani c, Javier Ramos Jubierre c, Matthias Flurl c, Andreas Thomsen a, Andreas Donaubauer e, Yang Ji c,
Steffen Urbanb, Simon Laun a,*, Simon Vilgertshofer d, Bruno Willenborg e, Mathias Menninghaus a, Horst Steuer e, Sven Wursthornb, Jens Leitloffb, Mulhim Al-Doorif, Nima Mazroobsemnani a
a Geodetic Institute, KIT, Germany - martin.breunig@kit.edu
b Institute of Photogrammetry and Remote Sensing, KIT, Germany –stefan.hinz@kit.edu c Chair for Computation in Engineering, TUM, Germany –rank@bv.tum.de d Chair of Computational Modeling and Simulation, TUM, Germany –andre.borrmann@tum.de
e Chair of Geoinformatics, TUM, Germany –thomas.kolbe@tum.de f School of Engineering, AUD, United Arab Emirates –maldoori@aud.edu
Commission IV, WG IV/7
KEY WORDS: Collaborative planning, integration of 3D modeling and simulation, multi-scale modelling, mobile computer vision.
ABSTRACT:
Computer-aided collaborative and multi-scale 3D planning are challenges for complex railway and subway track infrastructure projects in the built environment. Many legal, economic, environmental, and structural requirements have to be taken into account. The stringent use of 3D models in the different phases of the planning process facilitates communication and collaboration between the stake holders such as civil engineers, geological engineers, and decision makers. This paper presents concepts, developments, and experiences gained by an interdisciplinary research group coming from civil engineering informatics and geo-informatics banding together skills of both, the Building Information Modeling and the 3D GIS world. New approaches including the development of a collaborative platform and 3D multi-scale modelling are proposed for collaborative planning and simulation to improve the digital 3D planning of subway tracks and other infrastructures. Experiences during this research and lessons learned are presented as well as an outlook on future research focusing on Building Information Modeling and 3D GIS applications for cities of the future.
* Corresponding author
1. INTRODUCTION
Though Computer Supported Collaborative Work (CSCW) and research of CSCW environments have a more than 10 years history in computer science (European Commission, 2006), in Building Information Modeling (BIM) and Geographic Information System (GIS) practice, the support of collaborative work and planning are still at its beginning. This can be justified by the complex processes of city planning and by the complexity of 3D modeling. However, new collaborative platforms can reduce planning tasks providing more appropriate tools for planning activities. Especially the synchronous phases of the planning process need more interactive digital support. Furthermore, it has to be considered, that the objects refer to geographic space.
Modeling in different scales is well known from cartography defined as the ratio of the distance between two points on a map to the real distance between the two corresponding points portrayed (e.g. “1:100.000”). In the GIS community the scale problem is well known since decades (van Oosterom, 1995). In 3D city models and the data standard CityGML - defined by the Open Geospatial Consortium (OGC) - scale is defined by five level of details (LoDs). We will adapt this approach later in the paper for the modeling of subway tracks.
3D modeling helps enormously for the understanding and efficient planning of cities and buildings, infrastructures, and in particular subsurface structures such as transmission lines, canals, and subway tracks. For example, approaches for the interactive parametrical subway track planning for multi-scale models open new ways to control the planning process and to integrate different views for objects in different scales. In the paper the concepts are evaluated with a prototype software system and real data of the “Second Main Subway Track” in the city of Munich, Germany that demonstrate the operativeness of the introduced concepts.
The rest of the paper is organized as follows: Section 2 highlights related work. In Section 3 we introduce the overall system architecture of our collaborative platform for 3D tracks planning. Section 4 shortly a case study used in this paper. Different software components of collaborative planning are discussed in Section 5. Section 6 goes into the lessons learned during this research. Finally, Section 7 concludes the paper and presents an outlook on future research.
2. RELATED WORK
2.1 Collaborative planning and simulation
Collaborative design is a core part of modern engineering-based research and development. Typically, asynchronous approaches
(Weise et al., 2003; Beer et al., 2006; Richter and Beucke, 2008; etc.) are used which allow for a (temporal) distributed processing, but do not meet the requirements of interactive cooperation. Here, several users synchronously (Bidarra et al., 2002; Choi et al., 2002; Li et al., 2004; Cai et al., 2012; etc.), i.e. at the same time, work on the same model, hence everyone can see all changes immediately and inconsistent model stages are avoided. For instance, within so-called Collaborative Virtual Environments (Benford et al., 2001; Rosenman et al., 2005; Rosenman et al., 2007) users can meet and work in virtual sessions. While aforementioned approaches are not sufficient for multi-scale models, they further provide only small or no support for combining CAD and CAE technologies. Several works (Bianconi, 2002; Shepard et al., 2004; Lee, 2005; Gujarathi and Ma, 2011; etc.) show the integration of simulation techniques into the design process or into a collaborative
session (Wang and Zhang, 2010; Hamri et al., 2010; Schreier, 2010), but again neither support multi-scale models nor allow for a specific level-of-detail analysis. As shown below in this paper we propose a different approach of a collaboration platform based on procedural multi-scale models.
2.2 Multi-Scale modeling regional or 2.5D digital terrain model, LoD 1 as block model or building blocks, LoD 2 as 3D model of the exterior hull with roof structures and simple textures, LoD 3 as architecture model i.e. 3D model of the exterior hull with texture, and finally LoD 4 as interior space model of the building with floors, interior spaces and textures (Kolbe, 2009). In this regard, the challenge of consistency between the different LoDs has been addressed by Gröger and Plümer (2011). Our approach to ensure consistency in highly dynamic infrastructure product models relies on parametric modeling, a concept developed in the 1990s and subsequently implemented in mature commercial CAD systems (Shah & Mäntylä, 1995). The basic concept is to make use of parametric modeling techniques to define dependencies between geometric entities on different LoDs in order to update the finer LoDs when objects on coarser ones are modified, thus establish a cross-LoD consistency preservation mechanism (Borrmann et al., 2015). The dependencies are stored in a system-independent manner as part of the neutral tunnel product model and can thus be interpreted across different CAD systems acting as clients of the collaboration system (Borrmann et al., 2014).
For the semi-automatic generation of these product models we apply the concept of graph transformation by graph rewrite rules (Rozenberg, 1997). Graphs and graph rewriting mechanisms are employed to enable the representation and the modification of the procedural parametric models. An application of graph rewriting approach to semi-automatically create and alter solely parametric sketches has been presented in Vilgertshofer and Borrmann (2015).
2.3 Spatio-temporal databases and Geo Web Services
Spatio-temporal databases (Chen and Zaniolo, 2000; Koubarakis et al., 2003; Frank, 2003; Moon et al., 2009) are extremely useful for long-term archiving of city and infrastructure models as well as for on-demand and location-based spatio-temporal data retrieval. The group of Thomas Kolbe developed 3DCityDB® (Stadler et al., 2009) which can be installed on top of Relational Database Management Systems and allows the formulation of thematic and 3D spatial database queries. In the next version of CityGML (Kolbe, 2017) so called time dependent variables and time series will be introduced to enrich CityGML objects with dynamic phenomena. However, previous approaches still have to be adopted or extended especially concerning spatio-temporal data access and data access to hybrid spatial representations such as parametric and explicit models to fulfil the special requirements of 3D subway tracks planning.
With the release of OGC (Open Geospatial Consortium) Web Service specifications and standardised, fine-grained Web-access to geographic information have been introduced to Geospatial Information Systems (GIS). Existing OGC specifications for web service interfaces, however, have limitations regarding the access to a distributed, heterogeneous The International Archives of the Photogrammetry, Remote Sensing and Spatial Information Sciences, Volume XLII-4/W4, 2017
system for collaborative multi-scale 3D city and infrastructure modeling and simulation as described by Breunig et al. (2011). Collaborative usage of geodata has been addressed by scientific work in the past. Neis et al. (2010) present an approach to collaborative mapping for emergency management while Klimke and Döllner (2010) introduce an approach to collaborative work with 3D city models. Both approaches exclusively rely on the OGC standard WFS-T (transactional Web Feature Service) for collaborative work on a single resource of geospatial data. For collaborative work with data from different web services the Web Map Context (WMC) standard has been introduced as early as 2003. Despite being limited to rendered maps (in particular WMS), it is applied in other approaches such as presented by Smolders, et al. (2011) to integrate several results of a single analysis into one Web Map Context Document. Related approaches for integrating data from the Geospatial and the AEC/FM domain are summarized by Hijazi and Donaubauer (2017).
In a Web-based distributed system, complex geospatial analyses can be implemented as orchestrations of Geo Web Services. Thus consistency checking is one of the most challenges in Web-based geoprocessing chains: In order to generate valid results, the input and output data for each of the services in the chain have to meet application and service specific requirements. The “fitness for use” of geo-data for applications has been described by Delavar and Devillers (2010). However, these approaches do not allow the definition of data requirements at the level of instances and specific configurations of objects.
2.4 Mobile computer vision systems
With Augmented Reality (AR), we can extend our vision or images of real scenes with additional spatially registered information in order to support the inspection and planning process on-site. An AR System needs absolute position and orientation of all used sensors (including their mutual geometric relations) whenever the real scene should be augmented with the 3D plan or other additional information spatially referenced within the 3D model. There have been many AR Systems developed in science and industry till now, which are mainly operational in less-complex indoor or outdoor environments. Yet, today’s major challenge for those systems is either the complexity of the surroundings or the lack of GNSS signals (or other tracking infrastructures) in underground environments.
3. OVERALL SYSTEM ARCHITECTURE
AND CASE STUDY
The software system architecture developed within the research group “3D tracks” (Breunig et al., 2011) is demonstrated in Fig. 1. It shows the single software components of the architecture in detail.
To prove the suitability of the developed approaches, we chose as case study the “Second main subway track in Munich”, which is currently under planning and is going to be realized until 2026. It is the most important infrastructure project in the Munich area, dedicated to solve the bottleneck problems of the public transport network. The project is estimated with 3.8 billion Euro. The second track is designed as a twin shield tunnel with a length of about 7 km, which connects the two most important inner-city train stations Hauptbahnhof and
Ostbahnhof. It is expected to start operating in 2026. The multitude of pre-existing subway lines confront the engineers with a highly complex planning task, which culminates in three new stations, which are to be built about 40 m below ground.
Figure 1. System architecture for collaborative planning environment based on multi-scale modeling
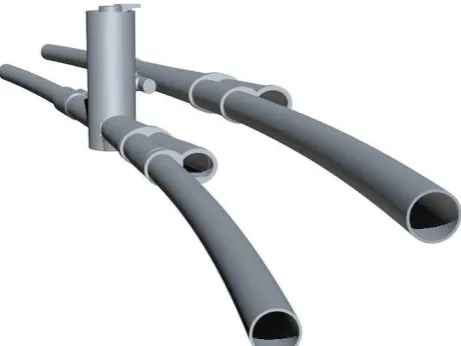
Based on the conventional 2D plans provided by the project engineers, we developed a multi-scale model of the shield tunnels including the new stations, and the rescue shafts. The model was created using parametric CAD systems extended by multi-scale modeling functionalities, made available on the Collaboration platform for simultaneous editing and stored and indexed in the Spatio-temporal database. The model was completed by the 3D city model of Munich forming the basis for multi-model analysis, including the detection of private and public buildings located above the planned tunnel, for example. In addition the model formed the basis for testing the AR platform (see Fig. 2).
Figure 2: Part of the planned subway track (LoD 3 model).
4. COMPONENTS OF COLLABORATIVE
TRACKS PLANNING
4.1 Collaboration Platform with Integrated Simulations
Main building block of the collaborative work is a client-server-based platform which manages and controls all synchronous accesses to the centrally stored geometric model (Borrmann et al., 2014). The platform performs concurrency control on basis of procedural models, thus any modification issued by the different users never leads to inconsistent stages. It further supports different design tools such as Siemens NX ® or Autodesk Inventor ® (see Fig. 3) and allows for the runtime The International Archives of the Photogrammetry, Remote Sensing and Spatial Information Sciences, Volume XLII-4/W4, 2017
integration of geo web services for advanced queries such as collision detection with sub-surface constructions.
Figure 3. Procedural tunnel model, represented with two different CAD systems
Procedural models store the construction history, consisting of sketches and geometric or Boolean operations. Hence, the construction of any object can be described by a bipartite graph. Within our research, we deploy this graph for the information interchange between clients and server as well as for concurrency control. According to a pessimistic approach (Munson und Dewan, 1996), the collaboration platform uses locks for certain parts of the graph which shall not be manipulated by several users at the time (Flurl et al., 2014). As soon as one user finishes his or her changes, the locks are released and final modifications (i.e. the operations) are propagated to all participating users of the collaborative session (see Fig. 4). In order to support maximum concurrency (locking one part close to the tree root also locks all subsequent parts), we have developed a dissection concept that in case of linear constructions subdivides those alongside the longitudinal axis in logical sub-structures.
Figure 4. During modification of one element (left), this one and all subsequent elements are locked for all other users (right)
Towards a more holistic approach, the integration of simulation tasks into the design phase is advantageous; hence bottlenecks can be identified already in early stages. We tested this prototypically for two different simulation tools – an autonomous energy simulation for a train’s energy consumption and a pedestrian flow simulation for evacuation dynamics.
The energy simulation can easily be integrated into the platform as it only requires the track itself given on LOD1. Designed as an autonomous simulation, it observes modifications to the track at any time and automatically starts computation of a train’s energy consumption as soon as the track was changed. By this means, users get immediate (visual) feedback if their modifications were beneficial or not. The underlying physical model considers kinetic and potential energy as well as influences of friction. As we especially focus on subway tracks, between two stations usually exist parts where energy has to be spent (going up) and energy can be recuperated (going down), summing up to the total energy budget of a subway train of a certain weight (depending on its length and number of passengers).
Obviously, the track design has huge influence on the energy consumption – the costs. Therefore, we have developed an optimisation strategy to minimise the costs by small changes to
the track’s vertical alignment. The idea is, to vary the points of vertical intersection (PVI) between two stations in discrete steps and apply an optimisation method to find the ones that finally constitute the optimal vertical alignment. As the search space becomes huge very fast (for instance, having n 10 PVIs with
m 12 vertical variations each, this leads to 1210 possible routes) and for every possibility the energy simulations has to be executed, this easily exceeds computational capabilities for a brute-force approach. Instead, we are using an ant algorithm
(Dorigo et al., 1991), belonging to the class of swarm intelligence approaches for approximating the optimal solution. This tremendously reduces the number of necessary simulation runs and the computation can almost be done in real time (Flurl et al., 2016). Figure 3c shows an example of different vertical alignments between two stations and the corresponding energy costs.
Figure 5. Total energy consumption (lower picture) for different variations of the vertical alignment between two stations (upper picture)
The second simulation task, integrated into the platform, focuses on evacuation dynamics. Here, the derivation of a computational model as input to the simulation tool proves to be more complicated than in the previous case. In order to compute pedestrian flows we need to know the space in which pedestrians are allowed to walk. That means, beside the solely track itself also models of the different stations (see Fig. 6) become necessary. Due to the fact that the station models can be constructed in the same way as the track, i.e. via our procedural modeling concept, they can also be maintained via the collaborative platform and, thus, be made available to all users participating in a collaborative session.
Figure 6. Station model of Marienplatz, Munich
From these models we can now derive – in a semi-automated fashion – the floor space including all obstacles (see Fig. 7). Setting boundary conditions accordingly, the evacuation of the station can finally be computed via a microscopic approach The International Archives of the Photogrammetry, Remote Sensing and Spatial Information Sciences, Volume XLII-4/W4, 2017
using the simulation tool momenTUMv21. Here, two things are of major interest: the time it requires to evacuate the station and the identification of bottlenecks such as insufficient small doors or staircases. The obtained results not only allow the designer to gain additional insight, but also to evaluate the model according to specific criteria.
Figure 7. Input scenario for pedestrian flow simulation derived from the station model in Fig. 6
4.2 Multi-scale methods for infrastructure facilities
As the planning of large infrastructure facilities such as inner-city subway tracks requires the consideration of widely differing scales, ranging from the kilometre scale down to the centimetre scale, the integration of multi-scale modeling into infrastructure product models is an important aspect of our approach. Multi-scale modeling is a concept well established in the GIS domain. As mentioned above, CityGML defines five LoDs to depict city models in different scales. The main advantage of multi-scale models is the possibility to define several geometric representations of one semantic object for each LoD. These representations are then used to visualize the modeled buildings or infrastructure facilities in different scales.
If dependencies between the individual LoDs are not explicitly defined, inconsistencies may arise. As GIS applications are relying on rather static data sets, the concept of independently modeled LoDs is sufficient. For the highly dynamic planning process of large infrastructure projects, however, a more robust approach is required. To realize this, dependencies between the different levels of detail during the creation of the multi-scale model are defined. The creation is performed top-down, i.e. from coarser levels to the finer one, thus reflecting the typical planning procedure.
As a first step towards developing such consistency preserving product models, five different LoDs for modeling shield-tunnel facilities have been developed (Borrmann et al. 2014). Figure B1 provides a 3D illustration of LoDs 2-5. In LoD 1, which is not depicted here, the tunnel is geometrically represented by a curve describing the main axis. For the levels 2 to 4 a strict containment hierarchy is employed: The spaces on a finer level are fully included in the space provided by the coarser level. In the 5th LoD, each physical object is placed in one of the spaces of the coarser LoDs.
1
https://www.cms.bgu.tum.de/de/31-forschung/projekte/456-momentum
Figure 8: A 3D representation of the different LoDs of the multi-scale shield tunnel product model (Borrmann and Jubierre, 2013)
The main difference between our approach and the one followed by GIS standards such as CityGML is the scale-aware sub-division of the semantic part of the model. While the GIS standards allow the association of multiple geometric representations for the individual levels with one semantic object, but keep the semantic object structure fixed across the different LoDs, we propose to explicitly represent refinement relationships in the semantic part of the model, thus providing a much higher degree of semantic-geometrical coherence of the multi-scale model. In order to group and provide access to all elements at a certain level of detail, we introduce dedicated LoD objects. These objects aggregate all spatial and physical objects at the corresponding level. At the same time, we maintain the aggregation relationships across the different LoDs in order to explicitly model a refinement hierarchy. One of the key aspects of the approach is that the refinement hierarchy is created with the help of space objects, while physical objects form part of the finest level only. This allows us to use spaces as placeholders on coarser levels, thus providing full compliance with the standard IFC modeling approach for space-element aggregation structures. In this scope, a proposal for extending the IFC standard to enable the representation of multi-scale shield tunnel product models has been developed (Vilgertshofer et al., 2016). By applying the refinement hierarchy, we are also able to define parametric and procedural constraints and dependencies during the modeling process in order to create product models, which automatically ensure the consistency across the different LoDs (Borrmann et al. 2015). Thereby, changes on a low LoD are propagated to the higher LoDs, for example the editing of the alignment in LoD 1 results in the update of the geometric representations on LoD 2-5.
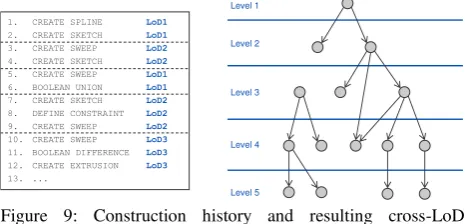
Figure 9: Construction history and resulting cross-LoD dependency graph.
While these consistency preserving models are very useful during the design process, their generation is a complex, time-consuming and error-prone task (Jubierre & Borrmann, 2015). From this starting point, we chose the application of graph rewriting techniques as a means for realizing an automation
1. CREATE SPLINE
2. CREATE SKETCH
3. CREATE SWEEP
4. CREATE SKETCH
5. CREATE SWEEP
6. BOOLEAN UNION
7. CREATE SKETCH
8. DEFINE CONSTRAINT
9. CREATE SWEEP
10. CREATE SWEEP
11. BOOLEAN DIFFERENCE
12. CREATE EXTRUSION
13. ...
LoD1 LoD1 LoD2 LoD2 LoD1 LoD1 LoD2 LoD2 LoD2 LoD3 LoD3 LoD3
Level 1
Level 2
Level 3
Level 4
Level 5
mechanism to support the multi-scale modeling process (Vilgertshofer and Borrmann, 2015).
We developed a concept for the graph-based representation of product models and their automatic detailing by performing graph rewrite operations based on formal rules defined in a graph rewriting system. It focuses on the presented product model of shield-tunnels and the automated creation of consistency-preserving multi-scale versions of such a model. In this regard, a graph rewriting system that enables the generation of graphs representing those product models has been created. This formal computer-interpretable description of a parametric design preserves the knowledge embodied in the respective manual tasks to build-up the model and allows their reuse in similar design scenarios.
Furthermore, the modeling knowledge formalized in graph rewrite rules may be applied to new scenarios with only minor alterations or even be generalized in a way that the rules themselves are intrinsically adaptable to different scenarios. The model is detailed step-wise (as shown in Fig. 10) from the basic layout of the alignment up to a LoD containing several space objects of the tunnel.
Figure 10: Conceptual illustration of several detailing steps in a tunnel planing process. Dependent on the chosen rule different designs can be generated.
To create and detail a multi-scale geometric model by using graph rewrite operations, it is necessary to determine the composition of the graph, which is used to represent the model. This is achieved by the definition of the graph meta model.
With this definition of a graph meta model, the approach enables the representation and storage of parametric procedural models including its construction history by using a vendor-neutral graph-based data format. Doing so, the proposed method is generic and can easily support various parametric CAD-systems, which are used for generating an evaluated model by interpreting the graph-based representation. One important feature of this method is the possibility of modifying the evaluated model so that it can be used as basis for further modeling operations in the respective CAD system.
The developed concept of using graph transformation to automatically create consistent multi-scale product models has been implemented as a case study. For the definition of a graph rewrite system consisting of a meta model and appropriate graph rewrite rules, the graph rewrite generator GrGen.NET (Jakumeit et al., 2010) has been used while the generation of the evaluated sketch is performed with the commercial parametric CAD application Autodesk Inventor. Inventor contains a
geometrical constraint solver, which interprets the constraint problem defined by a graph. A software prototype was developed in order to combine the functionalities of GrGen.NET with that of Autodesk Inventor to illustrate the straight-forward application of rewrite rules and the consecutive creation of the evaluated model.
4.3 Spatio-Temporal Database and Hybrid Spatial Model Handling
4.3.1 Efficient Spatio-Temporal Data Access: To allow the
efficient spatio-temporal data access to infrastructures during the planning and the construction progress, the secondary storage access method of the geo-database management system should consider three spatial and two temporal dimensions: construction time and planning time. These two temporal dimensions correspond to the notions of real time and transaction time respectively, used in the database research community.
In our approach two k-d-b Trees (Robinson, 1981) are used (Menninghaus et al., 2016), i.e. each bounding hyper rectangle of an object is divided into lower and upper boundary points to be stored in two parallel working subtrees. Each subtree then stores 5-dimensional points and each point contains a pointer to the corresponding bounding hyper rectangle. Finally, during the database queries both subtrees return results to the same result set. To validate the approach, real data sets of Karlsruhe and Munich city models, respectively, were used (see Fig. 11).
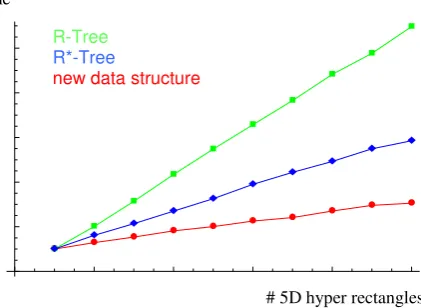
Figure 11. Data set for validation: Part of Karlsruhe city model When comparing the new approach with traditional multi-dimensional access methods such as R-Tree and R*-Tree, it is superior when considering the retrieval of objects into the tree(s). Figure 12 shows the relationship between the number of 5D hyper rectangles (3 spatial and 2 temporal dimensions) and the time needed for the retrieval portrayed for the R-Tree, R*-Tree, and the new data structure.
time
# 5D hyper rectangles Figure 12. Normalized results for object retrieval The handling of the 5D hyper rectangles was directly implemented on top of the object-oriented database
R-Tree
R*-Tree
new data structure
management system db4o®. Here the new structure outperforms the R-Tree and even the R*-Tree significantly.
4.3.2 Hybrid Spatial Model Handling: The management of hybrid spatial models in a geo-database is a crucial task. Besides the explicit geometry such as triangulated surfaces, also the geometries constructed by a CAD system, i.e. the procedural model has to be considered. To understand the logical model, we decided to use an XML-oriented approach to map the logic of the Constructive Solid Geometry tree (CSG tree) into the database.
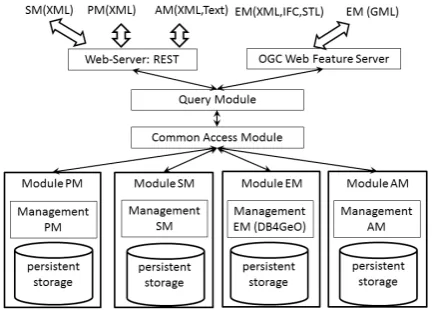
We then designed a common access module, and query module, respectively, to handle the different model representations: the procedural model (PM), the semantic model (SM), the explicit model (EM), and the annotation model (AM) are managed in an integrated way (see Fig. 13) and accessible via geo-web services.
Figure 13. Architecture of a hybrid spatio-temporal database. Each model representation is stored in a separate database module (PM:procedural, SM:semantic, EM:explicit, AM:annotation). Integrated access is provided by a common access module.
Considering the way the tracks data are constructed, it follows that there are strong dependencies between the different representations. In particular, the EM is completely dependent on PM and SM, and there is no feed-back from EM to PM. In consequence, all updates of the data set must first take place on
SM and PM, and then be carried over to EM.
To prove the concept, i.e. to implement some typical aspects of the concept shown above, after some experiments with the XML-Database exist, we decided to use methods of the object-relational geo-database management system PostGIS/ PostgreSQL. Notice that in this restricted approach all CSG operations such as “intersection” have to be executed on the same level of the CSG tree. Attributes can be selected and stored in a relation of the geo-database. The geo-database is rather used as a data archive than as a software to execute online updates. Regarding the data, the special format “IFC/Step” contains the complete construction rule, e.g. the exterior hull of a tunnel, as procedural model.
The procedural model and the semantic model in our implementation are based on XML. The mapping strategy performs in two steps. At first the XML schema is mapped to the object schema and then the object schema is mapped to the database schema. For the hybrid model this must be done for the Procedural as well as for the semantic model.
To consider the temporal aspect, tables for the version management are needed. These tables include also the relations
between the datasets of the different models. For example, it is considered which imported semantic model is related to which imported procedural model. Another benefit of the version management is that the differences between two time steps or a period of time can be displayed.
To complete the database for the hybrid spatial model the schema of the explicit model must be added. Especially to store the explicit model it is useful to realize it as an object orientated model. In the described use case an object is defined by a construction component of a tunnel which can be created by one sweep operation. This definition also implies which subtrees of the XML documents are related to an object of the explicit model. With the definition of an object the relationships between different models can be linked on the level of single objects. The links between objects are important for defining queries by using objects as an input for the queries. Spatial queries which are retrieving for the procedural model are typical examples for queries which definitely need these relations. Furthermore, subsets of the procedural and the semantic model can be generated with the links on the level of objects.
The tunnel part objects of the explicit model are stored as solids in the database. To store solids in the database the extension SFCGAL of PostGIS is used. This extension allows the usage of CSG operations and spatial indices on the data. With the CSG operations it is also possible to generate the different level of details of a tunnel on the database. For this purpose the basic solids of the tunnel and an interpreter for the construction cycle of the procedural model are needed.
The prototype implementation shows that the challenges can be solved to combine a semantic, procedural and explicit model in one database by adapting an existing object relational database.
4.4 Advanced Geo Web Services
The integration of design proposals into a virtual representation of their geographic context is in our approach achieved by encapsulating geospatial data and analysis functions by Geo Web Services. These can be accessed by clients of the collaboration platform such as 3D modeling tools. Due to the large number of stakeholders involved into infrastructure planning projects and their individual information needs, data management is a complex task. In order to support this task, we developed the conceptual schema of a of Geospatial Web Service Context Document (Steuer et al., 2014) which allows for describing the individual information needs of the stakeholders, i.e. a specific combination of data and functionality provided by Geo Web Services in a formal way. The object oriented schema we developed allows for representing the following aspects of user-specific information needs: User group specific rules allow for filtering specific objects, layers and more fine grained data requirements including the specification of Levels of Detail. Furthermore, we integrated the proposal of Klimke&Döllner (2010) for attaching
annotations to 3D geospatial objects and allow for encoding
camera views. We developed an XML encoding for the Geospatial Web Service Context Document schema which was implemented both in a 3D modeling tool connected to the collaboration platform and in the Augmented Reality system. In our approach geospatial data and processing functionality are accessed via Geo Web Services. In order to generate valid results, the input and output data for each of the services have to meet application and service specific requirements. For example, a Web Service providing the functionality of detecting collisions between a planned subway tunnel and existing underground infrastructure such as sewage pipes will generate The International Archives of the Photogrammetry, Remote Sensing and Spatial Information Sciences, Volume XLII-4/W4, 2017
valid results only if the outer shell of the planned tunnel exists for the whole tunnel model. Furthermore, quite often the required analysis result cannot be provided by a single Web Service but by a combination of services in a dependent sequence, i.e. by a Web-based geoprocessing chain which implies that there are requirements for the input and output data for all the services in the chain in order to generate valid results. We developed a concept to formally describe fine-grained requirements for the input and output data of services and propose a system architecture for implementing this concept (see figure 14).
Figure 14. Graph-based concept for modeling and checking fine-grained requirements for the input and output data of an individual Geo Web Service
The idea behind our concept is to express the data requirements for both the input and the output of the Geo Web Service as graphs and to use graph isomorphisms for the verification of data instances against the requirements. In a first step, we define mapping rules for transforming object oriented geospatial data into a graph structure. These mapping rules are then applied in a second step to transform both data requirements (named “graph requirements” in figure 14) and input data instances of the Geo Web Services into the graph structure (named “graph input data” in figure 14). In a third step we use subgraph isomorphisms in order to find matching structures (the graph representation of the requirements) in the host graphs (the graph representing the input data). Only matching subgraphs represent consistent input data and can be processed by the Geo Web Service. The advantage of this graph based validation approach is that also complex specific configurations of objects and their attribute values can be checked on the instance level. After the data has been processed, steps two and three are repeated for the output data of the Geo Web Service. In a last step consistency reports are automatically generated for the input and output data using graph replacement rules.
4.5 Augmented Reality System
To navigate and track the AR sensors without GNSS signals, we developed an image-based tracking scheme in analogy to typical SLAM (Simultaneous Localization and Tracking) approaches. This system relies on a multi-fisheye camera setting and supports also a (CAD-)model-based tracking component (Reitmayr et al, 2006), to deal even with complex environments. It shall furthermore cope with the problem of estimating the initial AR system’s position without the help of other sensors – a challenge that has not been solved so far.
Our AR System uses a multi camera system (MCS) that consists of three cameras with fisheye lenses mounted on the operator’s helmet. The images of the MCS are used for initial and continuous real-time pose estimation and self-localization within the 3D building model with image-based methods. For working with rigidly coupled cameras, a new approach for common collinearity equations for multi-camera systems has been established (Urban et al, 2016a). For calibration of the
MCS a generic methodology for wide-angle, fisheye and omnidirectional cameras in general has been developed using this approach. This resulted in improved accuracy with respect to previous research (Urban et al, 2015). After calibration the parameters for world to camera projection of each camera and the mutual transformations within the MCS are known. By analysing the image sequences of all cameras of the MCS in real-time the helmet system can estimate and track the user’s location in the scene.
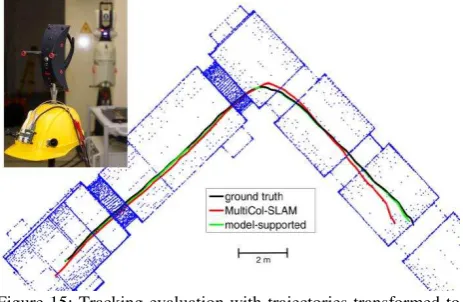
The first step in our camera-based tracking method is the initialisation of the system by self-localization within the scene. Two different localization methods have been developed. The first is the re-localization of the MCS either after tracking loss or if the systems re-visits a place that has been mapped in real-time during the tracking process, which can be done by a so-called co-visibility graph (Urban et al, 2016a). The second is a self-localization method using the un-textured 3D building model. By comparing features from real and synthetic views of the environment, the system is able to estimate its pose w.r.t the building model either by using approximate nearest neighbour matching or particle filtering (Urban et al, 2013). These two requirements – on one hand recognizing re-visited scenes with the help of an improved online learning method for binary features (so-called “mdBrief” (Urban & Hinz, 2016)) and, on the other hand, finding the initial sensor position in a texture-less model – led to the development of a model-supported multi-camera SLAM system called “MultiCol-SLAM” (Urban et al, 2016a). The model-supported part is also used to correct for drift of the SLAM system. The main idea is to render a view of the 3D model, extract all visible edges from it and match them to the real camera image of the scene within this model. With the help of our formulation of the collinearity equations it is possible to render these views of the 3D building model into the images of the fisheye cameras. The pose (absolute orientation) of the cameras has to be known in order to render such a view. The problem of the initial unknown pose is solved be calculating many sample views within the model in an offline process, extract one dimensional feature vectors for every view and find the best match when compared to the camera images. Usually, there are more edges visible than model-based edges stored in a model. Step edges can be extracted with synthetic depth images and crease edges with normal images that can be both rendered from the model view (Urban et al, 2013).
Figure 15: Tracking evaluation with trajectories transformed to the building model. The ground truth trajectory (black) has been captured with a laser tracker (see tracker probe mounted on helmet)
As it is shown in (Urban, 2016), the developed AR system outperforms all other systems in terms of reliability, robustness and flexibility/genericity. This involves in particular the aspects The International Archives of the Photogrammetry, Remote Sensing and Spatial Information Sciences, Volume XLII-4/W4, 2017
of self-initialization, multi-camera modeling (Urban et al. 2015), statistical modeling (Urban et al, 2016b), feature detection (Urban & Hinz, 2016), feature-based tracking, model-based tracking as well as combined tracking (Urban 2016). Figure 15 shows three trajectories transformed to the building model for better evaluation. The black trajectory is the ground-truth acquired by a laser tracker. The green trajectory is based on combined tracking with the model-supported method and the red trajectory represents the result of MultiCol-SLAM without model-support.
5. LESSONS LEARNED
5.1 Collaborative planning and simulation
Collaborative work based on procedural multi-scale geometries combines several benefits: effective interoperability between different CAD systems, efficient concurrency control concepts, and simple integration of simulation tools into the design process. By developing a prototypical collaboration platform, we were able to prove that interactive collaboration also opens the door to a vast amount of possibilities towards more holistic design processes. By integrating two sample simulations, one for the autonomous computation of a train’s energy consumption and one for evacuation dynamics, designers can now evaluate their models already during the design phase and thus, avoid unnecessary and expensive modifications in late stages.
5.2 Multi-scale modeling
The core concept was the definition of dependencies between geometry objects on different LoDs by making use of parametric and procedural geometry representations. Thereby, the consistency of the multi-scale model by propagating changes on geometric objects to all dependent representations can be achieved. As the generation of such models comes with a tremendous effort, we use graph transformation mechanisms in order to enable a semi-automatic generation of these models.
5.3 Spatio-temporal databases
Our experiences with tracks data generated during the modeling process show that it is important to handle with a “stable” logical data model before storing the data into the database. Unfortunately, it is not realistic to know the whole schema right from the beginning. This means that you have to be ready for later minor changes or updates of the database scheme, i.e. sophisticated later changes cannot be prevented. Whenever you have heterogeneous data, especially different geometric data types, it is worth managing them in different database management systems, being specialized for one type of data.
5.4 Geo Web Services
The planning process is significantly improved when planners are able to evaluate the impact of their “digital twins” of future buildings and infrastructure objects with a “digital twin” of the real world on the fly whenever they modify their design proposal. Our approach to achieving this goal is to encapsulate the digital representation of the real world, i.e. geospatial data and GIS functionality, by Geo Web Services. This allows GIS experts to create complex geospatial analyses such as environmental impact simulations in their own software environment and publish them by Geo Web Services which can then be invoked by planners through the collaboration platform. In order to meet the requirements of real world planning scenarios, we extended the concept of Geo Web Services by two major contributions: We developed a Geospatial Web
Service Context Document which allows for describing the individual information needs of the stakeholders in a planning process, i.e. a specific combination of data and functionality provided by Geo Web Services in a formal way. Furthermore, we developed a concept which allows for consistency checking in Web-based geoprocessing chains. This concept ensures the “fitness for use” of geospatial data for specific tasks and thus the validity of analysis results.
5.5 Mobile computer vision systems
Image-based techniques can be used for robust self-localization with a multi-camera model-supported approach in real-time. Our approach combined an improved SLAM framework to map the environment with image features with model-based tracking to detect re-visits and absolute positions within the model. It is even possible to solve the initial location w.r.t the model by rendering synthetic sample views offline that are matched later during the online tracking loop. Tests with ground truth data show that the accuracy and robustness of the image-based self-localization and scene reconstruction outperforms other systems. Yet, there is still room for improvement in many aspects. In particular, further high-resolution imaging sensors can be incorporated to reconstruct the 3D scene in more detail; it is furthermore not yet tested, how many outliers – especially, if many moving objects occur in the scene – can still be handled by the system; the miniaturization of the sensor set-up would be another option to improve the system.
6. CONCLUSIONS AND OUTLOOK
This paper has provided new research on the deployment of 3D city and infrastructure models by integrating approaches from civil engineering computing and geoinformatics such as collaborative work, multi-scale modelling, and computer vision. The overall system architecture has been implemented and evaluated by a 3D track infrastructure model in Munich, Germany. It is apparent from the analysis of many currently implemented use cases that the adoption of these models is not evenly spread across all fields of research benefiting from 3D city models such as solar studies, navigation, national mapping and other active entities in the 3D city modeling community.
A rise in realizing the importance of collaborative research and joint application of 3D city models by all stakeholders in the near future is expected as obvious improvement of the portfolio of stakeholders’ products and the awareness of possible application fields offered by 3D Geoinformation (Wong, 2015).
Advances in defining the proper requirements to utilize 3D datasets by national mapping agencies and data produces will enhance the collaborative effort in planning complex infrastructure projects in the built environment. Although this research cites a wide variety of scenarios which proves the important role and need for a framework governing the collaborative multi-scale 3D city and infrastructure models, it is expected that a growth in the application of such models will be enhanced by the recent advancement in augmented and virtual reality (Carmigniani et al., 2011); progress in procedural modeling (Besuievsky and Patow, 2014; Tsiliakou et al., 2014; Müller et al., 2013; Martinovic et al., 2015; Rautenbach et al., 2015) and the synergy between BIM, computer Graphics and GIS (de Laat and van Berlo, 2011; Isikdag and Zlatanova, 2009; El-Mekawy et al., 2012; Biljecki and Arroyo, 2015; Kumar et al, 2011).
This will provide 3D city models users with a rich suite of utilities to enrich and improve the application of such models The International Archives of the Photogrammetry, Remote Sensing and Spatial Information Sciences, Volume XLII-4/W4, 2017
and can be advantageous to applications deploying thematic classes. It will also improve the spatial analysis of 2D and 2.5D cases such as house price models, and route optimization cases as it will be influenced by the growth in 3D model infrastructure (Jung et al., 2006; Biljecki et al., 2015). This will also positively affect 3D indoor models as more integrated indoor – outdoor models emerge.
In our future research we will further focus on computer-aided collaborative and multi-scale 3D tracks planning using Building Information Modeling (BIM), i.e. the modeling of properties and relations between 3D objects. BIM patronizes collaboration with project information and develops more realistic building models by systematically bringing component information together. BIM will undoubtedly attract growing attention in the future, e.g. the UK Construction Strategy 2025 report includes the mandate for all government procured construction projects to use BIM level 2 which works collaborative with 3D CAD information. Similar efforts are taken by the German Federal Ministry of Transport and Digital Infrastructure (BMVI, 2015).
Furthermore, most measurements of sensor networks or mobile devices in Smart Cities are producing ever-increasing databases. So, current studies specifically designed for the analysis of small sample sizes have to be up-scaled to big geospatial data.
In our future long-term research we are planning to conceptualize and implement solutions for big 3D geospatial data to provide efficient functions for analyzing Building Information Models and analysis in Smart Cities. For this purpose, it is necessary to consider at an early stage how the requirements for Building Information Models should be developed in the future and which “adjustments” should be set accordingly.
ACKNOWLEDGEMENTS
The support of this research by the German Research Foundation (DFG) in the framework of the DFG research group “Computer-aided collaborative subway track planning in multi-scale 3D city and building models” is acknowledged. We also thank Obermeyer Planen + Beraten GmbH and the city of Munich for their support of the research group.
REFERENCES
Beer, D.G., Firmenich, B., Beucke, K, 2006. A System Architecture for Net-Distributed Applications in Civil Engineering. Proc. of the XIth Int. Conference on Computing in Civil and Building Engineering (ICCCBE), Montreal, Canada. Benford, S., Greenhalgh, C., Rodden, T., Pycock, J., 2001. Collaborative Virtual Environments. Communications of the ACM, Vol. 44(7), pp. 79–85.
Besuievsky, G.; Patow, G., 2014. Recent advances on LoD for procedural urban models. In Proceedings of the 2014 Workshop on Processing Large Geospatial Data, Cardiff, UK, 8 July 2014. Bianconi, F, 2002. Bridging the gap between CAD and CAE using STL files. Int. Journal of CAD/CAM, Vol. 2(1), pp. 78– 91.
Biljecki, F.; Arroyo Ohori, K., 2015. Automatic semantic-preserving conversion between OBJ and CityGML. In Proceedings of the Eurographics Workshop on Urban Data Modelling and Visualisation 2015, Delft, The Netherlands, 23 November 2015; pp. 25–30.
BMVI, 2015. Digital Planning and Building („Stufenplan Digitales Planen und Bauen“), German Federal Ministry of Transport and Digital Infrastructure, 20p.
Borrmann, A.; Flurl, M.; Jubierre, J.R.; Mundani, R.-P.; Rank, E., 2014. Synchronous collaborative tunnel design based on consistency-preserving multi-scale models, Advanced Engineering Informatics 28 (4), pp. 499-517.
DOI: 10.1016/j.aei.2014.07.005
Borrmann, A., & Jubierre, J. R., 2013. A multi-scale tunnel product model providing coherent geometry and semantics. In Proc. of the 2013 ASCE International Workshop on Computing in Civil Engineering (pp. 291–298). Los Angeles. http://doi.org/10.1061/9780784413029.037
Borrmann, A.; Kolbe, T.H.; Donaubauer, A.; Steuer, H.; Jubierre, J.R.; Flurl, M., 2015. Multi-scale geometric-semantic modeling of shield tunnels for GIS and BIM applications, Computer-Aided Civil and Infrastructure Engineering 30 (4), 2015, pp. 263-281., DOI: 10.1111/mice.12090
Breunig, M., Kuper, P.V., Butwilowski, E., Thomsen, A., Jahn, M., Dittrich, A., Al-Doori, M., Golovko,D., Menninghaus, M., 2016. The Story of DB4GeO - A Service-Based Geodatabase Architecture to Support Multi-Dimensional Data Analysis and Visualization. ISPRS Journal, Vol. 117, pp. 187-205.
Breunig, M., Rank, E., Schilcher, M., Borrmann, A., Hinz, S., Mundani, R.-P., Yang, J., Menninghaus, M., Donaubauer, A., Steuer, H., Vögtle, T., 2011. Towards computer-aided collaborative subway track planning in multi-scale 3D city and building models. 3DGeoInfo, Springer Verlag, Heidelberg, 17p. Breunig, M., Zlatanova, S., 2011. 3D geo-database research: retrospective and future directions. Computers & Geosciences, 37, pp. 791-803.
Carmigniani, J.; Furht, B.; Anisetti, M.; Ceravolo, P.; Damiani, E.; Ivkovic, M., 2011. Augmented reality technologies, systems and applications. Multimedia Tools Appl. 2011, 51, pp. 341–377.
de Laat, R.; van Berlo, L., 2011. Integration of BIM and GIS: The development of the CityGML GeoBIM extension. In Advances in 3D Geo-Information Sciences; Springer: Berlin, Germany, 2011; pp. 211–225.
El-Mekawy, M.; Östman, A.; Hijazi, I., 2012. A unified building model for 3D urban GIS. ISPRS Int. J. Geo-Inf. 2012, 1, pp.120–145.
Chen, C.X., Zaniolo, C., 2000. SQLST: A Spatio-temporal Data Model and Query Language. Proceedings of the 19th International Conference on Conceptual Modeling, Salt Lake City, Utah, USA, pp. 96-111.
Delavar, M. R., Devillers, R., 2010. Spatial Data Quality: From Process to Decisions. Transactions in GIS, Vol. 14, No. 4, pp. 379-386, Wiley-Blackwell.
Dorigo, M., Colorni, A., Maniezzo, V., 1991. Distributed Optimization by Ant Colonies. Proc. ECAL91 – European Conference on Artificial Life, Paris, France.
El-Mekawy, M.; Östman, A.; Hijazi, I., 2012. An evaluation of IFC-CityGML unidirectional conversion. Int. J. Adv. Comput. Sci. Appl. 2012, 3, pp. 159–171.
European Commission, Directorate-General for Communications Networks, Content and Technology, 2006. New collaborative working environments 2020, Report on industry-led FP7 consultations and 3rd report of the Experts Group on Collaboration@Work, 49p.
Flurl, M., Morelos, R., Mundani, R.P., Rank, E., 2016. Energy optimization for subway trains by interactive track alignment planning. Proc. of Railway 2016 – The Third International Conference on Railway Technology: Research, Development and Maintenance.
Flurl, M., Mundani, R.P., Rank, E., 2014. Graph-based concurrency control for multi-scale procedural models. Proc. 10th European Conference on Product & Process Modelling, CRC Press.
Forberg, A., 2007. Generalization of 3D building data based on a scale-space approach. ISPRS Journal of Photogrammetry and Remote Sensing 62(2), pp. 104-111.
Frank, A., 2003. Ontology for Spatio-temporal databases, T. Koubarakis et al. (Eds.), Spatio-temporal databases, LNCS 2520, Springer Verlag Heidelberg, pp. 9-77.
Gröger, G., & Plümer, L., 2011. How to achieve consistency for 3D city models. GeoInformatica, 15(1), 137–165. http://doi.org/10.1007/s10707-009-0091-6
Gujarathi, G.P., Ma, Y.S., 2011. Parametric CAD/CAE integration using a common data model. Journal of Manufacturing Systems, Vol. 30(3), pp.118–132.
Hamri, O., Léon, J.C., Giannini, F., Falcidieno, B., 2010. Software environment for CAD/CAE integration. Advances in Engineering Software, Vol. 41(10–11), pp. 1211–1222. Hijazi, I., Donaubauer, A., 2017. Integration of Building and Urban Information Modeling - Opportunities and integration approaches. In: Kolbe, Thomas H.; Bill, Ralf; Donaubauer, Andreas (Hrsg.): Geoinformationssysteme 2017 – Beiträge zur 4. Münchner GI-Runde. Wichmann.
Jakumeit, E., Buchwald, S., & Kroll, M., 2010. GrGen.NET. International Journal on Software Tools for Technology Transfer. http://doi.org/10.1007/s10009-010-0148-8
Jubierre, J.R.; Borrmann, A., 2015. Knowledge-based engineering for infrastructure facilities: assisted design of railway tunnels based on logic models and advanced procedural geometry dependencies, Journal of Information Technology in Construction 20, pp. 421-441.
Klimke, J. Döllner, J., 2010. Geospatial annotations for 3D environments and their WFS-based implementation. In: Painho, M., Santos, M.Y., Pundt, H. (Eds.), Geospatial Thinking, Springer, Berlin, Heidelberg, pp. 379–397.
Klettke M., Meyer H., 2001. XML and Object-Relational Database Systems Enhancing Structural Mappings Based on Statistics. In: Goos G., Hartmanis J., van Leeuwen J., Suciu D., Vossen G. (eds) The World Wide Web and Databases. WebDB 2000. Lecture Notes in Computer Science, vol 1997. Springer, Berlin, Heidelberg.
Klimke, J., Döllner, J., 2010. Combining synchronous and asynchronous collaboration within 3D city models, in: S. Fabrikant, T. Reichenbacher, M. Kreveld, C.Schlieder (Eds.), Geographic Information Science, vol. 6292, Springer, Berlin, Heidelberg, pp. 115–129.
Kolbe, Th. H., 2009. Representing and Exchanging 3D City Models with CityGML. In J. Lee & S. Zlatanova (Eds.), 3D Geo-Information Sciences (pp. 15–31). Berlin, Heidelberg: Springer. http://doi.org/10.1007/978-3-540-87395-2_2
Kolbe, Th., 2017. Remarks on next version CityGML 3.0 to be passed by Open Geospatial Consortium (OGC). https://www.gis.bgu.tum.de/en/projects/citygml-30.
Koubarakis, M., Sellis, T., Frank, A.U., Grumbach, S., Güting, R.H., Jensen, C.S., Lorentzos, N., Manolopoulos, Y., Nardelli,
E., Pernici, B., Schek, H.-J., Scholl, M., Theodoulidis, B., Tryfona, N. (Eds.), 2003. Sellis, T., 2003. Spatio-Temporal Databases – The CHOROCHRONOS Approach. Lecture Notes in Computer Science Vol. 2520, Springer-Verlag, Heidelberg, 349p.
Kumar, K.; Saran, S.; Kumar, 2016. A.S. CityGML based interoperability for the transformation of 3D data models. Trans. GIS 2016. in press.
Lee, S.H., 2005. A CAD–CAE integration approach using feature-based multi-resolution and multi-abstraction modelling techniques. Computer-Aided Design, Vol. 37(9), pp. 941–955. Martinović, A.; Knopp, J.; Riemenschneider, H.; van Gool, L., 2015. 3D all the way: Semantic segmentation of urban scenes from start to end in 3D. In Proceedings of the 28th IEEE Conference on Computer Vision and Pattern Recognition, Boston, MA, USA, 7–12 June 2015; pp. 4456–4465.
Menninghaus, M., Breunig, M., Pulvermüller, E., 2016. High-Dimensional Spatio-Temporal Indexing. Open Journal of Databases (OJDB), 3(1), pp. 1-20.
Müller Arisona, S.; Zhong, C.; Huang, X.; Qin, H., 2013. Increasing detail of 3D models through combined photogrammetric and procedural modelling. Geo-Spat. Inf. Sci. 2013, 16, pp. 45–53.
Munson, J., Dewan, P., 1996. A Concurrency Control Framework for Collaborative Systems. Proc. 1996 ACM conference on Computer supported cooperative work, Boston, USA.
Neis, P., Singler, P., Zipf, A., 2010. Collaborative Mapping and Emergency Routing for Disaster Logistics-Case studies from the Haiti earthquake and the UN portal for Afrika. In: Geospatial Crossroads@ GI-Forum, vol. 10.
Oosterom, P. Van, & Schenkelaars, V., 1995. The Developement of an Interactive Multi-Scale GIS. International Journal of Geographical Information Systems, 9(5), 489–507. Rautenbach, V.; Bevis, Y.; Coetzee, S.; Combrinck, C., 2015. Evaluating procedural modelling for 3D models of informal settlements in urban design activities. South Afr. J. Sci. 2015, 111.
Reitmayr, G. ,Drummond, T., 2006. Going out: Robust model-based tracking for outdoor augmented reality. In Proceedings of the International Symposium on Mixed and Augmented Reality (ISMAR), Santa Barbara, CA, USA.
Richter, T., Beucke, K., 2008. Diff and Merge for Net-Distributed Applications in Civil Engineering. Proc. of the XIth Int. Conference on Computing in Civil and Building Engineering (ICCCBE), Montreal, Canada.
Robinson, J., 1981. The K-D-B-Tree: A Search Structure for Large Multidimensional Dynamic Indexes. Proceedings of the 1981 ACM SIGMOD International Conference on Management of data, pp. 10–18.
Rosenman, M.A., Smith, G., Ding, L., Marchant, D., Maher, M., 2005. Multidisciplinary Design in Virtual Worlds. Proc. of the 11th Int. Computer-Aided Architectural Design Futures Conference.
Rosenman, M.A., Smith, G., Maher, M.L., Ding, L., Marchant, D., 2007. Multidisciplinary Collaborative Design in Virtual Environments. Automation in Construction, Vol. 16(1), pp. 37– 44.
Schilling, A., Neubauer, S., Zipf, A., 2009. Putting GDI-3D into practice: Experiences from developing a 3D spatial data infrastructure based on OpenGIS standards for the sustainable The International Archives of the Photogrammetry, Remote Sensing and Spatial Information Sciences, Volume XLII-4/W4, 2017
management of urban areas. FIG Commission 3, International Workshop on Spatial Information for Sustainable Management of Urban Areas. Mainz, Germany, 6p.
Schreier, P., 2010. Closing the CAD/CAE gap. Scientific Computing World.
Sester, M., & Brenner, C. (2009). A vocabulary for a multiscale process description for fast transmission and continuous visualization of spatial data. Computers & Geosciences, 35(11), 2177-2184.
Shah, J. J., & Mäntylä, M. (1995). Parametric and feature-based CAD/CAM: Concepts, Techniques and Applications. New York: ohn Wiley & Sons. Retrieved from http://opac.ub.tum.de/InfoGuideClient.tumsis/start.do?Login=w otum&Query=540=%220-471-00214-3%22
Shephard, M.S., Beall, M.W., O'Bara, R.M., Webster, B.E., 2004. Toward simulation-based design. Finite Elements in Analysis and Design, Vol. 40(12), pp.1575–1598.
Shimura T., Yoshikawa M., Uemura S., 1999. Storage and Retrieval of XML Documents Using Object-Relational Databases. In: Bench-Capon T.J., Soda G., Tjoa A.M. (eds) Database and Expert Systems Applications. DEXA 1999. Lecture Notes in Computer Science, vol 1677. Springer, Berlin, Heidelberg
Smolders, S., Alegre, C., Gianfranceschi, S., Gilles, M., Resch, B., Everding, T., 2011. GENESIS Employing Web Processing Services and Sensor Web Technology for Environmental Management. In: Proceedings of the "Integrating Sensor Web and Web-based Geoprocessing" Workshop at the 14th AGILE International Conference on Geographic Information Science, Utrecht, The Netherlands, 18-21
Stadler, A., Nagel, C., König, G., Kolbe, Th. H., 2009. Making interoperability persistent: A 3D geo database based on CityGML – 11. In: Lee, Jiyeong; Zlatanova, Sisi (Ed.): 3D Geo-Information Sciences. Springer, 2009, pp. 175-192.
Steuer, H., Flurl, M., Donaubauer, A., Mundani, R.-P., Kolbe, T.H., Rank, E., 2014. Collaborative Planning of Inner-City-Railway-Tracks: A Generic Description of the Geographic Context and Its Dynamic Integration in a Collaborative Multi-Scale Geometry Modelling Environment. Advanced Engineering Informatics 28, 2014, 261–271
Tsiliakou, E.; Labropoulos, T.; Dimopoulou, E., 2014. Procedural modeling in 3D GIS environment. Int. J. 3-D Inf. Model. 2014, 3, pp. 17–34.
Urban, S., 2016. Real-Time Multi-Fisheye Camera Self-Localization and Egomotion Estimation in Complex Indoor Environments. PhD thesis, Karlsruhe Institute of Technology (KIT)
Urban, S., Hinz, S., 2016. mdBrief - A Fast Online Adaptable, Distorted Binary Descriptor for Real-Time Applications Using Calibrated Wide-Angle Or Fisheye Cameras. arXiv preprint arXiv:1610.07804
Urban, S., Leitloff, J., Hinz, S., 2016b. MLPnP - A Real-Time Maximum Likelihood Solution to the Perspective-n-Point Problem. ISPRS Annals of the Photogrammetry, Remote Sensing and Spatial Information Sciences.
Urban, S., Leitloff, J. and Hinz, S., 2015. Improved Wide-Angle, Fisheye and Omnidirectional Camera Calibration. ISPRS Journal of Photogrammetry and Remote Sensing, 108:72–79
Urban, S., Wursthorn, S., Leitloff, J., Hinz, S., 2016a. MultiCol Bundle Adjustment: A Generic Method for Pose Estimation, Simultaneous Self-Calibration and Reconstruction for Arbitrary
Multi-Camera Systems. International Journal of Computer Vision (IJCV), pages 1-19
Urban, S., Leitloff, J., Wursthorn, S., Hinz, S., 2013. Self-localization of a multi-fisheye Camera based augmented reality system in textureless 3D building models. ISPRS Ann. Photogramm. Remote Sens. Spatial Inf. Sci., II-3/W2, 43-48. doi:10.5194/isprsannals-II-3-W2-43-2013
Vilgertshofer, S., & Borrmann, A. (2015). Automatic Detailing of Parametric Sketches by Graph Transformation. In Proc. of the 32nd ISARC 2015. Oulu, Finnland.
Vilgertshofer, S., & Borrmann, A. (2016). A Graph Transformation Based Method for the Semi-Automatic Generation of Parametric Models of Shield Tunnels. In Proc. of the EG-ICE Workshop on Intelligent Computing in Engineering. Krakow, Poland.
Wang, H., Zang, H., 2010. A distributed and interactive system to integrated design and simulation for collaborative product development. Robotics and Computer-Integrated Manufacturing, Vol. 26(6), pp. 778–789.
Weise, M., Katranusckov, P., Scherer, R.J., 2003. Generalised Model Subset Definition Schema. Proc. of the 20th CIB-W78 Conference.