Published by Canadian Center of Science and Education
Cigarette Smoke Exposure relations, Consumption Fast Food, Soft
Drink and Consumption Fried with Improved Blood Sugar Levels in
Teens
Ruslan Majid1, Ali Hidayat1, Nani Yuniar1, Yusuf Sabilu1 & La Nalefo2
1
Faculty of Public Health Halu Oleo University, Kendari, Southeast Sulawesi, Indonesia
2
Faculty of Agriculture University Halu Oleo, Kendari, Southeast Sulawesi, Indonesia
Correspondence: Ruslan Majid, Faculty of Public Health Halu Oleo University, Kendari, Southeast Sulawesi, Indonesia. Tel: 62-8-1140-2644. E-mail: [email protected]
Received: August 17, 2016 Accepted: October 20, 2016 Online Published: February 3, 2017 doi:10.5539/jsd.v10n1p142 URL: http://dx.doi.org/10.5539/jsd.v10n1p142
Abstract
Diabetes Mellitus (DM) is a disorder caused by the body's hormone deficiency of insulin, glucose consequently continue to circulate in the bloodstream and difficult to penetrate the cell wall. Glucose is also called a simple sugar or monosaccharides result from the metabolism of carbohydrates, proteins and fats. Methods used analytic survey with cross sectional study, and carried out at Senior High School 4 Kendari (SMAN 4). The results of Cigarette Smoke Exposure variables no association with increased blood sugar levels with Chi Square statistical analysis obtained by value = 0.55. Value> α = 0:05 means that the fast food consumption or significance value = 0.000 and α = 0:05. Value <α, it means that there is a relationship of fast food consumption.
With increased blood sugar levels in adolescents and test values obtained relationship Ro = 0.69, soft drink consumption values obtained value or significance value = 0.000 and α = 0.05. Value < α, it means that there is a relationship of soft drink consumption with increased blood sugar levels in adolescents and test values obtained relationship Ro = 0.47 and fried food consumption values obtained value or significance value = 0.000 and α = 0.05. Value <α = 0.05 means that there is a connection with the consumption of fried foods increase blood sugar levels in adolescents and test values obtained relationship Ro = 0.66. It is expected to be considered by the government to ensure that policies for issuing business licenses and the public in order to selectively choose additional food menu primarily in adolescents in order to avoid the disease diabetes mellitus.
Keywords: blood sugar levels, exposure to tobacco smoke, fast food consumption, soft drink, fried consumption
1. Introduction
Concept Diabetes Mellitus is associated with blood sugar metabolism regulation mechanism to be normal. Increased presence of blood sugar levels can trigger the production of insulin by the pancreas gland. The presence of elevated blood glucose levels continuously, resulting in damage to blood vessels, nerves and other internal structures. The substance is a complex consisting of sugar in the blood vessel wall causing blood vessels to thicken. The next result of this thickening, the blood flow is reduced, especially those leading to the skin and nerves. Furthermore, blood glucose levels to the normal (non-diabetic) when fasting 60-120 mg/dl two hours after eating <140 mg/dl and blood sugar levels as ≥ 100 mg/dl.
A cigarette contains 4,000 types of chemical compounds, with three main components: 1) nicotine is a harmful substance that causes addiction (addictive), 2) tar is hazardous substances that cause cancer (carcinogenic), 3) carbon monoxide (CO) is a toxic gas which lowers the oxygen content in the blood. The research conducted by Professor Benjamin Beckman from Brigham Young University stated that smoke cigarettes as small lipid trigger. It called cream to change the mitochondria in cells. This is caused of disruption in normal cell function and inhibits the ability of cells to respond to insulin.
Southeast Sulawesi (18.4%), South Sumatra (18.2%), South Sulawesi (16.9%), Papua (15.9%), Central Kalimantan (15.6%), Maluku (14.8%) and West Kalimantan (14.8%).
The increasing for carbonate beverages consumed by people around the world, thus causing tremendous anxiety among health. Several studies have shown the negative effects of soft drinks to the health of the human body. Among the negative impacts occur, especially in adolescence, mainly due to the increased risk of obesity and bone growing is not optimal. Obesity can be identified by signs and symptoms such as double chin, the neck is relatively short, chest swollen with enlarged breasts in fat, belly bulge and abdominal wall folds as well as both legs generally X-shaped with both groin part in sticking that can cause odor no odor.
As for the age of 15-19 years (36.7%) and amounted to 1.3% of the population Southeast Sulawesi started smoking at the age of 5-9 years. In behavioral habits to consume fast food and soft drinks in Kendari greatly increasing the number of it, especially trading around 38.7% of the population. This is reinforced behavior to consume fried food accompanied by merchants especially in Kendari. The student at SMAN 4 Kendari have their favorite status in adolescents aged 16-17 years, the behavior of those who always consume almost instantaneous. The teenagers spent for activities in schools and shared their peers to meet the nutritional needs do snack. The enthusiasts for fast food is very much, where flavor and form is very interesting and varied so that they are very easily attracted to consume these foods. The determination was conducted on the choice of snacks including staple food and beverages. In the terms of the ability of adolescents aged 16-17 years in the fulfillment of nutritional lacking, the entry of a new culture in Kendari which makes the teens are very unstable in selecting foods in voting that could affect their health.
2. Method
This research is an analytic survey with cross sectional study to learn the dynamics of the correlation between risk factors with effects, the approach, observation or the collection data. Variable relations smoke exposure, consumption of fast food, soft drinks and fried food consumption with increased blood sugar levels in adolescent students at SMAN 4 Kendari. The population of 471 respondents, while the sample of 80 respondents. The blood sample tests conducted in the laboratory Maxima Clinic.
3. Result
Research variable
Blood sugar is a simple sugar or monosaccharides result from the metabolism of carbohydrates, proteins and fats. The process of carbohydrate when it entered the digestive tract, then into glucose and absorbed directly into the bloodstream. Glucose is formed which is the main source of energy required by the nerve cells and to prevent disruption of nerve function and cell death. From 80 respondents only 75 respondents who prepared a blood sample. Blood sugar levels in the normal body about 28 persons (37.3%) and blood sugar levels in the body that increases about 47 persons (62.7%).
Fast food is food available in quick time and ready to eat, such as fried chicken, hamburger or pizza. The access to get fast food on the market is very easy. The market provide a variety of food to taste and purchasing power. From 80 respondents, respondents who consumed fast food about 59 respondents (73.8%), while those who did not consume fast food about 21 respondents (26.3%).
The addition of such flavoring ingredients and sweeteners to make soft drink beverages as carbonated beverages such as sugar. Soft drinks also contain from sugar-sweetened and non-sugar. Soft drinks as a sweetener derived from sugar, while the non-sugar derived from artificial sweeteners. From 80 respondents, 53 respondents (66.2%) consume soft drinks, while those who did not consume soft drinks about 27 respondents (33.8 %).
The common food processing is prepared it by heating in a pan contain oil. This process aims to produce a product that expands and crisp, in addition to improve the flavor, color, nutrition and durable power of the final product. Of the 80 respondents, respondents who consumed fried namely 60 respondents (75%) and respondents who did not consume fried foods, namely 20 respondents (25%).
0.55, which says zero hypothesis is accepted.
Distribution of Consumption Fast Food respondents according to Laboratory Test Results on students at SMAN 4 Kendari 2015 showed that 56 respondents consume fast food, as many as 46 respondents (82.1%) experienced an increase in blood sugar levels and 10 respondents (17.9%) have normal blood sugar. 19 respondents who did not consume fast food, as much as 1 respondent (5.3%) experienced an increase in blood sugar levels and 18 respondents (94.7%) have normal blood sugar levels. The results of Chi Square statistical analysis obtained by value or significance value = 0.000 and α = 0.05. While the value <α, the null hypothesis is rejected and one accepted hypothesis that there is a relationship between fast food consumption variables with blood sugar levels. Based on test analysis values obtained relationship Ro = 0.69. While the figures show a strong relationship because it is located between 0:51 - 0.75. It can be interpreted that the consumption of fast food has a strong relationship with students' blood sugar levels in SMAN 4 Kendari 2015.
The distribution of respondent consumption of soft drink according to Laboratory Test Results on students at SMAN 4 Kendari 2015 showed that 51 respondents consume soft drinks, as many as 40 respondents (78.4%) experienced an increase in blood sugar levels and 11 respondents (21.6%) have normal sugar blood. 24 respondents who did not consume soft drinks, as much as 7 respondents (29.2%) experienced an increase in blood sugar levels and 17 respondents (70.8%) normal blood sugar levels. Chi Square statistical analysis of the results obtained by the value of significance value = 0.000 and α = 0.05. The value < α, the null hypothesis is rejected and one accepted hypothesis that there is a relationship between fast food consumption variables with blood sugar levels. Based on test analysis values obtained relationship Ro = 0.47. The figures show a connection because it is located between 0:26 to 0:50. It can be interpreted that the consumption of soft drinks have no relationship with the students who have blood sugar levels in SMAN 4 Kendari 2015.
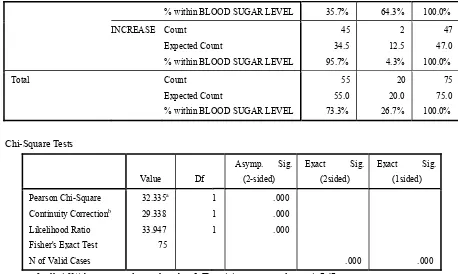
Consumption of fried distribution of respondents by Laboratory Test Results on students at SMAN 4 Kendari 2015 showed that 55 respondents consume fried foods, as many as 45 respondents (81.8%) experienced an increase in blood sugar levels and 10 respondents (18.2%) have normal blood sugar levels. 20 respondents who did not consume fried foods, as much as 2 respondents (10%) experienced an increase in blood sugar levels and 18 respondents (90%) have normal blood sugar levels. Based on the results of Chi Square test values obtained significance value = 0.000 and α = 0:05. Value <α = 0.05 showed no association between fast food consumption variables with blood sugar levels. Based on test analysis values obtained relationship Ro = 0.66. Results of these figures indicate a strong relationship because it is located between 0.51 - 0.75. These results can be interpreted that the consumption of fried food there is a strong association with blood sugar levels in SMAN 4 Kendari 2015.
4. Discussion
Blood sugar
Glucose is the result of digestion process and absorbed as a whole as carbohydrates. The absorption of glucose levels in the blood vary according to the ability of each, and can be higher after a meal and be dropped when no food intake for several hours. Glycogen process can pass freely out of and into the cells where the glucose can be used solely as a source of energy. While glucose is glycogen stored in the liver cells as insulin (a hormone that back into glucose by the action of glycogen (another hormone secreted by the pancreas) and adrenaline is a hormone secreted by the adrenal glands.
Furthermore Diabetes Mellitus is a disease characterized by blood glucose levels than normal. While Insulin produced by the pancreas is very important to maintain the balance of blood glucose levels for normal people (non-diabetic). The asting time between 60 - 120 mg/dl two hours and after eating become under 140 mg/dl. If there is interference in the working of insulin, the balance is disrupted so that the blood glucose levels tend to rise.
Results showed 75 respondents have blood sample, then the distribution of respondents according to blood sugar levels in students at SMAN 4 Kendari 2015, in which normal blood sugar as much as 28 respondents (37.3%) while the GLA blood increased by 47 respondents (62.7%) of 75 respondents SMAN 4 Kendari.
4.1 Cigarette Smoke Exposure Relationship With Improved Blood Sugar
The result showed that the respondents are passive smokers, where the distribution of respondents by cigarette smoke exposure on students in SMAN 4 Kendari 2015, in which the passive smokers as much as 69 respondents (86.3%) whereas current smokers were 11 respondents (13.8%) of the 80 respondents SMAN 4 Kendari. Cigarette smoke exposure relationship with blood sugar levels by using Chi Square statistical analysis obtained by value = 0:55. The value is value> α means that the null hypothesis is accepted. This shows that there is no association between cigarette smoke exposure variable with blood sugar levels, as shown in table 10 of cigarette smoke exposure distribution of respondents according to the results of laboratory tests on students in SMAN 4 Kendari 2015.
The relationship test in cigarette smoke variable was discontinued because the Chi Square statistical analysis results obtained value to 0:55. The value of value> α show the null hypothesis is accepted, but the exposure to cigarette smoke is an independent variable. Nothing is said to be positive and negative, but the exposure to cigarette smoke remains positive because of active smokers and passive smokers exposed to cigarette smoke only the intensity of cigarette smoke and exposed to different active and passive smokers.
4.2 Fast Food Consumption Relationship with Improved Blood Sugar
In the absorption of sugar from food have via two process stages, namely the first stage, after the food chewed in mouth, then through in gastro of retinal tract (stomach and intestines), when the group of sugar compound is converted into a single cluster of sugar and is readily absorbed by the body. Later in the second stage of the cluster of single sugar through thousands of small vessels penetrate the intestinal wall and into the blood vessels (portal vein). While blood sugar levels are kept in balance by the hormone insulin produced by the beta cells of the pancreas gland. The mechanism action of insulin in regulating the balance of blood sugar levels is by changing the cluster of single sugar into a cluster of mostly sugar compound stored in the liver. The small portion is stored in the brain as a backup first. However, if the level of sugar in the blood is still excessive, then the hormone insulin that convert excess sugar into fat and proteins through a chemical process and then save it as a second backup.
Results showed that of 80 respondents who consume fast food as much as 59 respondents, while 21 respondents did not consume fast food. Results of research conducted, from 75 respondents drawn blood sample and consume fast food as much as 56 respondents, where respondents who have normal blood sugar levels as much as 10 respondents and blood sugar levels rise as much as 46 respondents, while respondents that a blood sample but do not consume fast food as many as 19 respondents where normal blood sugar levels as much as 18 respondents and 1 respondents experienced an increase in blood sugar levels, as fast food respondent according to the results of laboratory tests on students in SMAN 4 Kendari 2015.
Based on these results, most respondents consume fast food such as fried chicken, dumplings and noodles about 42 respondents, or 52.5%. It due to the easily accessible and faster in the presentation. While the dumplings are very dominant in food in the afternoon interlude teenagers in SMAN 4 Kendari. In this study, respondents wrote ate fast food consumed in brackets the past 24 hours. Further shows 10 respondents who consume fast food but his blood sugar is normal, it is influenced by other factors and eating habits of respondents who could cover the malnutrition they consume while one respondent who did not consume fast food have increased blood sugar levels is also influenced by other factors, respondents did not consume fast food but respondents consume foods that may lead to an increase in blood sugar levels.
Relationship consumption of fast food with blood sugar levels by using Chi Square statistical analysis obtained by value to 0,000. The value of value <α, then the null hypothesis is rejected. There is a relationship between fast food consumption variables with blood sugar levels. Test relationships in the variable consumption of fast food continued in the statistical analysis values obtained Chi Square value of 0.000. Rated value <α so that the null hypothesis is rejected, then the researchers analyzed the relationship test the consumption of fast food with blood sugar so that the value ro = 0.69. As this figure shows a strong relationship because it is located between 0:51 - 0.75. Furthermore, it can be interpreted that the consumption of fast food has strong association with blood sugar levels SMAN 4 Kendari 2015.
4.3 Soft Drink Consumption Relationship with Improved Blood Sugar
Special fans carbonated soft drinks that contain phosphoric acid, there is one additional threat of another disease that kidney stone disease. The body tries to neutralize the acid by drawing calcium content of bones and teeth, when the body is difficult to digest calcium. The risk calcium accumulates in the kidneys. Calcium in a long time to crystallize and make a reduced kidney function that can lead to kidney failure.
Results showed that 80 respondents who consume soft drinks as much as 53 respondents, while 27 respondents did not consume soft drinks appropriate distribution of respondents according to the consumption of soft drinks to students at SMAN 4 Kendari 2015.
Results of research conducted, from 75 respondents drawn blood sample and consume soft drinks as much as 51 respondents, where respondents who had normal blood sugar levels as much as 11 respondents and blood sugar levels increased by 40 respondents, while respondents that have a blood sample but did not consume soft drinks as many as 24 respondents where normal blood sugar levels as much as 17 respondents and 7 respondents experienced an increase in blood sugar levels, as shown in table 13 on the distribution of soft drink consumption respondents according to the results of laboratory tests on students in SMAN 4 Kendari 2015.
Results of the study respondents consume mostly soft drinks such as Coca-cola and Sprite around 38 respondents (50.7%). It due to easily accessible and more affordable. Coca – cola is very dominant in distraction food, such as eating fast food get extra drink ; this is in line with the consumption of fast food. The student consumed soft drink when resting at night. In this study respondents write soft drinks consumed in the past 24 hours parentheses. Further shows 11 respondents who consume soft drinks but his blood sugar is normal, it is influenced by other factors and eating habits of respondents who could cover the malnutrition they eat while seven respondents who did not consume soft drinks increased blood sugar levels is also influenced by other factors, respondents did not consume soft drinks but respondents consume foods that may lead to an increase in blood sugar levels.
Relations soft drink consumption with blood sugar levels by using Chi Square statistical analysis obtained by value = 0.000. Rated value < α = 0.05 so that the null hypothesis is rejected. It implies that there is a correlation variable soft drink consumption with blood sugar levels. Test relationships in the variable soft drink consumption continued at Chi Square statistical analysis results obtained value to 0.000. Rated value < α = 0.05 so that the null hypothesis is rejected, then the researchers analyzed the relationship test soft drink consumption with blood sugar so that the value ro = 0.47. Means the figures showed there was a relationship because it is located between 0:26 to 0:50. So it can be interpreted that the consumption of soft drinks there is a relationship being with blood sugar levels SMAN 4 Kendari 2015.
4.4 Consumption Relationship Fried with Improved Blood Sugar
Foods that contain the basic nutrients as needed for the growth and health of the human body. The main source of nutrition comes from food that is consumed everyday. Errors consumption can actually get the disease from unhealthy foods. The selection in choosing food that sometimes good is not necessarily healthy for our bodies. Some people who are maintain their health and avoid directly when hear the word "fried". Fried term is often underestimated and considered useless. While hearing the word "fried", spontaneously say junk foods that carry the disease.
Results showed that 80 respondents who consume fried foods as much as 60 respondents, while 20 respondents did not consume fried foods such as table 10 on the distribution of respondents by consumption of fried foods on students in SMAN 4 Kendari 2015.
Results of research conducted, from 75 respondents drawn blood sample and consume fried foods as much as 55 respondents, where respondents who had normal blood sugar levels as much as 10 respondents and blood sugar levels rise as much as 45 respondents, while respondents that a blood sample but does not consume fried foods as much as 20 respondents where normal blood sugar levels as much as 18 respondents and two respondents experienced an increase in blood sugar levels, as shown in table 14 of the fried food consumption distribution of respondents according to the results of laboratory tests on students in SMAN 4 Kendari 2015.
According to the results of research, most respondents consume fried foods such as tofu contents, Tempe,
Jalankote and Kandoang about 53 respondents, or 70.7%. It due to easily accessible and more affordable. Meanwhile know the contents is very dominant in food interludes, such as when gather with friends and at night. In this study, respondents wrote fried foods are consumed in brackets the past 24 hours.
researchers analyzed the relationship test the blood sugar fried food consumption in order to obtain the value of Ro = 0.66. The figure shows the relationship means being as it is situated between 0:51 - 0.75. It interpreted that the consumption of fried foods there is a strong association with blood sugar levels SMAN 4 Kendari 2015. 5. Conclusion
1) The cigarette smoke have no association with increased blood sugar levels on senior high school students 4 Kendari in 2015.
2) Consumption of fast food have no association with increased blood sugar levels on senior high school students 4 Kendari in 2015 with a strong degree of closeness of relationship.
3) Consumption of soft drink have a correlation with an increase in blood sugar levels on senior high school students 4 Kendari in 2015 with a moderate degree of closeness of relationship.
4) Consumption of fried have no association with increased blood sugar levels on senior high school students 4 Kendari in 2015 with a strong degree of closeness of relationship.
6. Suggestion
1) The efforts should be made counseling to adolescents aged 16-17 years on environmental issues and nutrition, particularly regarding the increase in blood sugar levels associated with exposure to cigarette smoke, the consumption of fast food, soft drink consumption and the consumption of fried foods because of the danger of an increase in blood sugar levels and decrease resulting from the fourth proficiency level variables that have an impact on the health of the body.
2) To the health practitioner is expected to be more active to eradicate the disease Diabetes mellitus, especially against diseases that are caused by elevated blood sugar continuously, in which information from the WHO in 2014 explained that in 2020 the DM disease will be the number 1 in the World diseases deadly, as health practitioners, especially in Public Health should be more creative to cope with the disease.
3) It is expected that adolescents, especially at the age of 16-17 years can make this study as an input and information about exposure to cigarette smoke, the consumption of fast food, soft drink consumption and the consumption of fried foods, are expected to look for the impact of the fourth through the print and electronic media in order to know the impact and mitigation.
References
American Chemical Society. (2011). nicotin and Diabetes. California.
Arifin, Z. (2011). Analysis of Relationship Quality Blood Glucose Patients With Type 2 Diabetes Mellitus in the department. West Nusa Tenggara.
Arofah Diya, H.(2013). Soft Drink Consumption As Occurrence Risk Factor Obesity In Teens Age 15-17 Years. Irawan, A.M. (2004). Glucose and Energy Metabolism.
Jacobson, M. F.(2008). Liquid Candy - How Soft Drinks Are Harming Americans' Health, Diet and Diabetes Homepage. Retrieved October 30, 2014, from http://www.karlloren.com/diet/p24.htm
Maskar, D. H.(2004). Assessment of Arifin, Z. 2011. Analysis of Relationship Quality Blood Glucose Patients With Type 2 Diabetes Mellitus in the department. West Nusa Tenggara.
Notoatmodjo, S. (2010). Health Research Methodology. PT. Rineka Reserved. Jakarta.
Research and Development Agency. (2010). Results of Health Research (RISKESDAS) National. Ministry of Health.
Research and Development Agency. (2013). Results of Health Research (RISKESDAS) National. Ministry of Health.
Appendixes
Figure I
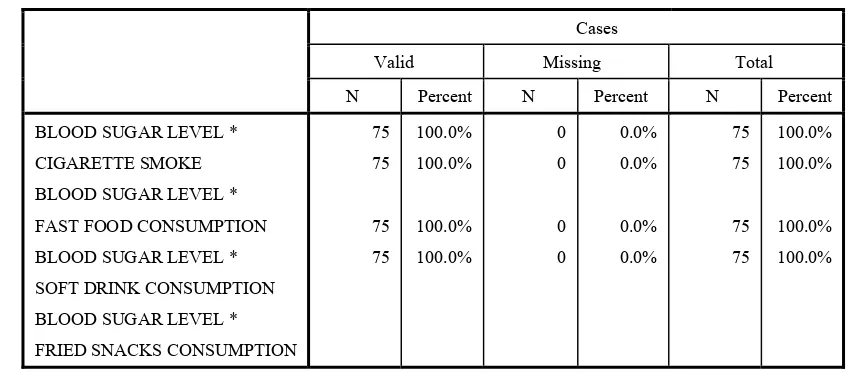
Case Processing Summary
Cases
Valid Missing Total
N Percent N Percent N Percent
BLOOD SUGAR LEVEL * CIGARETTE SMOKE BLOOD SUGAR LEVEL * FAST FOOD CONSUMPTION BLOOD SUGAR LEVEL * SOFT DRINK CONSUMPTION BLOOD SUGAR LEVEL * FRIED SNACKS CONSUMPTION
75
BLOOD SUGAR LEVEL * CIGARETTE SMOKE
Crosstab
CIGARETTE SMOKE
ACTIVE SMOKER PASSIVE SMOKER
BLOOD SUGAR LEVEL NORMAL Count
Expected Count
% within BLOOD SUGAR LEVEL
7 INCREASE Count
Expected Count
% within BLOOD SUGAR LEVEL
4
% within BLOOD SUGAR LEVEL
11
BLOOD SUGAR LEVEL NORMAL Count
Expected Count
% within BLOOD SUGAR LEVEL
28 28.0 100.0%
IMPROVE Count
Expected Count
% within BLOOD SUGAR LEVEL
47 47.0 100.0%
Total Count
Expected Count
% within BLOOD SUGAR LEVEL
Chi-Square Tests
Value Df Asymp. Sig. (2-sided) Exact Sig. (2sided) Exact Sig. (1sided)
Pearson Chi-Square Continuity Correctionb Likelihood Ratio Fisher's Exact Test N of Valid Cases
3.812a 2.608 3.681 75
1 1 1
.051 .106 .055
.088 .055
a. 1 cells (25.0%) have expected count less than 5. The minimum expected count is 4.11.
b. Computed only for a 2x2 table
Symmetric Measures
Value Approx. Sig.
Nominal by Nominal N of Valid Cases
Phi Cramer's V
.225 .225 75
.051 .051
a. Not assuming the null hypothesis.
b. Using the asymptotic standard error assuming the null hypothesis.
Risk Estimate
Value
95% Confidence Interval
Lower Upper
Odds Ratio for BLOOD SUGAR LEVEL (NORMAL / INCREASE) For cohort CIGARETTE SMOKE = ACTIVE SMOKER For cohort CIGARETTE SMOKE = PASSIVE SMOKER N of Valid Cases
3.583 2.938 .820
75
.943 .943 .651
13.612 9.147 1.033
BLOOD SUGAR LEVEL * FAST FOOD CONSUMPTION
Crosstab
FAST FOOD CONSUMPTION
Total
YES NO
BLOOD SUGAR LEVEL
NORMAL Count
Expected Count
% within BLOOD SUGAR LEVEL
10 20.9 35.7%
18 7.1 64.3%
28 28.0 100.0%
INCREASE Count
Expected Count
% within BLOOD SUGAR LEVEL
46 35.1 97.9%
1 11.9 2.1%
Total Count
Expected Count
% within BLOOD SUGAR LEVEL
Asymp. Sig. (2-sided) Exact Sig. (2sided) Fisher's Exact Test N of Valid Cases
a. 0 cells (.0%) have expected count less than 5. The minimum expected count is 7.09.
b. Computed only for a 2x2 table
Symmetric Measures
Value Approx. Sig.
Nominal by Nominal N of Valid Cases
a. Not assuming the null hypothesis.
b. Using the asymptotic standard error assuming the null hypothesis.
Risk Estimate
Value 95% Confidence Interval Lower Upper
Odds Ratio for BLOOD SUGAR LEVEL (NORMAL / INCREASE) For cohortFAST FOOD CONSUMPTION = YES For cohort FAST FOOD CONSUMPTION = YES
N of Valid Cases
BLOOD SUGAR LEVEL * SOFT DRINK CONSUMPTION
Crosstab
INCREASE Count
Expected Count
% within BLOOD SUGAR LEVEL
% within BLOOD SUGAR LEVEL Fisher's Exact Test N of Valid Cases
a. 0 cells (.0%) have expected count less than 5. The minimum expected count is 8.96.
b. Computed only for a 2x2 table
Symmetric Measures
Value Approx. Sig.
Nominal by Nominal N of Valid Cases
a. Not assuming the null hypothesis.
b. Using the asymptotic standard error assuming the null hypothesis.
Risk Estimate
Value 95% Confidence Interval Lower Upper
Odds Ratio for BLOOD SUGAR LEVEL (NORMAL / INCREASE) For cohort SOFT DRINK CONSUMPTION = YES
For cohort SOFT DRINK CONSUMPTION = NO N of Valid Cases
BLOOD SUGAR LEVEL NORMAL Count
% within BLOOD SUGAR LEVEL 35.7% 64.3% 100.0%
INCREASE Count
Expected Count
% within BLOOD SUGAR LEVEL
45
% within BLOOD SUGAR LEVEL
55 Fisher's Exact Test N of Valid Cases
a. 0 cells (.0%) have expected count less than 5. The minimum expected count is 7.47.
b. Computed only for a 2x2 table
Symmetric Measures
Value Approx. Sig.
Nominal by Nominal N of Valid Cases
a. Not assuming the null hypothesis.
b. Using the asymptotic standard error assuming the null hypothesis.
Risk Estimate
Value
95% Confidence Interval Lower Upper
Odds Ratio for BLOOD SUGAR LEVEL (NORMAL / INCREASE) For cohort FRIED SNACKS = YES
For cohort FRIED SNACKS = NO N of Valid Cases
RESPONDENT CODE NAME AGE SEX CIGARETTE SMOKE
Statistics
ARE YOU A SMOKER?
WHERE IS THE PLACE YOU
SMOKE?
HOW MANY CIGARETTES IN A
DAY?
HOW LONG HAVE YOU SMOKE?
WHY YOU DO NOT SMOKE?
N Valid Missing
80 0
80 0 80 0 80 0 80 0
Statistics
WHAT IS ONE OF YOUR FAMILY IS A SMOKER?
WHAT IS ONE OF YOUR FRIEND IS A SMOKER?
ARE YOU ALWAYS NEAR YOUR FAMILY OR FRIEND WHEN THEY ARE
SMOKING?
FAST FOOD CONSUMPTION
SOFT DRINK CONSUMPTION
N Valid
Missing 80 0 80 0 80 0 80 0 80 0
Statistics
FRIED SNACKS
CONSUMPTION BLOOD SUGAR LEVEL THE RESULT OF BLOOD SUGAR
N Valid Missing
80 0 80 0 80 0
Frequency Table
Age
Frequency Percent Valid Percent Cumulative Percent
Valid 16
17
Total
54 26 80
67.5 32.5 100.0
67.5 32.5 100.0
67.5 100.0
Sex
Frequency Percent Valid Percent Cumulative Percent
Valid MALE FEMALE Total
35 45 80
43.8 56.3 100.0
43.8 56.3 100.0
43.8 100.0
Cigarette Smoke
Valid
Frequency Percent Valid Percent Cumulative Percent
Valid YES
Where Is the Place You Smoke?
Frequency Percent Valid Percent Cumulative Percent
Valid SCHOOL
How Many Cigarettes in a Day?
Frequency Percent Valid Percent Cumulative Percent
Valid 1-10 cigarette a day 11-20 cigarette a day Total
How Long Have You Smoke?
Frequency Percent Valid Percent Cumulative Percent
Valid 1 YEAR 80 100.0 100.0 100.0
Why Yo Do Not Smoke?
Frequency Percent Valid Percent Cumulative Percent
Valid PROHIBITED BY PARENT UNABLE TO BUY
What Is One of Your Family Is a Smoker?
Frequency Percent Valid Percent Cumulative Percent
Valid YES
What Is One of Your Friend Is a Smoker?
Frequency Percent Valid Percent Cumulative Percent
Valid YES
Are You Always Near Your Family or Friend When They Are Smoking?
Valid YES
Fast Food Consumption
Frequency Percent Valid Percent Cumulative Percent
Valid YES
Soft Drink Consumption
Frequency Percent Valid Percent Cumulative Percent
Valid YES
Fried Snacks Consumption
Frequency Percent Valid Percent Cumulative Percent
Valid YES
Blood Sugar Level
Frequency Percent Valid Percent Cumulative Percent
Valid
Copyright for this articleis retained by the author(s), with first publication rights granted to the journal.