KEMENTERIAN PERTANIAN
Ministry of Agriculture, Republic of Indonesia
DIREKTORAT JENDERAL PERKEBUNAN
Directorate General of Estate Crops
STATISTIK PERKEBUNAN INDONESIA
Tree Corp Estate Statistics of Indonesia 2012 – 2014
Tanaman Rempah dan Penyegar
Spices and Beverage Crops
Asam Jawa/
Tamarind
, Cabe Jamu/
Herb Chili,
Kayu Manis/
Cassiavera
,
Gambir/
Gambier,
Pala/
Nutmeg,
Panili/
Vanilla
Pinang/
Arecanut
Asam Jawa /Tamarind Cabe Jamu /Herb Chili
Kayu Manis /Cassiavera Gambir /Gambier
ii
Statistik Perkebunan Indonesia / Tree Crop Estate Statistics of Indonesia 2012-2014
STATISTIK PERKEBUNAN INDONESIA 2012 - 2014
TREE CROP ESTATE STATISTICS OF INDONESIA 2012 -2014
Naskah/
Manuscript
Direktorat Jenderal Perkebunan,
Directorate General of Estate Crops
Kementerian Pertanian
Ministry of Agriculture
Penasehat/
Advisor
:
Ir. Mukti Sarjono, M.Sc.
Penyunting/
Senior Editors:
Ir. Bambang Sad Juga, M.Sc.
Lucky Lukmana Sukriya R. SE, M.Sc.
Staf Penyunting/
Editorial Staffs
:
Yanuar Arianto, STP
Widya Khonik Zuraina, S.Si
Eko Pudjianto, S.Kom
Asep Udin, S.Kom
Neny Kurniawati, S.Si
Susilo Novianto Damarjati, A.Md.
Diterbitkan oleh/
Published by
Direktorat Jenderal Perkebunan
Directorate General of Estate Crops
Jl. Harsono RM No.3 Gedung C
Pasar Minggu-Jakarta 12550
Kotak Pos 1060/Jkt,10010
Tlp. 021-7815380-4
Fax. 021-715486-7815586
Jakarta, Desember 2013
Jakarta, December 2013
K
K
a
a
t
t
a
a
P
P
e
e
n
n
g
g
a
a
n
n
t
t
a
a
r
r
ontribusi subsektor perkebunan terhadap perekonomian nasional
pada tahun 2012 mencapai US$ 35,64 milyar atau setara dengan
Rp. 427,68 triliun (asumsi 1 US$ = Rp. 12.000,-). Peran
perkebunan tersebut cenderung mengalami peningkatan dari tahun ke
tahun dalam memperkokoh pembangunan nasional. Agar informasi
perkebunan dapat tersebar secara luas, setiap tahun diterbitkan buku
statistik perkebunan Indonesia yang menyajikan data secara handal,
sahih, objekif, mutakhir dan konsisten.
tatistik Perkebunan Indonesia Tahun 2012-2014
menyajikan data luas areal, produksi, produktivitas baik secara
nasional maupun provinsi menurut bentuk/status pengusahaannya yaitu Perkebunan Rakyat,
Perkebunan Besar Negara dan Perkebunan Besar Swasta. Penyajian data juga dilengkapi
dengan data ekspor dan impor untuk masing-masing komoditas yang mencakup negara tujuan/asal,
volume dan nilai, harga di dalam dan luar negeri serta untuk beberapa komoditas tertentu disajikan
data keseimbangan dunia.
ata yang disajikan merupakan hasil sinkronisasi dan validasi data statistik perkebunan
2012-2014 yang dilaksanakan secara berjenjang dari tingkat kabupaten sampai tingkat nasional
dengan mengacu pada Pedoman Pelaksanaan Pengelolaan Data Komoditas Perkebunan yang
diterbitkan Direktorat Jenderal Perkebunan. Data tersebut meliputi angka tetap (ATAP) Tahun 2012,
angka sementara (ASEM) Tahun 2013 dan angka prakiraan (AESTI) Tahun 2014. Data yang
disajikan bersumber dari data primer yang dikumpulkan dari dinas yang membidangi perkebunan di
provinsi dan data sekunder yang dikutip dari data yang diterbitkan oleh Badan Pusat Statistik (BPS),
Kementerian Perindustrian, Kementerian Perdagangan, Bank Indonesia, dan publikasi yang
diterbitkan oleh asosiasi-asosiasi perkebunan baik dalam maupun luar negeri.
uku ini dapat diterbitkan, atas dukungan dan kerjasama yang baik dari berbagai pihak. Untuk
itu, pada kesempatan ini, kami mengucapkan terima kasih atas dukungan dan kerjasama
tersebut. Kami menyadari bahwa buku yang diterbitkan ini masih jauh dari sempurna. Untuk
itu, kritik dan saran yang sifatnya membangun sangat diharapkan sebagai bahan masukan dalam
perbaikan penerbitan di masa datang.
emoga apa yang disajikan dalam buku ini dapat digunakan oleh berbagai kalangan dan para
pengguna data serta dapat dijadikan acuan dalam pengambilan kebijakan.
Jakarta, Desember 2013
DIREKTUR JENDERAL PERKEBUNAN
Ir. Gamal Nasir, MS
K
S
D
B
S
iv
Statistik Perkebunan Indonesia / Tree Crop Estate Statistics of Indonesia 2012-2014
P
P
r
r
e
e
f
f
a
a
c
c
e
e
he c
ontribution of Estate Crops Sub Sector to the national
economy in 2012 was US $ 35,64 billion or equivalent to
Rp. 427,68 trillion (assumed 1 US $ = Rp. 12.000). That
role of the estate crops tends to increase significantly from year to
year in strengthening national development. Furthermore, to
spread estate crops information widely, the Estate Crop Statistics
of Indonesia is published every year that presented reliable, valid,
objective, up to date and consistent data.
he Estate Crop Statistics of Indonesia 2012-2014 presents
area, production and productivity data by province and district level of
smallholders, government and private estates. It is completed by volume, value of
both export and import data, price data for domestic and world market and also world
balance data for some commodities.
ata presented are the result of synchronization and validation of the estate crop
statistical data 2012-2014 which are held hierarchical from the district to the
national level by using guidelines of data management of estate crop
commodities. In this edition, data of the 2012 are presented as fixed data, data of the
2013 are the preliminary data and data of the 2014 are the estimation. The primary data
were collected from the Estate Crops Province Level and the secondary data were
collected from related institution such as Board of Central Statistics, Ministry of Industry,
Ministry of Trade, Central Bank of Indonesia, the publication of Estate Commodity
Associations and others.
t would have been impossible to compile this book without substantial support and
contribution from many institutions. At this opportunity, we would like to thank all for
their support and cooperation. We realize that the publication still needs further
improvement. We would greatly appreciate comments and suggestions for future
improvement.
opefully this publication will have high values for users and references for policy
makers.
Jakarta, December 2013
DIRECTOR GENERAL OF ESTATE CROPS
T
T
D
I
H
Statistik Perkebunan Indonesia / Tree Crop Estate Statistics of Indonesia 2012-2014
v
Daftar Isi/
Contents
Kata Pengantar
Preface
...
iii
Daftar Isi
Contents
...
v
Daftar Gambar
List of Figure
...
vi
Daftar Tabel
List of Tables
I. Statistik Tanaman Asam Jawa Tahun 2012-2014
Statisticals of Tamarind,
2012-2014...
1
II. Statistik Tanaman Cabe Jamu Tahun 2012-2014
Statisticals of Herbs Chili,
2012-2014 ...
19
III. Statistik Tanaman Kayu Manis Tahun 2012-2014
Statisticals of Cassiavera,
2012-2014 ...
35
IV. Statistik Tanaman Gambir Tahun 2012-2014
Statisticals of Gambier,
2012-2014 ...
59
V. Statistik Tanaman Pala Tahun 2012-2014
Statisticals of Nutmeg,
2012-2014 ...
79
VI. Statistik Tanaman Panili Tahun 2012-2014
Statisticals of Vanilla,
2012-2014 ...
109
VII. Statistik Tanaman Pinang Tahun 2012-2014
vi
Statistik Perkebunan Indonesia / Tree Crop Estate Statistics of Indonesia 2012-2014
Daftar Gambar
List of Figure
Gambar 1. 1.
Figure
Gambar 1. 2.
Figure
Gambar 2. 1.
Figure
Gambar 2. 2.
Figure
Gambar 3. 1.
Figure
Gambar 3. 2.
Figure
Gambar 4. 1.
Figure
Gambar 4. 2.
Figure
Gambar 5.1.
Figure
Gambar 5.2.
Figure
Perbandingan Luas Areal dan Produksi Asam Jawa Menurut Status
Pengusahaan Tahun 2012
Area and Production Comparison Graph of Tamarind by Farming
Category 2012 ...
Perkembangan Luas Areal, Produksi, Produktivitas dan Volume
Ekspor-Impor Asam Jawa Tahun 2007 – 2012
Area, Production, Productivity and Export-Import Volume Trend
Graph of Tamarind 2007 – 2012 ...
Perbandingan Luas Areal dan Produksi Cabe Jamu Menurut Status
Pengusahaan Tahun 2012
Area and Production Comparison Graph of Herb Chili by Farming
Category, 2012 ...
Perkembangan Luas Areal, Produksi dan Produktivitas Cabe Jamu
Tahun 2008-2012
Area, Production and Productivity Trend Graph of Herb Chili by
Farming Category, 2012...
Perbandingan Luas Areal dan Produksi Kayu Manis Menurut Status
Pengusahaan Tahun 2012
Area and Production Comparison Graph of Cassiavera by Farming
Category, 2012 ...
Perkembangan Luas Areal, Produksi , Produktivitas dan Volume
Ekspor-Impor Kayu Manis Menurut Pengusahaan Tahun 2005-2012
Area, Production, Productivity and Export – Import Volume Trend
Graph of Cassiavera by Farming Category, 2005-2012...
Perbandingan Luas Areal dan Produksi Gambir Menurut Status
Pengusahaan Tahun 2012
Area and Production Comparison Graph of Gambier by Farming
Category, 2012 ...
Perkembangan Luas Areal , Produksi, Produktivitas dan Volume
Ekspor-Impor Gambir Tahun 2005 - 2012
Area, Production, Productivity and Export-Import Volume Trend
Graph of Gambier, 2005 - 2012 ...
Perbandingan Luas Areal dan Produksi Pala Menurut Status
Pengusahaan Tahun 2012
Area and Production Comparison Graph of Nutmeg by Farming
Category, 2012 ...
Perkembangan Luas Areal, Produksi, Produktivitas dan Volume
Ekspor-Impor Pala Tahun 2005 - 2012
Area, Production, Productivity and Export-Import Volume Trend
Graph of Nutmeg by Farming Category, 2005 - 2012...
3
4
21
22
37
38
61
62
81
82
Gambar 6. 1.
Figure
Gambar 6. 2.
Figure
Gambar 7. 1.
Figure
Gambar 7. 2.
Figure
Perbandingan Luas Areal dan Produksi Panili Menurut Status
Pengusahaan Tahun 2012
Area and Production Comparison Graph of Vanilla by Farming
Category, 2012 ...
Perkembangan Luas Areal, Produksi, Produktivitas dan Volume
Ekspor – Impor Panili Tahun 2006 - 2012
Area, Production, Productivity and Export-Import Volume Trend
Graph of Vanilla,2006-2012 ...
Perbandingan Luas Areal dan Produksi Pinang Menurut Status
Pengusahaan Tahun 2012
Area and Production Comparison Graph of Arecanut by Farming
Category, 2012...
Perkembangan Luas Areal, Produksi, Produktivitas dan Volume
Ekspor-Impor Pinang Tahun 2004 - 2012
Area, Production, Productivity and Export-Import Volume Trend
Graph of Arecanut, 2004-2012 ...
111
112
137
138
Daftar Tabel
List of Table
Asam Jawa /
Tamarind
Tabel 1.1.
Table
Tabel 1.2.
Table
Tabel 1.3.
Table
Tabel 1.4.
Table
Tabel 1.5.
Table
Tabel 1.6.
Table
Luas Areal dan Produksi Asam Jawa Menurut Status Pengusahaan
Tahun 1990-2014
Area and Tamarind Production by Farming Category, 1990 – 2014...
Volume dan Nilai Ekspor - Impor Asam Jawa Tahun 2011 - 2012
Export – Import Volume and Value of Tamarind, 2011 –
2012... ...
Luas Areal dan Produksi Asam Jawa Menurut Provinsi dan Status
Pengusahaan Tahun 2012
Area and Tamarind Production by Province and Farming Category,
2012 ...
Luas Areal dan Produksi Asam Jawa Menurut Provinsi dan Status
Pengusahaan Tahun 2013
Area and Tamarind Production by Province and Farming Category,
2013 ...
Luas Areal dan Produksi Asam Jawa Menurut Provinsi dan Status
Pengusahaan Tahun 2014
Area and Tamarind Production by Province and Farming Category,
2014 ...
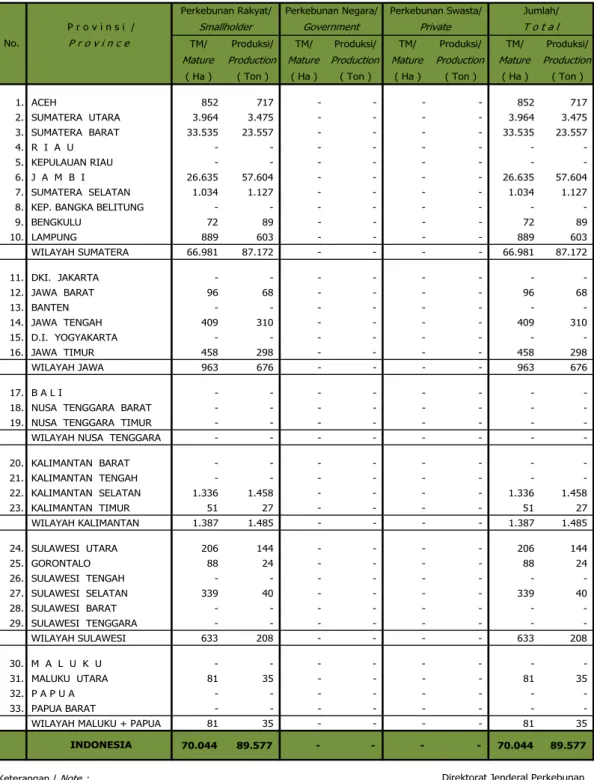
Luas Tanaman Menghasilkan dan Produksi Asam Jawa Menurut
Provinsi dan Status Pengusahaan Tahun 2012
Mature Area and Tamarind Production by Province and Farming
Category, 2012 ...
5
6
7
8
9
10
vii
viii
Statistik Perkebunan Indonesia / Tree Crop Estate Statistics of Indonesia 2012-2014
Tabel 1.7.
Table
Tabel 1.8.
Table
Tabel 1.9.
Table
Tabel 1.10.
Table
Tabel 1.11.
Table
Tabel 1.12.
Table
Tabel 1.13.
Table
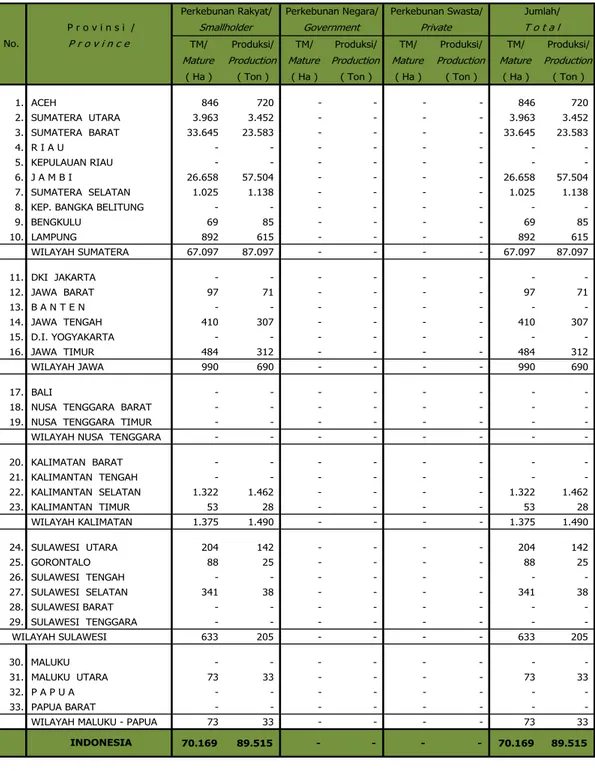
Luas Tanaman Menghasilkan dan Produksi Asam Jawa Menurut
Provinsi dan Status Pengusahaan Tahun 2013
Mature Area and Tamarind Production by Province and Farming
Category, 2013 ...
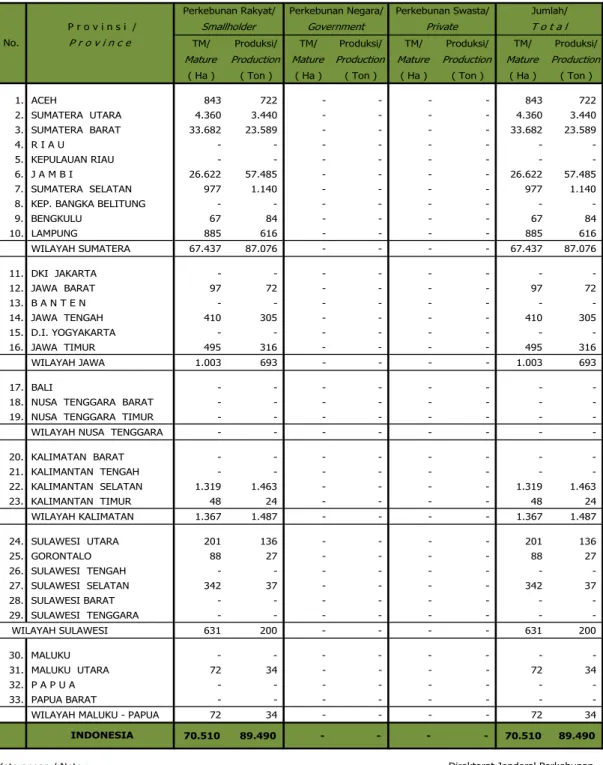
Luas Tanaman Menghasilkan dan Produksi Asam Jawa Menurut
Provinsi dan Status Pengusahaan Tahun 2014
Mature Area and Tamarind Production by Province and Farming
Category, 2014 ...
Luas Areal dan Produksi Asam Jawa Perkebunan Rakyat Menurut
Provinsi dan Keadaan Tanaman Tahun 2012
Area and Tamarind Production of Smallholder by Province and Tree
Crop Classification, 2012 ...
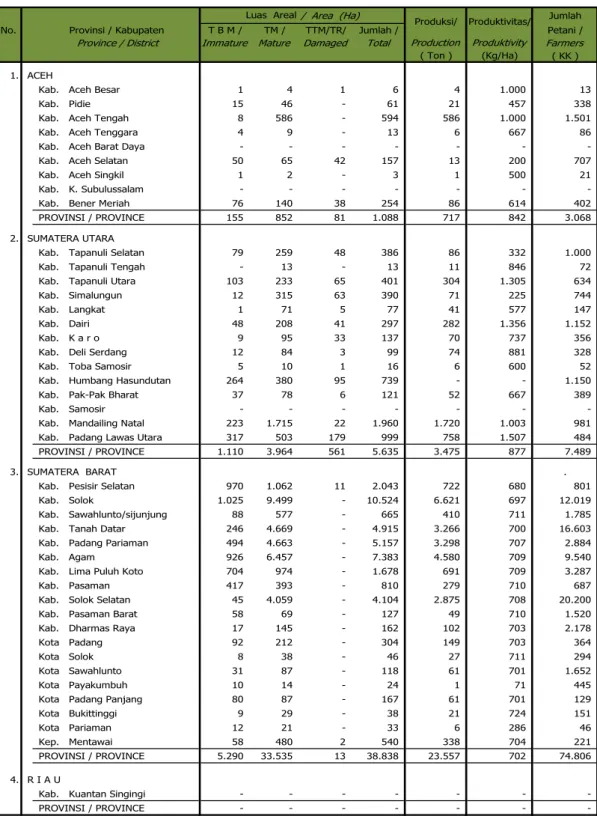
Luas Areal dan Produksi Asam Jawa Perkebunan Rakyat Menurut
Kabupaten dan Keadaan Tanaman Tahun 2012
Area and Tamarind Production of Smallholder by District and Tree
Crop Classification, 2012...
Luas Areal dan Produksi Asam Jawa Perkebunan Rakyat Menurut
Provinsi dan Keadaan Tanaman Tahun 2013
Area and Tamarind Production of Smallholder by Province and Tree
Crop Classification , 2013...
Luas Areal dan Produksi Asam Jawa Perkebunan Rakyat Menurut
Provinsi dan Keadaan Tanaman Tahun 2014
Area and Tamarind Production of Smallholder by Province and Tree
Crop Classification, 2014...
Volume dan Nilai Ekspor-Impor Asam Jawa Menurut Negara Tujuan
dan Asal Tahun 2012
Export – Import Volume and Value of Tamarind by Destination and
Origin Country, 2012...
11
12
13
14
15
16
17
Cabe Jamu/Herb Chili
Tabel 2.1.
Table
Tabel 2.2.
Table
Tabel 2.3.
Table
Tabel 2.4.
Table
Luas Areal dan Produksi Cabe Jamu Menurut Status Pengusahaan
Tahun 2008-2014
Area and Herb Chili Production by Farming Category , 2008-2014 ...
Luas Areal dan Produksi Cebe Jamu Menurut Provinsi dan Status
Pengusahaan Tahun 2012
Area and Herb Chili Production by Province and Farming Category,
2012 ...
Luas Areal dan Produksi Cebe Jamu Menurut Provinsi dan Status
Pengusahaan Tahun 2013
Area and Herb Chili Production by Province and Farming Category,
2013 ...
Luas Areal dan Produksi Cebe Jamu Menurut Provinsi dan Status
Pengusahaan Tahun 2014
Area and Herb Chili Production by Province and Farming Category,
2014 ...
23
24
25
26
Tabel 2.5.
Table
Tabel 2.6.
Table
Tabel 2.7.
Table
Tabel 2.8.
Table
Tabel 2.9.
Table
Tabel 2.10.
Table
Tabel 2.11.
Table
Luas Tanaman Menghasilkan dan Produksi Cabe Jamu Menurut
Provinsi dan Status Pengusahaan Tahun 2012
Mature Area and Herb Chili Production by Province and Farming
Category, 2012 ...
Luas Tanaman Menghasilkan dan Produksi Cabe Jamu Menurut
Provinsi dan Status Pengusahaan Tahun 2013
Mature Area and Herb Chili Production by Province and Farming
Category, 2013 ...
Luas Tanaman Menghasilkan dan Produksi Cabe Jamu Menurut
Provinsi dan Status Pengusahaan Tahun 2014
Mature Area and Herb Chili Production by Province and Farming
Category, 2014 ...
Luas Areal dan Produksi Cabe Jamu Perkebunan Rakyat Menurut
Provinsi dan Keadaan TanamanTahun 2012
Area and Herb Chili Production of Smallholder by Province and Tree
Crop Classification, 2012...
Luas Areal dan Produksi Cabe Jamu Perkebunan Rakyat Menurut
Kabupaten dan Keadaan Tanaman Tahun 2012
Area and Herb Chili Production of Smallholder by District and Tree
Crop Classification, 2012...
Luas Areal dan Produksi Cabe Jamu Perkebunan Rakyat Menurut
Provinsi dan Keadaan Tanaman Tahun 2013
Area and Herb Chili Production of Smallholder by Province and Tree
Crop Classification, 2013...
Luas Areal dan Produksi Cabe Jamu dari Perkebunan Rakyat Menurut
Provinsi dan Keadaan Tanaman Tahun 2014
Area and Herb Chili Production of Smallholder by Province and Tree
Crop Classification, 2014...
27
28
29
30
31
32
33
Kayu Manis/Cassiavera
Tabel 3.1.
Table
Tabel 3.2.
Table
Tabel 3.2.
Table
Tabel 3.4.
Table
Luas Areal dan Produksi Kayu Manis Menurut Status Pengusahaan
Tahun 1967-2014
Area and Cassiavera Production by Farming Category, 1967-2014 ...
Volume dan Nilai Ekspor-Impor Kayu Manis Tahun 1969-2012
Export-Import Volume and Value of Cassiavera, 1969-2012 ...
Luas Areal dan Produksi Kayu Manis Menurut Provinsi dan
Status Pengusahaan Tahun 2012
Area and Cassiavera Production by Province and Farming Category,
2012 ...
Luas Areal dan Produksi Kayu Manis Menurut Provinsi dan Status
Pengusahaan Tahun 2013
Area and Cassiavera Production by Province and Farming Category,
2013 ...
39
40
41
42
ix
x
Statistik Perkebunan Indonesia / Tree Crop Estate Statistics of Indonesia 2012-2014
Tabel 3.5.
Table
Tabel 3.6.
Table
Tabel 3.7.
Table
Tabel 3.8.
Table
Tabel 3.9.
Table
Tabel 3.10.
Table
Tabel 3.11.
Table
Tabel 3.12.
Table
Tabel 3.13.
Table
Tabel 3.14.
Table
Luas Areal dan Produksi Kayu Manis Menurut Provinsi dan
Status Pengusahaan Tahun 2014
Area and Cassiavera Production by Province and Farming Category,
2014 ...
Luas Tanaman Menghasilkan dan Produksi Kayu Manis Menurut
Provinsi dan Status Pengusahaan Tahun 2012
Mature Area and Cassiavera Production by Province and Farming
Category, 2012 ...
Luas Tanaman Menghasilkan dan Produksi Kayu Manis Menurut
Provinsi dan Status Pengusahaan Tahun 2013
Mature Area and Cassiavera Production by Province and Farming
Category, 2013 ...
Luas Tanaman Menghasilkan dan Produksi Kayu Manis Menurut
Provinsi dan Pengusahaan Tahun 2014
Mature Area and Cassivera Production by Province and Farming
Category, 2014 ...
Luas Areal dan Produksi Kayu Manis Perkebunan Rakyat Menurut
Provinsi dan Keadaan Tanaman Tahun 2012
Area and Cassivera Production of Smallholder by Province and Tree
Crop Classification, 2012 ...
Luas Areal dan Produksi Kayu Manis Perkebunan Rakyat Menurut
Kabupaten dan Keadaan Tanaman Tahun 2012
Area and Cassivera Production of Smallholder by District and Tree
Crop Classification, 2012 ...
Luas Areal dan Produksi Kayu Manis dari Perkebunan Rakyat Menurut
Provinsi dan Keadaan Tanaman Tahun 2013
Area and Cassivera Production of Smallholder by Province and Tree
Crop Classification, 2013 ...
Luas Areal dan Produksi Kayu Manis Perkebunan Rakyat Menurut
Provinsi dan Keadaan Tanaman Tahun 2014
Area and Cassivera Production of Smallholder by Province and Tree
Crop Classification, 2014...
Volume dan Nilai Ekspor-Impor Kayu Manis Menurut Negara Tujuan
dan Asal Tahun 2012
Export-Import Volume and Value of Cassiavera by Destination and
Origin Country , 2012 ...
Perkembangan Harga Rata – rata Tahunan Kayu Manis di Pasar
Domestik Tahun 2001-2012
Annually Average Price Trend of Cassiavera in Domestic Market,
2010-2013...
43
44
45
46
47
48
52
53
54
58
Gambir/Gambier
Tabel 4.1.
Table
Tabel 4.2.
Table
Tabel 4.3.
Table
Tabel 4.4.
Table
Tabel 4.5.
Table
Tabel 4.6.
Table
Tabel 4.7.
Table
Tabel 4.8.
Table
Tabel 4.9.
Table
Tabel 4.10.
Table
Tabel 4.11.
Table
Luas Areal dan Produksi Gambir Menurut Status Pengusahaan
Tahun 2002-2014
Area and Gambier Production by Farming Category, 2002 – 2014 ...
Volume dan Nilai Ekspor-Impor Gambir Indonesia Tahun 2004-2012
Export-Import Volume and Value of Gambier, 2004-2012 ...
Luas Areal dan Produksi Gambir Menurut Provinsi dan Status
Pengusahaan Tahun 2012
Area and Gambier Production by Province and Farming Category,
2012 ...
Luas Areal dan Produksi Gambir Menurut Provinsi dan Status
Pengusahaan Tahun 2013
Area and Gambier Production by Province and Farming Category ,
2013 ...
Luas Areal dan Produksi Gambir Menurut Provinsi dan Status
Pengusahaan Tahun 2014
Area and Gambier Production by Province and Farming Category,
2014 ...
Luas Tanaman Menghasilkan dan Produksi Gambir Menurut Provinsi
dan Status Pengusahaan Tahun 2012
Mature Area and Gambier Production by Province and Farming
Category , 2012 ...
Luas Tanaman Menghasilkan dan Produksi Gambir Menurut Provinsi
dan Status Pengusahaan Tahun 2013
Mature Area and Gambier Production by Province and Farming
Category, 2013 ...
Luas Tanaman Menghasilkan dan Produksi Gambir Menurut Provinsi
dan Status Pengusahaan Tahun 2014
Mature Area and Gambier Production by Province and Farming
Category, 2014 ...
Luas Areal dan Produksi Gambir Perkebunan Rakyat Menurut Provinsi
dan Keadaan Tanaman Tahun 2012
Area and Gambier Production of Smallholder by Province and Tree
Crop Classification, 2012 ...
Luas Areal dan Produksi Gambir Perkebunan Rakyat Menurut
Kabupaten dan Keadaan Tanaman Tahun 2012
Area and Gambier Production of Smallholder by District and Tree
Crop Classification, 2012 ...
Luas Areal dan Produksi Gambir Perkebunan Rakyat Menurut Provinsi
dan Keadaan Tanaman Tahun 2013
Area and Gambier Production of Smallholder by Province and Tree
Crop Classification, 2013 ...
63
64
65
66
67
68
69
70
71
72
74
xi
xii
Statistik Perkebunan Indonesia / Tree Crop Estate Statistics of Indonesia 2012-2014
Tabel 4.12.
Table
Tabel 4.13.
Table
Tabel 4.14.
Table
Luas Areal dan Produksi Gambir Perkebunan Rakyat Menurut Provinsi
dan Keadaan Tanaman Tahun 2014
Area and Gambier Production of Smallholder by Province and Tree
Crop Classification, 2014 ...
Volume Dan Nilai Ekspor-Impor Gambir Menurut Negara Tujuan
Dan Asal Tahun 2012
Export-Import Volume and Value of Gambier by Destination and
Origin Country, 2012 ...
Perkembangan Harga Rata- Rata Tahunan Gambir Di Pasar Domestik
dan Dunia Tahun 2003-2012
Annually Average Price Trend of Gambier In Domestic and World
Market, 2003 – 2012 ...
75
76
77
Pala/Nutmeg
Tabel 5.1.
Table
Tabel 5.2.
Table
Tabel 5.3.
Table
Tabel 5.4.
Table
Tabel 5.5.
Table
Tabel 5.6.
Table
Tabel 5.7.
Table
Luas Areal dan Produksi Pala Menurut Status Pengusahaan Tahun
1976-2014
Area and Nutmeg Production by Farming Category, 1976-2014 ...
Volume dan Nilai Ekspor-Impor Pala Tahun 1969-2012
Export-Import Volume and Value of Nutmeg,1969-2012 ...
Luas Areal dan Produksi Pala Menurut Provinsi dan Status
Pengusahaan Tahun 2012
Area and Nutmeg Production by Province and Farming Category,
2012 ...
Luas Areal dan Produksi Pala Menurut Provinsi dan Status
Pengusahaan Tahun 2013
Area and Nutmeg Production by Province and Farming Category,
2013 ...
Luas Areal dan Produksi Pala Menurut Provinsi dan Status
Pengusahaan Tahun 2014
Area and Nutmeg Production by Province and Farming Category,
2014 ...
Luas Tanaman Menghasilkan dan Produksi Pala Menurut Provinsi
dan Status Pengusahaan Tahun 2012
Mature Area and Nutmeg Production by Province and Farming
Category, 2012 ...
Luas Tanaman Menghasilkan dan Produksi Pala Menurut Provinsi
dan Status Pengusahaan Tahun 2013
Mature Area and Nutmeg Production by Province and Farming
Category, 2013 ...
83
84
85
86
87
88
89
Tabel 5.8.
Table
Tabel 5.9.
Table
Tabel 5.10.
Table
Tabel 5.11.
Table
Tabel 5.12.
Table
Tabel 5.13.
Table
Tabel 5.14.
Table
Tabel 5.15.
Table
Tabel 5.16.
Table
Tabel 5.17.
Table
Luas Tanaman Menghasilkan dan Produksi Pala Menurut Provinsi
dan Status Pengusahaan Tahun 2014
Mature Area and Nutmeg Production by Province and Farming
Category, 2014 ...
Luas Areal dan Produksi Pala Perkebunan Rakyat, Besar Negara dan
Besar Swasta (PR+PBN+PBS) Menurut Provinsi dan Keadaan
Tanaman Tahun 2012
Area and Nutmeg Production of Smallholder, Government and Private
Estate by Province and Tree Crops Classification, 2012...
Luas Areal dan Produksi Pala Perkebunan Rakyat, Besar Negara dan
Besar Swasta (PR+PBN+PBS) Menurut Provinsi dan Keadaan
Tanaman Tahun 2013
Area and Nutmeg Production of Smallholder, Government and Private
Estate by Province and Tree Crops Classification, 2013...
Luas Areal dan Produksi Pala Perkebunan Rakyat, Besar Negara dan
Besar Swasta (PR+PBN+PBS) Menurut Provinsi dan Keadaan
Tanaman Tahun 2014
Area and Nutmeg Production of Smallholder, Government and Private
Estate by Province and Tree Crops Classification, 2014...
Luas Areal dan Produksi Pala Perkebunan Rakyat Menurut Provinsi
dan Keadaan Tanaman Tahun 2012
Area and Nutmeg Production of Smallholder by Province and Tree
Crop Classification, 2012 ...
Luas Areal dan Produksi Pala Perkebunan Rakyat Menurut Kabupaten
dan Keadaan Tanaman Tahun 2012
Area and Nutmeg Production of Smallholder by District and Tree Crop
Classification, 2012 ...
Luas Areal dan Produksi Pala dari Perkebunan Rakyat Menurut
Provinsi dan Keadaan Tanaman Tahun 2013
Nutmeg Area and Production of Smallholder by Province and Tree
Crop Classifications, 2013 ...
Luas Areal dan Produksi Pala Perkebunan Rakyat Menurut Provinsi
dan Keadaan Tanaman Tahun 2014
Area and Nutmeg Production of Smallholder by Province and Tree
Crop Classification, 2014...
Luas Areal dan Produksi Pala Perkebunan Besar Negara Menurut
Provinsi dan Keadaan Tanaman Tahun 2012
Area and Nutmeg Production of Government Estate by District and
Tree Crop Classification, 2012 ...
Luas Areal dan Produksi Pala Perkebunan Besar Negara Menurut
Province dan Keadaan Tanaman Tahun 2013
Area and Nutmeg Production of Government Estate by Province and
Tree Crop Classification, 2013 ...
90
91
92
93
94
95
101
102
103
104
xiii
xiv
Statistik Perkebunan Indonesia / Tree Crop Estate Statistics of Indonesia 2012-2014
Tabel 5.18.
Table
Tabel 5.19.
Table
Tabel 5.20.
Table
Luas Areal dan Produksi Pala Perkebunan Besar Negara Menurut
Provinsi dan Keadaan Tanaman Tahun 2014
Area and Nutmeg Production of Government Estate by Province and
Tree Crop Classification, 2014 ...
Volume dan Nilai Ekspor-Impor Pala Menurut Negara Tujuan dan
Asal Tahun 2012
Expport-Import Volume and Value of Nutmeg by Destination and
Origin Country, 2012 ...
Perkembangan Harga Bulanan Komoditi Pala di Pasar Domestik
Tahun 2012
Monthly Average Price Trend In Domestic Market, 2012 ...
105
106
107
Panili /
Vanilla
Tabel 6.1.
Table
Tabel 6.2.
Table
Tabel 6.3.
Table
Tabel 6.4.
Table
Tabel 6.5.
Table
Tabel 6.6
Table
Tabel 6.7
Table
Tabel 6.8
Table
Tabel 6.9.
Table
Luas Areal dan Produksi Panili Menurut Status Pengusahaan Tahun
1977-2014
Area and Vanilla Production by Farming Category, 1977-2014...
Volume dan Nilai Ekspor-Impor Panili Tahun 1969-2012
Export-Import Volume and Value of Vanilla ,1969-2012 ...
Luas Areal dan Produksi Panili Menurut Provinsi dan Status
Pengusahaan Tahun 2012
Area and Vanilla Production by Province and Farming Category, 2012..
Luas Areal dan Produksi Panili Menurut Provinsi dan Status
Pengusahaan Tahun 2013
Area and Vanilla Production by Province and Farming Category, 2013 .
Luas Areal dan Produksi Panili Menurut Provinsi dan Status
Pengusahaan Tahun 2014
Area and Vanilla Production by Province and Farming Category, 2014 .
Luas Tanaman Menghasilkan dan Produksi Menurut Provinsi dan
Status Pengusahaan Tahun 2012
Mature Area and Vanilla Production by Province and Farming
Category, 2012 ...
Luas Tanaman Menghasilkan dan Produksi Panili Menurut Provinsi
dan Status Pengusahaan Tahun 2013
Mature Area and Vanilla Production by Province and Farming
Category, 2013 ...
Luas Tanaman Menghasilkan dan Produksi Panili Menurut Provinsi
dan Status Pengusahaan Tahun 2014
Mature Area and Vanilla Production of by Province and Farming
Category, 2014 ...
Luas Areal dan Produksi Panili Perkebunan Rakyat, Besar Negara dan
Besar Swasta (PR+PBN+PBS) Menurut Provinsi dan Keadaan
Tanaman Tahun 2012
Area and Vanilla Production of Smallholder, Government and Private
Estate by Province and Tree Crops Classification, 2012...
113
114
115
116
117
118
119
120
121
Tabel 6.10.
Table
Tabel 6.11.
Table
Tabel 6.12.
Table
Tabel 6.13.
Table
Tabel 6.14.
Table
Tabel 6.15.
Table
Tabel 6.16.
Table
Tabel 6.17.
Table
Luas Areal dan Produksi Panili Perkebunan Rakyat, Besar Negara dan
Besar Swasta (PR+PBN+PBS) Menurut Provinsi dan Keadaan
Tanaman Tahun 2013
Area and Vanilla Production of Smallholder, Government and Private
Estate by Province and Tree Crops Classification, 2013...
Luas Areal dan Produksi Panili Perkebunan Rakyat, Besar Negara dan
Besar Swasta (PR+PBN+PBS) Menurut Provinsi dan Keadaan
Tanaman Tahun 2014
Area and Vanilla Production of Smallholder, Government and Private
Estate by Province and Tree Crops Classification, 2014...
Luas Areal dan Produksi Panili Perkebunan Rakyat Menurut Provinsi
dan Keadaan Tanaman Tahun 2012
Area and Vanilla Production of Smallholder by Province and Tree Crop
Classificaion, 2012 ...
Luas Areal dan Produksi Panili Perkebunan Rakyat Menurut
Kabupaten dan Keadaan Tanaman Tahun 2012
Area and Vanilla Production of Smallholder by District and Tree Crop
Classification, 2012...
Luas Areal dan Produksi Panili Perkebunan Rakyat Menurut Provinsi
dan Keadaan Tanaman Tahun 2013
Area and Vanilla Production of Smallholder by Province and Tree Crop
Classification, 2013...
Luas Areal dan Produksi Panili Perkebunan Rakyat Menurut Provinsi
dan Keadaan Tanaman Tahun 2014
Vanilla Area and Production of Smallholder by Province and Tree
Crop Classifications, 2014 ...
Volume dan Nilai Ekspor-Impor Panili Menurut Negara Tujuan dan
Asal Tahun 2012
Export-Import Volume and Value of Vanilla by Destination and Origin
Country,2012 ...
Perkembangan Harga Rata - rata Tahunan Panili di Pasar Domestik
Tahun 1987-2012
Annually Average Price Trend of Vanilla in Domestic Market,
1987-2012 ...
122
123
124
125
131
132
133
134
Pinang /
Arecanut
Tabel 7.1.
Table
Tabel 7.2.
Table
Tabel 7.3.
Table
Luas Areal dan Produksi Pinang Menurut Status Pengusahaan
Tahun 1984-2014
Area and Arecanut Production by Farming Category, 1984 -2014 ...
Volume dan Nilai Ekspor-Impor Pinang Tahun 1976-2012
Export-Import Volume and Value of Arecanut,1976-2012...
Luas Areal dan Produksi Pinang Menurut Provinsi dan Status
Pengusahaan Tahun 2012
Area and Arecanut Production by Province and Farming Category,
2012 ...
139
140
141
xv
xvi
Statistik Perkebunan Indonesia / Tree Crop Estate Statistics of Indonesia 2012-2014
Tabel 7.4.
Table
Tabel 7.5.
Table
Tabel 7.6.
Table
Tabel 7.7.
Table
Tabel 7.8.
Table
Tabel 7.9.
Table
Tabel 7.10.
Table
Tabel 7.11.
Table
Tabel 7.12.
Table
Tabel 7.13.
Table
Luas Areal dan Produksi Pinang Menurut Provinsi dan Status
Pengusahaan Tahun 2013
Area and Arecanut Production by Province and Farming Category,
2013 ...
Luas Areal dan Produksi Pinang Menurut Provinsi
dan
Status
Pengusahaan Tahun 2014
Area and Arecanut Production by Province and Farming Category,
2014 ...
Luas Tanaman Menghasilkan dan Produksi Pinang Menurut Provinsi
dan Status Pengusahaan Tahun 2012
Mature Area and Arecanut Production by Farming Category, 2012...
Luas Tanaman Menghasilkan dan Produksi Pinang Menurut Provinsi
dan Status Pengusahaan Tahun 2013
Mature Area and Arecanut Production by Farming Category, 2013...
Luas Tanaman Menghasilkan dan Produksi Pinang Menurut Provinsi
dan Status Pengusahaan Tahun 2014
Mature Area and Arecanut Production by Farming Category, 2014...
Luas Areal dan Produksi Pinang Perkebunan Rakyat Menurut Provinsi
dan Keadaan Tanaman Tahun 2012
Area and Arecanut Production of Smallholder by Province and Tree
Crop Classifications, 2012 ...
Luas Areal dan Produksi Pinang Perkebunan Rakyat Menurut
Kabupaten dan Keadaan Tanaman Tahun 2012
Area and Arecanut Production of Smallholder by Districts and Tree
Crop Classifications, 2012 ...
Luas Areal dan Produksi Pinang Perkebunan Rakyat Menurut Provinsi
dan Keadaan Tanaman Tahun 2013
Area and Arecanut Production of Smallholder by Province and Tree
Crop Classification, 2013 ...
Luas Areal dan Produksi Pinang Perkebunan Rakyat Menurut Provinsi
dan Keadaan Tanaman Tahun 2014
Area and Arecanut Production of Smallholder by Province and Tree
Crop Classifications, 2014 ...
Volume dan Nilai Ekspor-Impor Pinang Menurut Negara Tujuan dan
Asal Tahun 2012
Export-Import Volume and Value of Arecanut by Destination and
Origin Country, 2012 ...
142
143
144
145
146
147
148
155
156
157
Statistik Perkebunan Indonesia / Tree Crop Estate Statistics of Indonesia 2012-2014
1
BAB I
STATISTIK TANAMAN ASAM JAWA TAHUN 2012 - 2014
Statisticals of Tamarind, 2012 - 2014
Statistik Perkebunan Indonesia / Tree Crop Estate Statistics of Indonesia 2012-2014
3
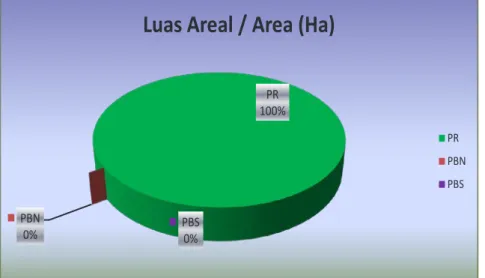
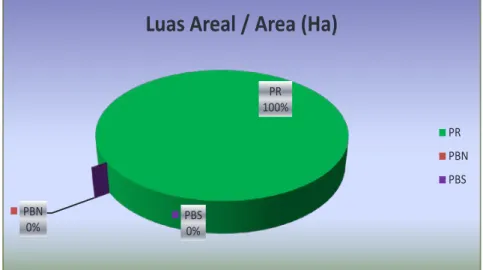
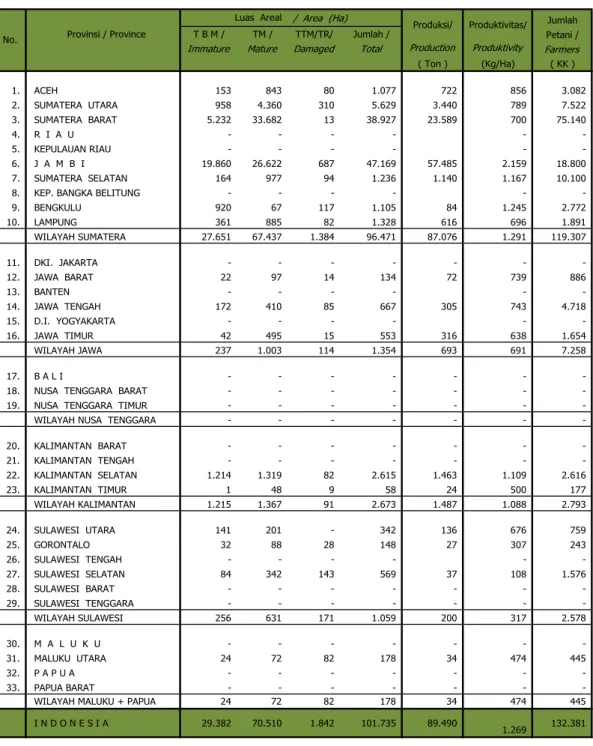
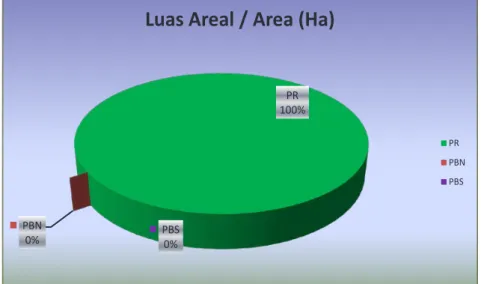
Gambar 1. Perbandingan Luas Areal dan Produksi Asam Jawa Menurut Status Pengusahaan
Tahun 2012
Figure
Area and Production Comparison Graph of Tamarind by Farming Category, 2012
PR
100%
PBN
0%
PBS
0%
Luas Areal / Area (Ha)
PR
PBN
PBS
PR
100%
PBN
0%
PBS
0%
Produksi / Production (Ton)
PR
PBN
PBS
4
Statistik Perkebunan Indonesia / Tree Crop Estate Statistics of Indonesia 2012-2014
Gambar 2. Perkembangan Luas Areal, Produksi, Produktivitas dan Volume Ekspor-Impor
Asem Jawa Tahun 2008 - 2012
Figure
Area, Production, Productivity and Export-Import Volume Trend Graph of Tamarind,
2008 - 2012
Statistik Perkebunan Indonesia/Tree Crop Estate Statistics of Indonesia 2012-2014
4
P
P
P
-1.000
2.000
3.000
4.000
5.000
08 09 10 11 12
PBS
PBN
PR
Produksi
Produksi / Production (Ton)
P
P
P
-1.000
2.000
3.000
4.000
5.000
08 09 10 11 12
PBS
PBN
PR
Luas Area
Luas Areal / Area (Ha)
08
09
10
11
12
PR 1.192 1.324 1.287 1.049 1.135
PBN
-
-
-
-
-PBS
-
-
-
-
-200
400
600
800
1.000
1.200
1.400
1.600
Produktivitas/Productivity (Kg/Ha)
I
E
-5.000
10.000
15.000
08 09 10 11 12
IMPOR
EKSPOR
Volume
Volume Ekspor -Impor/
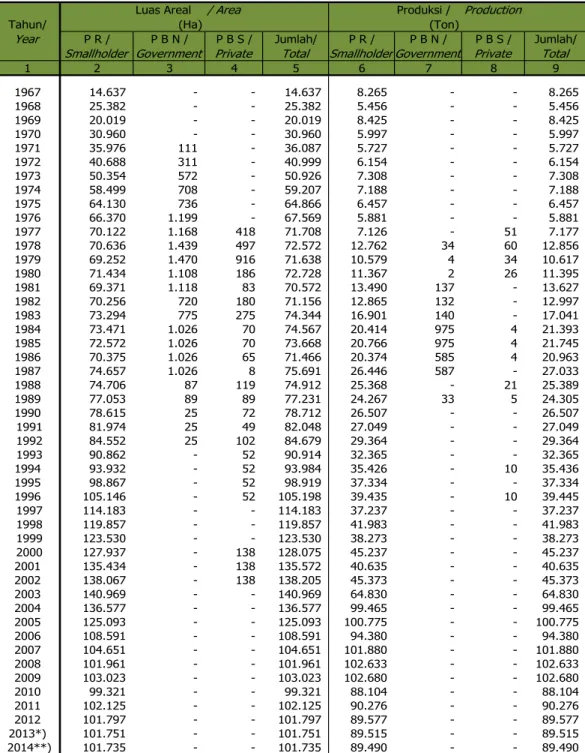
Luas Areal dan Produksi Asam Jawa Menurut Status Pengusahaan
Tahun 1990-2014
Area and Tamarind Production by Farming Category, 1990 - 2014
/Area
Tahun/
(Ha)
(Ton)
Year
P R /
P B N /
P B S /
Jumlah/
P R /
P B N /
P B S /
Jumlah/
Smallholders Government Private
Total
Smallholders Government Private
Total
1990
8.042
-
-
8.042
8.994
-
-
8.994
1991
8.491
-
-
8.491
9.793
-
-
9.793
1992
8.282
-
-
8.282
10.327
-
-
10.327
1993
8.205
-
-
8.205
10.005
-
-
10.005
1994
8.999
-
-
8.999
10.325
-
-
10.325
1995
8.040
-
-
8.040
10.378
-
-
10.378
1996
8.309
-
-
8.309
10.351
-
-
10.351
1997
8.459
-
-
8.459
10.435
-
-
10.435
1998
5.499
-
-
5.499
8.474
-
-
8.474
1999
4.758
-
-
4.758
5.874
-
-
5.874
2000
5.729
-
-
5.729
7.763
-
-
7.763
2001
5.226
-
-
5.226
6.980
-
-
6.980
2002
5.231
-
-
5.231
6.810
-
-
6.810
2003
4.898
-
-
4.898
6.511
-
-
6.511
2004
4.866
-
-
4.866
5.338
-
-
5.338
2005
4.656
-
-
4.656
4.820
-
-
4.820
2006
4.785
-
-
4.785
4.862
-
-
4.862
2007
4.100
-
-
4.100
4.309
-
-
4.309
2008
4.557
-
-
4.557
4.374
-
-
4.374
2009
4.258
-
-
4.258
4.409
-
-
4.409
2010
4.484
-
-
4.484
4.280
-
-
4.280
2011
4.398
-
-
4.398
3.358
-
-
3.358
2012
4.254
-
-
4.254
3.453
-
-
3.453
2013*)
4.250
-
-
4.250
3.465
-
-
3.465
2014**)
4.249
-
-
4.249
3.485
-
-
3.485
Keterangan / Note :
1. *) Angka Sementara /Preliminary
2. **) Angka estimasi / Estimation
3. Wujud Produksi / Production : Buah Kering / Dried Tamarind
Luas Areal
Produksi / Production
Tabel 1.1.
Table
DIREKTORAT JENDERAL PERKEBUNAN
6
Statistik Perkebunan Indonesia / Tree Crop Estate Statistics of Indonesia 2012-2014
Tabel 1.2.
Volume dan Nilai Ekspor - Impor Asam Jawa Tahun 2011 - 2012
Table
Export - Import Volume and Value of Tamarind, 2011 - 2012
Volume
Nilai
Volume
Nilai
Volume
Value
Volume
Value
(Ton )
(000US$)
(Ton )
(000US$)
2011
2.757
3.274
6.473
2.856
2012
10.738
4.062
5.688
3.297
Sumber / Source : Badan Pusat Statistik
Central Bureau Of Statistic
Statistik Perkebunan Indonesia/Tree Crop Estate Statistics of Indonesia 2012-2014
6
Tahun
EKSPOR /
Export
IMPOR /
Import
Year
DIREKTORAT JENDERAL PERKEBUNAN
Luas Areal dan Produksi Asam Jawa Menurut Provinsi dan Status Pengusahaan Tahun 2012
Area and Tamarind Production by Province and Farming Category, 2012
No. Provinsi /
Province
Luas Areal Produksi Luas Areal Produksi Luas Areal Produksi Luas Areal ProduksiArea Production Area Production Area Production Area Production
(Ha) (Ton) (Ha) (Ton) (Ha) (Ton) (Ha) (Ton)
1. A C E H - - - - - - - -2. SUMATERA UTARA - - - - - - - -3. SUMATERA BARAT - - - - - - - -4. R I A U - - - - - - - -5. KEPULAUAN RIAU - - - - - - - -6. J A M B I - - - - - - - -7. SUMATERA SELATAN - - - - - - -
-8. KEP. BANGKA BELITUNG - - - - - - -
-9. BENGKULU - - - - - - - -10 LAMPUNG - - - - - - - -- - - - - - - -11. DKI. JAKARTA - - - - - - - -12. JAWA BARAT - - - - - - - -13. BANTEN - - - - - - - -14. JAWA TENGAH 103 47 - - - - 103 47 15. D.I. YOGYAKARTA - - - - - - - -16. JAWA TIMUR 861 1.003 - - - - 861 1.003 964 1.050 - - - - 964 1.050 17. B A L I - - - - - - -
-18. NUSA TENGGARA BARAT 2.989 2.121 - - - - 2.989 2.121 19. NUSA TENGGARA TIMUR - - - - - - -
-2.989 2.121 - - - - 2.989 2.121 20. KALIMANTAN BARAT - - - - - - - -21. KALIMANTAN TENGAH - - - - - - - -22. KALIMANTAN SELATAN - - - - - - - -23. KALIMANTAN TIMUR - - - - - - - -- - - - - - - -24. SULAWESI UTARA - - - - - - - -25. GORONTALO - - - - - - - -26. SULAWESI TENGAH - - - - - - - -27. SULAWESI SELATAN 57 56 - - - - 57 56 28. SULAWESI BARAT - - - - - - - -29 SULAWESI TENGGARA 244 227 - - - - 244 227 301 283 - - - - 301 283 30. M A L U K U - - - - - - - -31. MALUKU UTARA - - - - - - - -32. PAPUA - - - - - - - -33. PAPUA BARAT - - - - - - - -- - - - - - - -4.254 3.453 - - - - 4.254 3.453 Keterangan / Note : 1. Angka Tetap / Fixed
DIREKTORAT JENDERAL PERKEBUN
Directorate General of Estate Crops
2. Wujud Produksi / Production : Asam Jawa / Tamarind
Tabel 1.3
Table
Perkebunan Rakyat Perkebunan Negara Perkebunan Swasta Jumlah
Smallhoders Government Private Total
I N D O N E S I A WILAYAH SUMATERA
WILAYAH JAWA
WIL. NUSA TENGGARA + BALI
WILAYAH KALIMANTAN
WILAYAH SULAWESI
8
Statistik Perkebunan Indonesia / Tree Crop Estate Statistics of Indonesia 2012-2014
Luas Areal dan Produksi Asam Jawa Menurut Provinsi dan Status Pengusahaan Tahun 2013 *)
Area and Tamarind Production by Province and Farming Category, 2013*)
No. Provinsi /
Province
Luas/ Produksi Luas/ Produksi Luas/ Produksi Luas/ ProduksiArea Production Area Production Area Production Area Production
(Ha) (Ton) (Ha) (Ton) (Ha) (Ton) (Ha) (Ton)
1. A C E H - - - - - - - -2. SUMATERA UTARA - - - - - - - -3. SUMATERA BARAT - - - - - - - -4. R I A U - - - - - - - -5. KEPULAUAN RIAU - - - - - - - -6. J A M B I - - - - - - - -7. SUMATERA SELATAN - - - - - - -
-8. KEP. BANGKA BELITUNG - - - - - - -
-9. BENGKULU - - - - - - - -10 LAMPUNG - - - - - - - -- - - - - - - -11. DKI. JAKARTA - - - - - - - -12. JAWA BARAT - - - - - - - -13. BANTEN - - - - - - - -14. JAWA TENGAH 104 47 - - - - 104 47 15. D.I. YOGYAKARTA - - - - - - - -16. JAWA TIMUR 860 1.012 - - - - 860 1.012 964 1.060 - - - - 964 1.060 17. B A L I - - - - - - -
-18. NUSA TENGGARA BARAT 2.984 2.122 - - - - 2.984 2.122
19. NUSA TENGGARA TIMUR - - - - - - -
-2.984 2.122 - - - - 2.984 2.122 20. KALIMANTAN BARAT - - - - - - - -21. KALIMANTAN TENGAH - - - - - - - -22. KALIMANTAN SELATAN - - - - - - - -23. KALIMANTAN TIMUR - - - - - - - -- - - - - - - -24. SULAWESI UTARA - - - - - - - -25. GORONTALO - - - - - - - -26. SULAWESI TENGAH - - - - - - - -27. SULAWESI SELATAN 58 56 - - - - 58 56 28. SULAWESI BARAT - - - - - - - -29 SULAWESI TENGGARA 244 227 - - - - 244 227 302 283 - - - - 302 283 30. M A L U K U - - - - - - - -31. MALUKU UTARA - - - - - - - -32. PAPUA - - - - - - - -33. PAPUA BARAT - - - - - - - -- - - - - - - -4.250 3.465 - - - - 4.250 3.465
Keterangan / Note : DIREKTORAT JENDERAL PERKEBUNAN
1. *) Angka Sementara / Preliminary Directorate General of Estate Crops
2. Wujud Produksi / Production : Asam Jawa / Tamarind
Statistik Perkebunan Indonesia/Tree Crop Estate Statistics of Indonesia 2012-2014
8
Tabel 1.4
Table
Perkebunan Rakyat Perkebunan Negara Perkebunan Swasta
Smallhoders Government Private
WILAYAH SUMATERA
WILAYAH JAWA
WIL. NUSA TENGGARA + BALI
WILAYAH KALIMANTAN
WILAYAH SULAWESI
Jumlah /
Total
WILAYAH MALUKU + PAPUA
Luas Areal dan Produksi Asam Jawa Menurut Provinsi dan Status Pengusahaan Tahun 2014 **)
Area and Tamarind Production by Province and Farming Category, 2014**)
No. Provinsi /
Province
Luas/ Produksi Luas/ Produksi Luas/ Produksi Luas/ ProduksiArea Production Area Production Area Production Area Production
(Ha) (Ton) (Ha) (Ton) (Ha) (Ton) (Ha) (Ton)
1. A C E H - - - - - - - -2. SUMATERA UTARA - - - - - - - -3. SUMATERA BARAT - - - - - - - -4. R I A U - - - - - - - -5. KEPULAUAN RIAU - - - - - - - -6. J A M B I - - - - - - - -7. SUMATERA SELATAN - - - - - - -
-8. KEP. BANGKA BELITUNG - - - - - - -
-9. BENGKULU - - - - - - - -10 LAMPUNG - - - - - - - -- - - - - - - -11. DKI. JAKARTA - - - - - - - -12. JAWA BARAT - - - - - - - -13. BANTEN - - - - - - - -14. JAWA TENGAH 105 47 - - - - 105 47 15. D.I. YOGYAKARTA - - - - - - - -16. JAWA TIMUR 858 1.030 - - - - 858 1.030 963 1.077 - - - - 963 1.077 17. B A L I - - - - - - -
-18. NUSA TENGGARA BARAT 2.982 2.124 - - - - 2.982 2.124 19. NUSA TENGGARA TIMUR - - - - - - -
-2.982 2.124 - - - - 2.982 2.124 20. KALIMANTAN BARAT - - - - - - - -21. KALIMANTAN TENGAH - - - - - - - -22. KALIMANTAN SELATAN - - - - - - - -23. KALIMANTAN TIMUR - - - - - - - -- - - - - - - -24. SULAWESI UTARA - - - - - - - -25. GORONTALO - - - - - - - -26. SULAWESI TENGAH - - - - - - - -27. SULAWESI SELATAN 58 57 - - - - 58 57 28. SULAWESI BARAT - - - - - - - -29 SULAWESI TENGGARA 245 227 - - - - 245 227 303 284 - - - - 303 284 30. M A L U K U - - - - - - - -31. MALUKU UTARA - - - - - - - -32. PAPUA - - - - - - - -33. PAPUA BARAT - - - - - - - -- - - - - - - -4.249 3.485 - - - - 4.249 3.485
Keterangan / Note : DIREKTORAT JENDERAL PERKEBUNAN
1. **) Angka Estimasi / Estimation Directorate General of Estate Crops
2. Wujud Produksi / Production : Asam Jawa / Tamarind
Perkebunan Rakyat Perkebunan Negara Perkebunan Swasta
Smallhoders Government Private Total
I N D O N E S I A WILAYAH SULAWESI
WILAYAH MALUKU + PAPUA WILAYAH SUMATERA
WILAYAH JAWA
WIL. NUSA TENGGARA + BALI
WILAYAH KALIMANTAN Tabel 1.5
Table
10
Statistik Perkebunan Indonesia / Tree Crop Estate Statistics of Indonesia 2012-2014
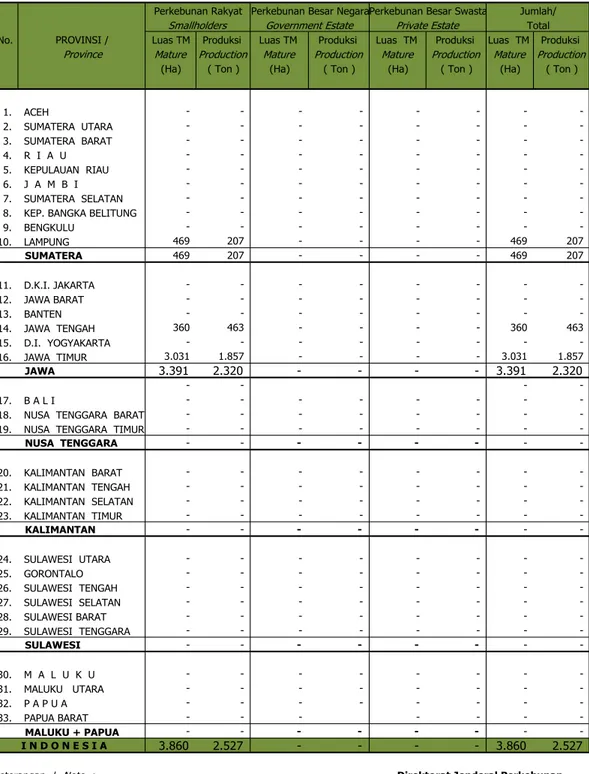
Luas Tanaman Menghasilkan (TM) dan Produksi Asam Jawa Menurut Provinsi dan Status Pengusahaan Tahun 2012
Mature Area and Tamarind Production by Province and Farming Category, 2012
No. Provinsi / Province TM / Produksi TM / Produksi TM / Produksi TM / Produksi
Mature Production Mature Production Mature Production Mature Production
(Ha) (Ton) (Ha) (Ton) (Ha) (Ton) (Ha) (Ton)
1. A C E H - - - - - - - -2. SUMATERA UTARA - - - - - - - -3. SUMATERA BARAT - - - - - - - -4. R I A U - - - - - - - -5. KEPULAUAN RIAU - - - - - - - -6. J A M B I - - - - - - - -7. SUMATERA SELATAN - - - - - - -
-8. KEP. BANGKA BELITUNG - - - - - - -
-9. BENGKULU - - - - - - - -10 LAMPUNG - - - - - - - - - - - - - -11. DKI. JAKARTA - - - - - - - -12. JAWA BARAT - - - - - - - -13. BANTEN - - - - - - - -14. JAWA TENGAH 83 47 - - - - 83 47 15. D.I. YOGYAKARTA - - - - - - - -16. JAWA TIMUR 667 1.003 - - - - 667 1.003 750 1.050 - - - - 750 1.050 - - -17. B A L I - - - - - - -
-18. NUSA TENGGARA BARAT 2.171 2.121 - - - - 2.171 2.121
19. NUSA TENGGARA TIMUR - - - - - - -
-2.171 2.121 - - - - 2.171 2.121 - - -20. KALIMANTAN BARAT - - - - - - - -21. KALIMANTAN TENGAH - - - - - - - -22. KALIMANTAN SELATAN - - - - - - - -23. KALIMANTAN TIMUR - - - - - - - -- - - - - - - - - -24. SULAWESI UTARA - - - - - - - -25. GORONTALO - - - - - - - -26. SULAWESI TENGAH - - - - - - - -27. SULAWESI SELATAN 53 56 - - - - 53 56 28. SULAWESI BARAT - - - - - - - -29 SULAWESI TENGGARA 131 227 - - - - 131 227 184 283 - - - - 184 283 -30. M A L U K U - - - - - - - -31. MALUKU UTARA - - - - - - - -32. PAPUA - - - - - - - -33. PAPUA BARAT - - - - - - - - - - - - - -3.105 3.453 - - - - 3.105 3.453
Keterangan / Note : DIREKTORAT JENDERAL PERKEBUNAN
1. Angka Tetap / Fixed Directorate General of Estate Crops
2. Wujud Produksi / Production : Asam Jawa / Tamarind
Statistik Perkebunan Indonesia/Tree Crop Estate Statistics of Indonesia 2012-2014
10
Tabel 1.6.
Table
Perkebunan Rakyat Perkebunan Negara Perkebunan Swasta Jumlah /
Smallhoders Government Private Total
I N D O N E S I A WILAYAH SUMATERA
WILAYAH JAWA
WIL. NUSA TENGGARA + BALI
WILAYAH KALIMANTAN
WILAYAH SULAWESI
Luas Tanaman Menghasilkan (TM) dan Produksi Asam Jawa Menurut Provinsi dan Status Pengusahaan Tahun 2013 *)
Mature Area and Tamarind Production by Province and Farming Category, 2013*)
No. Provinsi / Province TM / Produksi TM / Produksi TM / Produksi TM / Produksi
Mature Production Mature Production Mature Production Mature Production
(Ha) (Ton) (Ha) (Ton) (Ha) (Ton) (Ha) (Ton)
1. A C E H - - - - - - - -2. SUMATERA UTARA - - - - - - - -3. SUMATERA BARAT - - - - - - - -4. R I A U - - - - - - - -5. KEPULAUAN RIAU - - - - - - - -6. J A M B I - - - - - - - -7. SUMATERA SELATAN - - - - - - -
-8. KEP. BANGKA BELITUNG - - - - - - -
-9. BENGKULU - - - - - - - -10 LAMPUNG - - - - - - - -- - - - - - - -11. DKI. JAKARTA - - - - - - - -12. JAWA BARAT - - - - - - - -13. BANTEN - - - - - - - -14. JAWA TENGAH 83 47 - - - - 83 47 15. D.I. YOGYAKARTA - - - - - - - -16. JAWA TIMUR 667 1.012 - - - - 667 1.012 750 1.060 - - - - 750 1.060 17. B A L I - - - - - - -
-18. NUSA TENGGARA BARAT 2.170 2.122 - - - - 2.170 2.122
19. NUSA TENGGARA TIMUR - - - - - - -
-2.170 2.122 - - - - 2.170 2.122 20. KALIMANTAN BARAT - - - - - - - -21. KALIMANTAN TENGAH - - - - - - - -22. KALIMANTAN SELATAN - - - - - - - -23. KALIMANTAN TIMUR - - - - - - - -- - - - - - - -24. SULAWESI UTARA - - - - - - - -25. GORONTALO - - - - - - - -26. SULAWESI TENGAH - - - - - - - -27. SULAWESI SELATAN 53 56 - - - - 53 56 28. SULAWESI BARAT - - - - - - - -29 SULAWESI TENGGARA 131 227 - - - - 131 227 184 283 - - - - 184 283 30. M A L U K U - - - - - - - -31. MALUKU UTARA - - - - - - - -32. PAPUA - - - - - - - -33. PAPUA BARAT - - - - - - - -- - - - - - - -3.104 3.465 - - - - 3.104 3.465
Keterangan / Note : DIREKTORAT JENDERAL PERKEBUNAN
1. *) Angka Sementara / Preliminary Directorate General of Estate Crops
2. Wujud Produksi / Production : Asam Jawa / Tamarind
Tabel 1.7.
Table
Perkebunan Rakyat Perkebunan Negara Perkebunan Swasta Jumlah /
Smallhoders Government Private Total
WILAYAH SUMATERA
WILAYAH JAWA
WIL. NUSA TENGGARA + BALI
WILAYAH KALIMANTAN
WILAYAH SULAWESI
WILAYAH MALUKU + PAPUA
12
Statistik Perkebunan Indonesia / Tree Crop Estate Statistics of Indonesia 2012-2014
Luas Tanaman Menghasilkan (TM) dan Produksi Asam Jawa Menurut Provinsi dan Status Pengusahaan Tahun 2014 **)
Mature Area and Tamarind Production by Province and Farming Category, 2014 **)
No. Provinsi / Province TM / Produksi TM / Produksi TM / Produksi TM / Produksi
Mature Production Mature Production Mature Production Mature Production
(Ha) (Ton) (Ha) (Ton) (Ha) (Ton) (Ha) (Ton) 1. A C E H - - - - - - - -2. SUMATERA UTARA - - - - - - - -3. SUMATERA BARAT - - - - - - - -4. R I A U - - - - - - - -5. KEPULAUAN RIAU - - - - - - - -6. J A M B I - - - - - - - -7. SUMATERA SELATAN - - - - - - - -8. KEP. BANGKA BELITUNG - - - - - - - -9. BENGKULU - - - - - - - -10 LAMPUNG - - - - - - - -- - - - - - - -11. DKI. JAKARTA - - - - - - - -12. JAWA BARAT - - - - - - - -13. BANTEN - - - - - - - -14. JAWA TENGAH 83 47 - - - - 83 47 15. D.I. YOGYAKARTA - - - - - - - -16. JAWA TIMUR 665 1.030 - - - - 684 1.030 748 1.077 - - - - 766 1.077 17. B A L I - - - - - - - -18. NUSA TENGGARA BARAT 2.170 2.124 - - - - 2.572 2.124 19. NUSA TENGGARA TIMUR - - - - - - -
-2.170 2.124 - - - - 2.572 2.124 -20. KALIMANTAN BARAT - - - - - - - -21. KALIMANTAN TENGAH - - - - - - - -22. KALIMANTAN SELATAN - - - - - - - -23. KALIMANTAN TIMUR - - - - - - - -- - - - - - - -24. SULAWESI UTARA - - - - - - - -25. GORONTALO - - - - - - - -26. SULAWESI TENGAH - - - - - - - -27. SULAWESI SELATAN 53 57 - - - - 55 57 28. SULAWESI BARAT - - - - - - - -29 SULAWESI TENGGARA 130 227 - - - - 157 227 183 284 - - - - 212 284 30. M A L U K U - - - - - - - -31. MALUKU UTARA - - - - - - - -32. PAPUA - - - - - - - -33. PAPUA BARAT - - - - - - - -- - - - - - - -3.101 3.485 - - - - 3.550 3.485 Keterangan / Note :
1. **) Angka Estimasi / Estimation
2. Wujud Produksi / Production : Asam Jawa / Tamarind
Statistik Perkebunan Indonesia/Tree Crop Estate Statistics of Indonesia 2012-2014
12
Perkebunan Swasta Jumlah /
Smallhoders Government Private Total
I N D O N E S I A WILAYAH SULAWESI
WILAYAH MALUKU + PAPUA
Perkebunan Rakyat Perkebunan Negara
Tabel 1.8.
Table
DIREKTORAT JENDERAL PERKEBUNAN
Directorate General of Estate Crops
WILAYAH SUMATERA
WILAYAH JAWA
WIL. NUSA TENGGARA + BALI
Luas Areal dan Produksi Asam Jawa Perkebunan Rakyat Menurut Kabupaten dan Keadaan Tanaman Tahun 2012
Areal and Tamarind Production of Smallholder by District and Tree Crop Classification, 2012
/Area (Ha) Jumlah
No. T B M TM TTM/TR Jumlah Produksi Produktivitas Petani
Immature Mature Damaged Total Production Produktivity Farmers
( Ton ) (Kg/Ha) ( KK ) 1. JAWA TENGAH Kota Semarang 7 72 10 89 40 551 415 Kab. Kudus 3 11 - 14 7 639 230 Kab. Boyolali - - - -PROVINSI / Province 10 83 10 103 47 562 645 2. JAWA TIMUR Kab. Tuban 2 9 - 11 10 1.111 33 Kab. Magetan 7 64 3 74 113 1.766 222 Kab. Ngawi 8 57 6 71 101 1.772 216 Kab. Nganjuk 4 4 9 17 6 1.500 51 Kab. Trenggalek 13 56 3 72 83 1.482 216 Kab. Tulungagung 4 9 - 13 13 1.444 39 Kab. Probolinggo 15 136 11 162 163 1.199 486 Kab. Situbondo 13 129 10 152 196 1.519 459 Kab. Bondowoso 15 18 4 37 28 1.556 111 Kab. Banyuwangi 7 19 2 28 31 1.632 84 Kab. Pemekasan 6 50 2 58 63 1.260 174 Kab. Bangkalan 13 8 1 22 11 1.375 66 Kab. Sampang 18 28 1 47 50 1.786 141 Kab. Sumenep 16 80 1 97 135 1.688 291 PROVINSI / Province 141 667 53 861 1.003 1.504 2.589
3. NUSA TENGGARA BARAT
Kota Mataram 1 1 0 2 3 2.271 6
Kab. Lombok Utara 2 15 1 17 11 754 173
Kab. Lombok Barat - 11 19 29 32 2.971 317
Kab. Lombok Tengah 7 61 190 259 44 721 568
Kab. Lombok Timur 73 140 62 274 33 240 1.179
Kab. Sumbawa Barat 14 127 5 146 112 878 573
Kab. Sumbawa 149 565 1 715 514 910 1.831 Kab. Dompu 11 384 114 508 125 325 825 Kab. Bima 80 811 24 915 1.067 1.316 1.848 Kota Bima 13 57 55 125 180 3.153 391 PROVINSI / Province 349 2.171 469 2.989 2.121 977 7.711 5. SULAWESI SELATAN Kab. Bone - 31 - 31 49 1.581 199 Kab. Selayar 3 22 1 26 7 318 400 PROVINSI / Province 3 53 1 57 56 1.057 599 6. SULAWESI TENGGARA Kab. Konawe 5 7 - 12 3 387 76 Kab. Kolaka - 1 - 1 2 1.179 137 Kab. Muna - 6 1 7 1 104 54 Kab. Buton 43 65 4 111 196 3.015 1.036 Kota Kendari 9 15 2 26 1 95 108 Kota Bau-bau 0 5 5 10 11 2.316 97
Kab. Konawe Selatan 2 1 - 3 1 - 12
Kab. Bombana 2 8 2 12 2 250 149
Kab. Wakatobi 23 23 15 61 11 487 573
Kab. Kolaka Utara - 1 - 1 - - 32
PROVINSI / Province 84 131 28 244 227 1.726 2.274 587 3.105 562 4.254 3.453 1.112 13.818
Keterangan / Note : DIREKTORAT JENDERAL PERKEBUNAN 1. Angka Tetap / Fixed Directorate General of Estate Crops
2. Wujud Produksi / Production : Asam Jawa / Tamarind
Provinsi - Kabupaten Province - District Tabel 1.9 Table I N D O N E S I A Luas Areal