For further information. please contact:
Economic Outlook & Policy Dissemination
Bureau of Monetary Policy
Directorate of Economic Research and Monetary Policy
Telephone : +62 61 3818163
+62 21 3818206
Fax.
: +62 21 3452489
: [email protected]
MONETARY POLICY REPORT
BANK INDONESIAThe Monetary Policy Report is published quarterly by Bank Indonesia after the Board
of Governors’ Meetings in January. April. July. and October. In addition to fulfilling the
mandate of article 58 of Act Number 23 of 1999 concerning Bank Indonesia. amended
by Act No. 3 of 2004. the report has two main purposes: (i) to function as a tangible
product of a forward-looking working framework in which formulation of monetary
policy is based on economic and inflation forecasts; and (ii) as a medium for the Board
of Governors of Bank Indonesia to present to the public the various policy considerations
underlying its monetary policy decisions.
The Board of Governors
Darmin Nasution
Senior Deputy Governor
Hartadi A. Sarwono
Deputy Governor
Siti Ch. Fadjrijah
Deputy Governor
S. Budi Rochadi
Deputy Governor
Muliaman D. Hadad
Deputy Governor
Ardhayadi Mitroatmodjo
Deputy Governor
Budi Mulya
Deputy Governor
MONETARY POLICY REPORT
BANK INDONESIAMonetary Policy Strategy Underlying Principles
Under the ITF. the inflation target is established as the overriding objective and nominal anchor for monetary policy. In this regard. Bank Indonesia has adopted a forward looking strategy by guiding the present monetary policy response for achievement of a medium-term inflation target.
The application of the ITF does not mean that monetary policy disregards economic growth. The basic monetary policy paradigm of striking the optimum balance between inflation and economic growth is retained in both setting the inflation target and in the monetary policy response by focusing on achievement of low. stable inflation in the medium to long-term.
The Inflation Target
Government upon coordination with Bank Indonesia has set and announce an inflation target of CPI every year. Based on KMK No.1/KMK.011/2008, the inflation targets established by the Government for 2008-2010 are 5.0%, 4.5% and 4.0% with ±1% deviation. However, based on the latest developments, Bank Indonesia has proposed new inflation target to the government. The proposed inflation target for 2010-2012 are 5% ± 1%, 5% ± 1%, and 4.5% ± 1% respectively.
Monetary Instruments and Operations
The BI Rate is the published policy rate reflecting the monetary policy stance adopted by Bank Indonesia. The BI Rate is a signal for achieving the medium to long-term inflation target and is announced periodically by Bank Indonesia for a specific period. To strengthen the operational framework for monetary policy. Bank Indonesia changed from use of the 1-month SBI rate as the operational target to the overnight interbank rate with effect from 9 June 2008. In monetary operations. the BI Rate is implemented through liquidity management on the money market to achieve the monetary policy operational target. reflected in movement in the overnight interbank money market rate. To enhance the effectiveness of liquidity management on the market. a set of standing facilities in combination with an interest rate corridor is employed in day-to-day monetary operations.
Policymaking Process
The BI Rate is determined by the Board of Governors in the Monthly Board of Governors’ Meeting. In unforeseen circumstances. the monetary policy stance may be adjusted in advance of the Monthly Board of Governors’ Meeting in a weekly Board of Governors’ Meeting. Changes in the BI Rate essentially depict the Bank Indonesia monetary policy response for guiding the forecasted level of inflation within the limits of the established inflation target.
Transparency
Monetary policy is regularly communicated to the public through customary media for communication. such as statements to the press and market actors. website postings and publication of the Monetary Policy Report (MPR). This transparency is aimed at building improved understanding and shaping public expectations of the economic and inflation outlook and the monetary response taken by Bank Indonesia.
Coordination with the Government
For the purpose of coordination in inflation targeting. monitoring and control. the Government and Bank Indonesia have established a team of officials representing the various relevant agencies. The task of the Team is to deliberate and recommend the necessary policy actions for the Government and Bank Indonesia in managing inflationary pressures for achievement of the established inflation target.
Steps for Reinforcing Monetary Policy with the Overriding Objective of Price Stability (Inflation Targeting Framework)
In July 2005. Bank Indonesia launched a reinforced monetary policy framework consistent with the Inflation Targeting Framework (ITF). encompassing four key elements: (1) use of the BI Rate as the policy reference rate. (2) anticipatory monetary policymaking process. (3) more transparent communications strategy and (4) closer policy coordination with the Government. These measures are intended to strengthen monetary policy effectiveness and governance in order to achieve the overriding objective of price stability in support of sustainable economic growth and greater public prosperity.
Enhanced Monetary Policy Measures
Under Inflation Targeting Framework
Monetary Policy Report - Quarter III-2009
Contents
MONETARY POLICY REPORT
BANK INDONESIAContents
1. General Review ... 1
2. Latest Macroeconomic Indicators... 5
Deveopments In The World Economy ... 5
Economic Growth ... 7
Balance of Payments ... 14
3. Monetary Indicators and Policy, Quarter I-2010 ... 16
Rupiah Exchange Rate ... 16
Inlation ... 17
Monetary Policy ... 19
4. Outlook for the Indonesian Economy ... 27
Assumptions and Scenarios ... 27
Economic Growth Outlook ... 28
Inflation Forecast ... 35
Risk ... 36
5. Monetary Policy Response, QI-2010 ... 37
1. General Review
The domestic economy is forging ahead with support from the buoyant performance of the global economy. Economic activity in Indonesia showed significant improvement during Q4/2009. Quarterly growth in the economy reached an estimated 5.4% (yoy), bringing growth for 2009 overall to 4.5% (yoy). Conditions in the economy, marked by growing optimism, support a more upbeat outlook compared to earlier forecasts. In 2010, the Indonesian economy is predicted to grow in the range of 5.5%-6.0% and in 2011 at 6.0%-6.5%. Price stability remains in safe territory, as reflected in the subdued movement in the CPI during Q1/2010. This is consistent with the prediction of no significant inflationary pressure arising at least during the first half of 2010. For the year as a whole, CPI inflation will come within the 5%±1% targeted range.
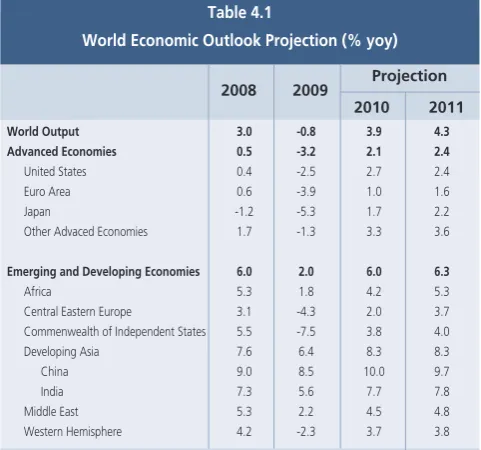
In the view of Bank Indonesia, the global economy is in recovery and gathering momentum. Advanced economies, led by the US and Japan, are showing steady improvement. Similarly, economic recovery in non-Japan Asia, most importantly China and India, is forging ahead. In other developments, signs are emerging of improvement in European economies, albeit on a limited scale. The resolution of the Greece crisis has so far met with positive response among economic actors, with impact limited to financial markets.
The recovery in the global economy coupled with improved perceptions of risk has fuelled optimism on financial and commodity markets. Reflecting this are gains in global stock indices and an upward trend in international market commodity prices. Foreign capital flows continued to pour into emerging markets in keeping with improving risk perceptions, a condition that has bolstered currency appreciation in the region. Rising optimism over the global economic recovery and strengthening of global demand spurred price increases across a range of commodities. The price increases alongside appreciation in the currency have not so far triggered any significant rise in global inflation, particularly in advanced nations. With the world economy not yet fully recovered to normal, monetary authorities in developed nations in particular have leaned towards an accommodative monetary policy stance. Signals of monetary tightening are more evident on emerging markets due to rising inflationary pressures fuelled by high rates of economic expansion.
robust external side performance, more vigorous growth is forecasted for some sectors, most importantly manufacturing and trade. Manufacturing growth has picked up in response to stronger performance in export-oriented manufacturing and the automotive industry. At the same time, more vigorous trade sector growth is consistent with mounting activity in exports and imports and stronger manufacturing performance. Nevertheless, various issues remain that pose challenges to higher growth, particularly in regard to measures to accelerate infrastructure programmes and make optimum use of opportunities from the launching of the ASEAN-China Free Trade Agreement (AC-FTA).
The strengthening of the economy is also visible in the steady improvement in economic performance at the regional level. Economic performance in the regions was led by Sumatra, Kalimantan, Sulawesi, Maluku and Papua (Kali-Sulampua) and Jakarta. Other regions (Java, Bali and Nusa Tenggara or Jabalnustra), however, reported slowing economic activity. Buoyant economic performance in the regions is driven by higher exports, investments and consumption. Export performance in individual regions has risen on higher exports of mainstay commodities, such as mining products and CPI in Sumatra and Kali-Sulampua and chemicals in the Jabalnustra region. In analysis by major export destinations, exports from individual regions have shifted from Japan, America and Europe as in the past to ASEAN and China, due to the more advanced recovery in these economies. Sumatra and Kali-Sulampua have even increased their share of exports to India, particularly for CPO and coal. Indications point to strengthening investment in line with the mounting pace of economic activity. Reflecting this is the positive growth in the indicators for cement consumption growth and capital goods imports. In the area of Regional Government investment, increases have been made in capital expenditures. The higher investment has been channelled mainly into infrastructure projects, such as construction of roads, dams, bridges and airports. In analysis by business category, the industry sector has picked up in response to improving domestic and external demand. More robust industry performance is reflected in production capacity expansion and higher raw materials imports in all regions. In the mining sector, performance has climbed largely from increased production of non-oil and gas mining products led by coal and copper. In contrast, oil and natural gas production continues on a slowing trend.
Concerning prices, inflation remained at modest levels in Q1/2010. Low inflationary pressure in Q1/2010 was indicated by March 2010 deflation at 0.14% (mtm), bringing annual CPI inflation to 3.43% (yoy). The success in curbing inflation at this low level is partly attributable to the appreciation in the rupiah and adequate levels of supply in responding to increased demand. Besides this, the low inflation in March 2010 also resulted from a moderation of inflationary pressures from volatile foods (mainly rice), due to the onset of the harvest season in some regions, and minimum inflationary pressure from administered prices.
an estimated Q1/2010 surplus on the strength of capital inflows and issuance of government foreign currency bonds. Risk indicators for Indonesia have improved, as reflected in the all-time low in the credit default swap (CDS) indicator for Indonesia, narrowing yield spread for Indonesia Government Bonds over US Treasury Notes and the upgrading of Indonesia’s rating. Taken together, international reserves at end-March 2010 stood at 71.8 billion US dollars, equivalent to 5.8 months of imports and servicing of official external debt.
The solid performance in the balance of payments underpinned an appreciating trend in the rupiah. Measured as an average for Q1/2010, the rupiah appreciated by an overall 2.2% to Rp 9,254/USD. At end Q1/2010, the rupiah stood at Rp 9,090/USD, having gained 3.7% (point to point). The strengthening of the rupiah was supported by conducive conditions in macroeconomic fundamentals, reflected in healthy performance in the balance of payments and improving risk perceptions. Other support for rupiah appreciation came from the continued attractiveness of returns on rupiah placements, reflected in uncovered parity (UIP), covered interest parity (CIP) and the relatively high yield spread on Indonesia Government Bonds surpassing yields in other countries in the region. The appreciation in the rupiah was also accompanied by stable level of exchange rate volatility at 0.57% compared to the Q4/2009 level of 0.56%.
Financial sector performance has picked up in line with the recovery in the global and domestic economy. The JSX Composite Index mounted significantly in Q1/2010 with gains at 10.2%. This index performance was the highest for any country in the region. Factors driving the JSX Composite gains include the brightening outlook for the Indonesian economy, and with it, reduced perceptions of risk, improvement in the credit rating and high returns on rupiah placements. Also reflecting this was movement in other financial indicators, such as declining yield on government securities. Considerable excess liquidity remains on the interbank money market, which has pushed the overnight interbank rate closer to the lower BI Rate corridor. The Bank Indonesia decision to lengthen the maturities of SBIs for reasons including financial deepening proved successful, as indicated by the narrowing of the high-low interest rate spread on the overnight interbank market. Added to this, the proportion of SBIs in the 3-month tenor soared to 67.0$ from 24.64% at the end of the preceding quarter. Consistent with the diminishing perceptions of bank risks, deposit and lending rates saw further decline although less than expected. Looking forward, monetary policy transmission is predicted to improve in line with strengthening optimism of the banking system in the condition of the economy.
At the micro level, conditions in the national banking system remain stable. Reflecting this is the still comfortable level of the capital adequacy ratio (CAR) at 19.3% in February. Similarly, the gross non-performing loans (NPLs) ratio remains below 4% with the net ratio at 1%. Besides this, banking liquidity improved further, including liquidity on the interbank money market. Bank depositor funds similarly recorded growth.
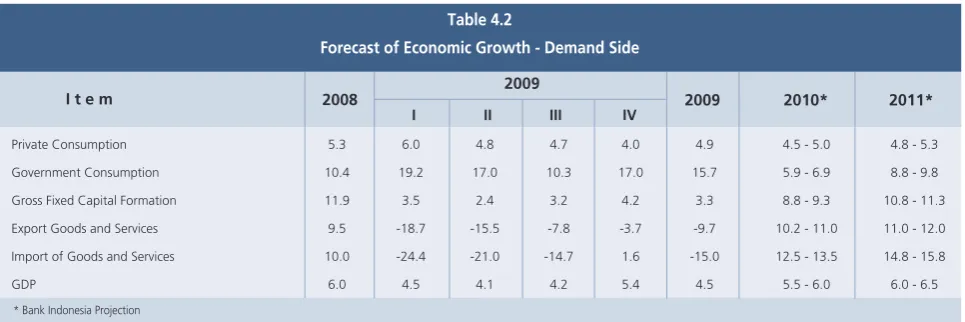
forecasts. Economic growth in 2010 is predicted in the 5.0%-6.0% range, up from the originally projected 5.0%-5.5%. The economy improved not only from the continued strength of consumption, but also higher exports in line with the global economic recovery. Rising demand accompanied by improvement in the investment climate is expected to drive significant growth in investment. The improvement in the economy is forecasted to carry forward into 2011 with growth possibly reaching 6.0%-6.5%. Rising demand matched by capacity for supply-side response is expected to keep future inflationary pressures at a modest level. A complete elaboration of the medium-term outlook for the economy is presented the Indonesian Economic Review 2009, accessible on the Bank Indonesia website.
2. Latest Macroeconomic Indicators
The continuing process of global economic recovery has also provided a boost to domestic economic performance. During Q1/2010, the increasingly broad-based global economic recovery was supported by solid economic performance in Asia with positive impact on the domestic economy. The better than forecasted growth in Q1/2010 came in response to strengthening of exports and also received support from indications of rising investment. More robust demand in trading partner nations coupled with high commodity prices boosted export performance. In a similar vein, business optimism for improvement economic conditions, improvements in the domestic investment climate and plans for government-sponsored infrastructure projects strengthened investment performance. Household consumption maintained an upward trend, bolstered by strong public purchasing power and buoyant consumer optimism. On the supply side, rising exports and imports are expected to strengthen performance in the manufacturing and trade, hotels and restaurants sectors. Growing export demand will generate a positive contribution for manufacturing, while higher exports will bring greater activity to the trade, hotels and restaurants sector. On the other hand, agriculture is expected to show reduced growth in Q1/2010, mainly due to the shift in the harvest season to early Q2/2010. Other sectors expected to see brisk growth are the electricity, gas and water utilities sector, primarily from the continuation of the kerosene conversion programme in some regions and commissioning of several powerplants in the Phase I 10,000MW project, and the transport and communications sector due to market penetration of the telecommunications business.
DEVELOPMENTS IN THE WORLD ECONOMY
Estimates point to added momentum in global economic recovery in Q1/2010. Emerging markets, led by Asia, again provided the driving force accelerating the improvement in the world economy. Developed economies are also predicted to chart positive growth despite the twin challenges of high unemployment levels and tight lending. However, recovery in the European Union lags somewhat due to the fiscal crisis in countries such as Greece and weakness of consumption indicators. Production in advanced economies is on a solid growth track due to the success of the fiscal stimulus in boosting industry activity, a development supported by low inventory levels. In developing nations, solid domestic demand in China is driving the strong demand for imports from Asia with a spillover effect on growth in other economies in the Asian region.
for 4 months in a row. An added factor in the rising consumption is the slowing rate of worker lay-offs and a levelling off in the unemployment rate, now at 9.7%. The conducive condition of the labour market is reflected in the decline in average initial jobless claims in Q1/2010 to 467 thousand from 500 thousand one quarter earlier. In further developments, negative growth in payroll figures is progressively easing. The production side in the US is gathering force with indications of entering an expansionary phase. The US government fiscal stimulus through infrastructure projects has given added impetus to US production. On the other hand, mounting retail sales have resulted in drawing down of inventories, with business responding by increasing production as reflected in the rising purchasing manager index (PMI) and industrial production index.
Global financial market performance resumed an upward trend after a downturn halfway through the quarter, triggered by uncertainties over resolution of the fiscal crisis in Europe. Reflecting the growing investor optimism in the global financial market were the gains on stock markets in advanced economies during Q1/2010. Despite this, stock markets tumbled briefly on reports of burgeoning fiscal deficits in the GIPSY nations (Greece, Ireland, Portugal, Spain and Italy) and lack of clear resolution to this problem. Near the end of Q1/2010, investor risk appetite rebounded after announcement of a solution to fund the Greek fiscal deficit involving the European Union and IMF. Global markets also picked up after the release of data pointing to steady improvement in global economic fundamental and corporate financial statements consistent with forecasts.
In Asia, economic recovery progressed rapidly during Q4/2009, with growth back in positive territory. In most Asian economies, growth has rebounded following the steep decline in the first half of 2009. Externally oriented countries in Asia saw significant improvement in line with robust demand for exports to China and India. Added to this was the escalating trend in domestic demand buoyed by positive wealth assets in line with rising housing and stock market prices in Asia and prolonged low interest rates. At the same time, other Asian economies more reliant on domestic demand have maintained positive trends. Looking forward, the economies of China and India remain in the forefront as the economic powerhouses of Asia. Estimated growth in China and India during Q1/2010 is 11.1% (yoy) and 7.9% (yoy).
World inflationary pressures during Q1/2010 were comparatively mild. According to composite data on inflation outcomes, world inflationary pressure held at a relatively stable level compared to the preceding quarter. World inflation in March 2010 was recorded at 3.1% (yoy), unchanged from one quarter earlier. Indications suggest that the mounting level of international commodity prices has not escalated inflationary pressure, given the lack of full recovery in world economic activity.
of the Greek fiscal deficit crisis. In other actions, the BoJ expanded its 3-month loan facility to 20 trillion yen (222 billion US dollars), double the previous level, to stimulate inflation in the medium term, even though interest rates have been held at a very low 0.1%. Some central banks in Asia’s emerging markets and central banks in advanced nations have embarked on monetary tightening. Signs of monetary tightening were clearly evident in China and India, which raised their minimum statutory reserve requirements by 100 bps and 75 bps during Q1/2010. Some of Asia’s central banks, including Malaysia and India, have already raised their policy rates. Central banks in developed nations such as Australia and Israel have also raised their reference rates in response to growing inflationary pressure while their economies have already charted expansion.
ECONOMIC GROWTH Aggregate Demand
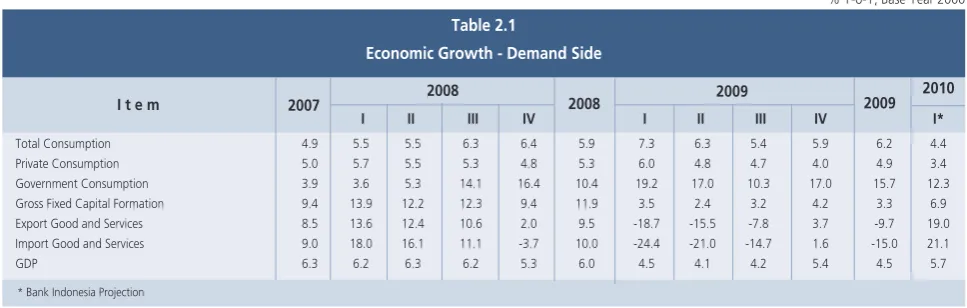
Economic growth mounted higher in the estimates for Q1/2010. The sharp rise in exports and persistently strong levels of household consumption have brought continued improvement in economic growth. GDP growth in Q1/2010 is estimated ahead of the previous quarter at 5.7% (yoy). Key to this are the gains evident in leading indicators for the GDP (Graph 2.1).
GDP growth is estimated higher on the back of strengthening exports and household consumption (Table 2.1). Exports showed improved growth in line with renewed activity in the global economy and high international commodity prices. Imports are also estimated higher in response to mounting external demand for manufactured goods. With export showing stronger performance, both government and private sector investment are expected to climb. At the same time, consumption maintained an upward track, despite slower growth in preliminary figures for Q1/2010. This is explained more by the base effect factor from the preceding year, when consumption soared around the time of the parliamentary elections.
Table 2.1
Economic Growth – Demand Side
Household consumption in Q1/2010 is estimated to have maintained positive expansion. Confirmation of this is visible in the steady improvement in leading indicators for household
I II III IV I II III IV I*
I t e m
Table 2.1
Economic Growth - Demand Side
* Bank Indonesia Projection
2007 2008 2008 2009 2009 2010
% Y-o-Y, Base Year 2000
consumption (Graph 2.2). Growth in household consumption was supported by adequately robust levels of public purchasing power. The average 8.8% (yoy) increase in Provincial Minimum Wage levels in early 2010, followed by the 5% raise for civil servants, military and police, was one factor bolstering public purchasing power. The generally stable level of farmer terms of trade and labour wages in February 2010 is one indicator of the buoyant private incomes. Alongside this, public optimism for their incomes has potential to boost household consumptions to even higher levels. Indications of strengthening household consumption are also visible in higher levels of consumption credit in the banking system. However, when compared to realised household consumption for Q1/2010, household consumption growth during the period under review is estimated lower than during Q1/2009 due to heavy spending by non-government organisations in advance of the parliamentary elections (base effect factor). In the overall analysis, household consumption maintained positive expansion in Q1/2010 at an estimated 3.4% (y-o-y).
Developments in leading indicators also support higher levels of household consumption in Q1/2010. Consumption of durables, such as sales of cars, motorcycles and electronic goods, maintained high growth (Graph 2.3). The retail sales index (IPE) for February 2010 reached 209.2 with growth at 41.3% (yoy), ahead of 40.3% (yoy) one month earlier. The rise in the IPE is attributable to steady improvement across several commodity categories, such as food and tobacco, clothing and accessories and stationery. In similar movement, the consumer confidence index is also on the rise. Stronger growth in consumption is also reflected in more vigorous growth in consumer goods imports as of February 2010. Indicators related to consumer financing, such as real M1 growth, have also maintained an upward trend.
Investment showed improvement during Q1/2010, responding to upward trends in domestic and external demand. The upswing in investment growth is consistent with leading investment indicators that point to rising investment compared to the preceding quarter (Graph 2.4). Higher investment was also reflected in more rapid growth of capital goods imports (Graph 2.5) and realised construction investment, as indicated by high levels of cement consumption. At the same time, buoyant business optimism over increased foreign orders and a conducive investment climate had a positive effect on investment growth in Q1/2010. In similar developments, investment growth in Q1/2010 reached an estimated 6.9% growth (yoy), up from the preceding quarter. In analysis by structure, investment growth in Q1/2010 was again dominated by construction.
2010. The same trend was also reflected in higher growth in cement consumption (Graph 2.6) as of February 2010 consistent with work under way in the construction sector and infrastructure projects. These developments in investment activity were also borne out in the general improvement in realised FDI and domestic investment projects at the end of 2009. Reinforcing this is information published by the Investment Coordinating Board (BKPM) projecting an increase in realised investment in the range of 9.2-11.7 billion US dollars over the same period in 2009. Besides this, higher investment benefited from greater financing support, as demonstrated by the onset of renewed growth in investment credit (Graph 2.7).
Export growth strengthened in response to the steady improvement in trading partner economies and commodity prices. Reflecting this was rising demand in developed nations, such as the United States, and emerging markets led by China (Graph 2.8). The upward trend in production indices, consumer confidence levels and business sentiment in the G3 nations and China as of February 2010 provided an added boost for accelerated export growth. In other developments, the upward trend in commodity prices on the international market has had a positive effect on global trade volume, reflected in the Baltic Dry index. Trade with other countries, such as India, is also expected to expand with the conclusion of the ASEAN-India Free Trade Agreement (AI-AFTA) and the full launching of the ACFTA scheduled for early 2010. According to the latest data from the Central Statistics Agency (BPS), February 2010 exports reached 11.20 billion US dollars, representing a dramatic fall of 57.05% (yoy) from February 2009. In response to these developments, Q1/2010 export growth is estimated ahead of the previous quarter at 19.0% (yoy). Growth in non-oil and gas exports was again driven by primary commodity exports led by mining products, notably coal, and agricultural products such as palm oil.
Signs point to a continued positive trend in import growth during Q1/2010, consistent with strong domestic demand and rising demand from the external sector. This is visible in the improvement in leading indicators for imports compared to one quarter earlier (Graph 2.9). Following the resumption of a positive trend at end of year, imports in February were up in both annual and monthly measures. According to the latest BPS data, February 2010 exports reached 9.50 billion US dollars, an increase of 63.23% (yoy) from the same period one year before. In response to these developments, Q1/2010 import growth is estimated at 21.1% (yoy). For the time being, overall import growth continues to be driven by more vigorous expansion in imports of raw materials and intermediate inputs. Analysed by 2-digit HS commodity classification,
Graph 2.4
Growth of Capital Goods Imports
import growth in February 2010 was driven by higher levels of imports related to capacity expansion, such as machines, mechanical tools, electrical motors and other electrical equipment.
Government Financial Operations
Government financial operations in January-February 2010 were marked by improved performance in budget revenues and expenditures compared to 2009. Like in previous years, the budget outcome in the first two months of 2010 resulted in a surplus, with the surplus in 2010 comparatively unchanged from 2009. Nevertheless, the budget outcome against target represented an improvement over the past year. Revenues and grants reached 11.4% of the budget target, ahead of the 2009 performance of 10.7%. This improvement was funded largely from stronger taxation revenues. A similar condition was observed in state expenditures at 9.3% of the budget target, up slightly from 9.2% of target under the 2009 budget. Key to this was a higher rate of expenditure disbursements to the regions. At the same time, realised capital expenditures at the start of the year were minimal. In regard to financing, issuance of government securities reached one third of the budget target due to conducive conditions on the government securities market, even though financial operations continued to post a surplus.
Strengthening economic activity in 2010 has boosted performance in the taxation sector. During the first two months of 2010, tax receipts reached 12.2% of the budget target, ahead of the 11.5% achieved in 2009. Higher taxation revenues were generated by VAT, export taxes and excise duties. Indications suggest that rise in VAT and export tax receipts is attributable to upbeat economic activity, including higher exports. Aside from global conditions, the increase in Export Tax revenues is also the result of a policy decision to apply a higher export surcharge on crude palm oil (CPO) in keeping with price developments on the international market.1 In contrast, income tax revenues saw relative
decline, particularly in the oil and natural gas sector. Lower oil and natural gas related revenues were also reflected in non-tax revenues. However, measured against budget targets, non-tax receipts were similar to the previous year at 8.6% of target, due to lower targets.
Improved absorption of government expenditures was supported by increased transfers to the regions. As of February 2010, realised transfers to regions came to 16.4% of the budget target. This represented an improvement over the 14.7% of the previous year in keeping with larger payments of Profit Sharing Funds and Special Allocation Funds. However, for the most part, only limited improvement took place in
Investment Credit Growth and Gross Fixed Capital Formation
Graph 2.8
Export Growth to Advance Countries
state expenditures due to the low rate of central government expenditures at only 6.2% of the budget target, down from the previous year’s level of 6.7%. This is explained by the still low rate of non-discretionary expenditures, such as Subsidies and Debt Interest. Minimum expenditures were also recorded in Capital Expenditures, which reached only 2.3% of the budget target. However, expenditure outcomes for Personnel and Social Aid were up from the same period last year.
In regard to financing, strong interest among market actors resulted in issuance of Government Securities ahead of target during Q1/2010. Total issuance of Government Securities and Sharia Government Securities in Q1/2010 reached about 66.5 trillion rupiahs, or 38% of the budget target. However, this achievement still fell short of 2009, due to the size of the global bond offering in the first quarter of that year. The high volume of government securities issues resulted not only from keen interest among market actors, but also conducive conditions on the government securities market reflected in lower yield in almost all tenors on the government securities secondary market compared to the end-of-year position in 2009. This condition also affected yield on the primary market, which also narrowed in March 2010.
Aggregate Supply
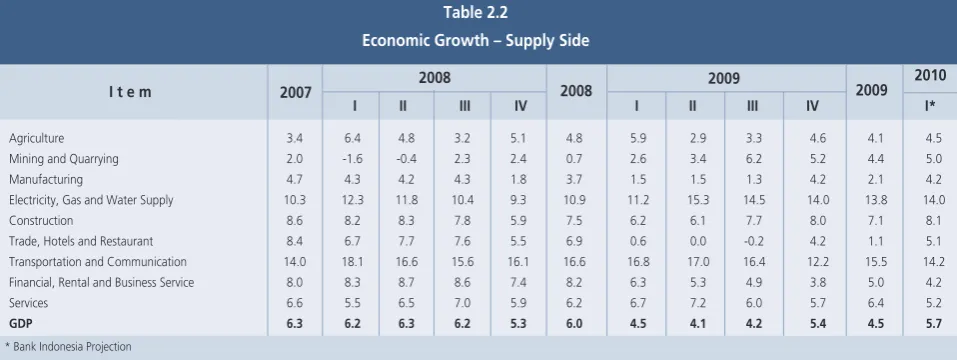
Business sector performance in Q1/2010 pointed to improving conditions in keeping with upbeat developments in sectoral indicators (Table 2.2). The trade, hotels and restaurants sector, transport and communications, construction and the financial services, leading and general services sector reported higher growth in Q1/2010 compared to one quarter earlier. Gains in the trade, hotels and restaurants sector were driven mainly by rising activity in the wholesale (imports) subsector and were also linked to the launching of the Asean China Free Trade Agreement (ACFTA). Similarly, expansion in the transport and communications sector again received impetus from performance in the telecommunications subsector. The leading contributors to GDP growth in Q1/2010 are expected to be the transport and
% Y-o-Y, Base Year 2000
I II III IV I II III IV I*
I t e m
Table 2.2
Economic Growth – Supply Side
2007 2008 2008 2009 2009 2010
Agriculture 3.4 6.4 4.8 3.2 5.1 4.8 5.9 2.9 3.3 4.6 4.1 4.5
Mining and Quarrying 2.0 -1.6 -0.4 2.3 2.4 0.7 2.6 3.4 6.2 5.2 4.4 5.0
Manufacturing 4.7 4.3 4.2 4.3 1.8 3.7 1.5 1.5 1.3 4.2 2.1 4.2
Electricity, Gas and Water Supply 10.3 12.3 11.8 10.4 9.3 10.9 11.2 15.3 14.5 14.0 13.8 14.0
Construction 8.6 8.2 8.3 7.8 5.9 7.5 6.2 6.1 7.7 8.0 7.1 8.1
Trade, Hotels and Restaurant 8.4 6.7 7.7 7.6 5.5 6.9 0.6 0.0 -0.2 4.2 1.1 5.1
Transportation and Communication 14.0 18.1 16.6 15.6 16.1 16.6 16.8 17.0 16.4 12.2 15.5 14.2
Financial, Rental and Business Service 8.0 8.3 8.7 8.6 7.4 8.2 6.3 5.3 4.9 3.8 5.0 4.2
Services 6.6 5.5 6.5 7.0 5.9 6.2 6.7 7.2 6.0 5.7 6.4 5.2
GDP 6.3 6.2 6.3 6.2 5.3 6.0 4.5 4.1 4.2 5.4 4.5 5.7
communications sector, manufacturing and the trade, hotels and restaurants sector. Similarly, the dominant sectors of the economy, like before, are manufacturing, the trade, hotels and restaurant sector and agriculture.
Manufacturing performance in Q1/2010 maintained an upward track with growth predicted to remain stable. Rising external demand was a positive factor in manufacturing output, particularly for export-oriented industries such as in the transportation equipment, machinery and tools subsector, chemicals and rubber goods, textiles, leather goods and footwear and the wood-based and forestry products subsector. Indicators of demand in the domestic industry sector, such as car and motorcycle sales, have shown an improving trend in line with adequately robust levels of public purchasing power. Confirmation of industry sector performance also comes from leading indicators for the manufacturing sector, which point to an expansion phase. Similar trends are also visible in the BI Production Survey index, capacity utilisation and imports of industrial raw materials, which have maintained an upward trend since mid-Q1/2010. Raw material imports soared by as much as 68.9% (yoy) alongside increases in the production index and capacity utilisation at 5.7% (yoy) and 7.3% (yoy) in January 2010. In regard to financing, banks reported stable growth in industry lending as of mid-Q1/2010, although below the average growth for 2009.
The trade, hotels and restaurants sector charted higher estimated growth in Q1/2010. Key factors in the performance of the trade, hotels and restaurants sector are rising imports and stronger manufacturing performance. Imports charted 63.23% growth (yoy) in February 2010, up from the same month one year before. At the same time, the upward trend in manufacturing performance augurs for an increase in the volume of goods traded within the trading sector. On the other hand, modest slowdown is forecasted for agriculture and mining, which also affect performance in the trade sector. Indications of rising trade sector performance are also reflected in the growth in the real sales index in the BI Retail Survey and hotel occupancy rates in Bali. During February 2010, growth in the real sales index mounted from 36.5% (yoy) in January 2010 to 40.0% (yoy). On the financing side, bank lending to the trade sector remained largely stable.
The mining sector again reported improved performance in Q1/2010. Improvement in this sector was reflected in various leading indicators, including exports of coal, nickel, copper, ores, matte and metal concentrates, in addition to the upward trend in oil production as of early Q1/2010. Key to this was mounting demand in trading partner nations. On the other hand, external demand for coal is also supported by the long-term export sales system. In regard to financing, credit to the mining sector reported expansion as of mid-Q1/2010.
Estimated performance in the transport and communications sector is up in Q1/2010 compared to one quarter before. This is indicated in more robust movement in several leading indicators for the transport and communications sector. The vigorous growth in the communications subsector is reflected in the incessant rise in numbers of cellular phone subscribers as of Q4/2009. Major cellular operators report increased numbers of customers. Besides the cellular market, expansion in the telecommunications sector is also driven by the soaring use of the internet. In similar developments, indications of mounting performance in the transport subsector are evident in air and rail passenger numbers as of February 2010, with growth running at 23.3% (yoy) and 1.4% (yoy). Brisk growth as of early Q1/2010 was also reported in another indicator, namely cargo traffic at Indonesia’s five major ports (Belawan, Tanjung Priok, Tanjung Perak, Balikpapan and Makassar), at 5.6% (yoy). In regard to financing, bank lending to the transport and communications sector expanded at a slightly slower rate until mid-Q1/2010.
Construction sector growth improved during Q1/2010 to an estimated 8.1% (yoy). Leading indicators point to more robust growth in the construction sector. Among these indicators are cement consumption and production, both on the rise as of mid-Q1/2010. In February 2010, cement consumption growth strengthened slightly from 13.2% (yoy) in January 2010 to 13.4% (yoy). At the same time, cement production saw growth climb from 13.3% (yoy) in January 2010 to 14.5% (yoy) in February 2010. In regard to financing, bank lending to the construction sector is estimated to have halted decline as of February 2010.
Regional Economic Performance
Estimates point to improved economic growth at the regional level, supported by the buoyant economies in Jakarta, Sumatra and the Kali-Sulampua region. During this period, the launching of the AC-FTA has opened new opportunities for regions with resource-based production. The performance of the Indonesian economy showed significant improvement in Q4/2009 with growth at 5.4%, bringing overall economic growth in 2009 to a respectable 4.5% (yoy). In general terms, the driving force for growth in 2009 came from robust consumption in Jakarta and Jabalnustra and exports from Sumatra and the Kali-Sulampua region to China and India. Strong consumption at the regional level was supported in part by high rates of realised consumption expenditures in Regional Budgets that averaged 92.6%, up from 83.1% in 2008. Expenditure growth was particularly strong in spending on goods/ services and social aid.
Graph 2.10 Export Volume Growth
��� �����
���
��
��
��
��
�
���
���
���
� � � � � � � � � �� �� �� � � � � � � � � � �� �� �� �
���� ����
The renewed vigour in regional economies is estimated to have carried forward into Q1/2010, bolstered by rising growth in the economies of Sumatra and Kali-Sulampua and buoyant economic growth in Jakarta. On the demand side, exports were up for estate crops (CPO, coffee) and mining products (coal, nickel) in Sumatra and the Kali-Sulampua region (Graph 2.10), while consumption showed a slowing trend. Investment showed renewed improvement, particularly in Jakarta alongside rising private capital expenditures. In disaggregation by sector, industry was up in Jakarta and the Jabalnustra region with support from mining in Sumatra and the Kali-Sulampua region and trade in Jakarta and Sumatra. The launching of the AC-FTA has created fresh opportunities for CPO and coffee exporting regions in Sumatra and mining exports from Kali-Sulampua. Despite this, the textiles and textile products and food processing industries in Jabalnustra face challenges, although opportunities loom for other industries (furniture, handicrafts).
While regional inflation was quite low during Q1/2010, some regions are projected to have above national inflation due to distribution problems. Most of the regions with above national inflation are found in the Kali-Sulampua region. The low inflation in the regions is explained by the onset of harvest in March in some regions, while weather-related bottlenecks hampering the distribution of goods is a factor driving up prices in regions other than Jakarta. On the demand side, the reasonably strong public purchasing power in the regions has capacity to respond to increased production. Despite this, difficulties arise in relation to tight supply (sugar, rice) and even potential for inflationary pressure from diminishing cargo traffic to Java and outside Java.
BALANCE OF PAYMENTS (BOP)
Buoyant domestic macroeconomic conditions and positive external conditions were key to Indonesia’s solid external performance during Q1/2010. Widespread positive sentiment over the recovery in the world economy was again the primary factor in Indonesia’s strong balance of payments performance, particularly in merchandise trade. Overall, the Q1/2010 balance of payments posted an estimated surplus. With this surplus, international reserves reached 71.8 billion US dollars, equivalent to 5.8 months of imports and servicing of official external debt. The improved export performance is indicated as driven by positive developments in commodity prices and strong demand for resource-based commodities in some nations, and particularly emerging markets. Nevertheless, the greater absorption capacity of the domestic economy has spurred imports, thus offsetting the rise in export turnover. Taken together, the merchandise trade balance posted an estimated surplus. At the same time, the relatively brisk recovery in Asia has given added attraction to investment in financial assets. Despite temporary shocks brought on by negative sentiment over the fiscal instability
Graph 2.11
Growth of Regional Cement Consumption
in Greece, the capital and financial account recorded a higher portfolio capital surplus on the back of strengthening investor interest. However, the increased surplus was offset by higher volume of overseas placements of domestic assets and the deficit in private external debt transactions.
The Current Account
The current account is expected to record yet another surplus, even though slightly below Q4/2009. Like before, the trade balance makes up the largest share of the current account surplus. Contributing to the estimated current account surplus was a decline in the services account (due to reduced payments for travel services) and income account (explained by lower interest payments on corporate foreign borrowings).
The sustained process of global economic recovery has brought improvement to exports, which in turn has bolstered performance in the current account. Data for the January-February 2010 period reveals that resource-based export commodities showed as somewhat better trend than manufactured products. This condition is expected to persist in March 2010 due to the shift of the world economic growth base to emerging markets, which comprise the leading markets for raw materials exported by Indonesia. Alongside this, only limited gains are expected in manufactured exports, due to the slow rate of recovery in advanced economies. Movement in commodity prices also provided an uplift for exports. At the end of the quarter, prices had risen for the majority of Indonesia’s mainstay non-oil and gas export commodities. Fundamentals, in this case strong sentiment over global economic recovery, comprised the factor driving commodity prices on the international market. However, the services account, representing another component in the current account, is projected to decline as a result of the higher outcome for foreign currency earnings from tourists, while improvement in the income account will result in part from lower interest payments on external debt.
The Capital and Financial Account
Estimates for the capital and financial account in Q1/2010 point to another surplus. This surplus is buoyed, among others, by an expected increase in foreign direct investment flows, primarily in the non-oil and gas sector. The rise in FDI inflows is explained largely by the expected improvement in the domestic economy alongside mounting commodity prices. In overall terms, improvement in the investment climate is also reflected in the upward trend in investment involving both cash calls and loans. On the portfolio side, robust domestic macroeconomic conditions and relatively high returns on rupiah placements have helped boost short-term capital inflows. Foreigners have stepped up their fund placements in SBIs and government securities.
International Reserves
3. Monetary Indicators and Policy
Q1-2010
The ongoing recovery in the global economy is showing more encouraging trends. This favourable turn in external developments combined with the solid condition of the domestic economy underpinned movement in the exchange rate and inflation during Q1/2010. The rupiah exchange rate strengthened in value during Q1/2010. The average value of the rupiah appreciated 2.2% to Rp 9,254 to the US dollar with volatility stable at 0.57% in Q1/2010 compared to 0.56% in Q4/2009. Concerning prices, inflationary pressure began mounting slightly in Q1/2010. Measured annually, CPI inflation in Q1/2010 reached 3.43% (yoy), up from the end-2009 level of 2.78% (yoy). This surge is explained primarily by rising inflationary pressure from non-fundamentals, led by volatile foods inflation, while inflationary pressure from fundamentals reflected in core inflation has in fact eased.
In other developments, improvement was observed in monetary policy transmission through various channels. In the interest rate channel, monetary policy transmitted smoothly to interbank money market and deposit rates. Added to this, lending rates recorded further decline. In the credit channel, monetary policy transmission saw improvement during Q1/2010. Credit expansion in February 2010 mounted to 9.4% (yoy), up from the 2009 level of only 8.7% (yoy). Similarly, monetary policy transmission on the capital market, government securities market and mutual funds market was also positive. On the stock market, the JSX Composite mounted significantly with gains outperforming other markets in the region. On the government securities market, yield eased in almost all tenors. In other developments, the mutual funds market also showed positive movement in line with performance of underlying assets.
RUPIAH EXCHANGE RATE
The rupiah maintained positive performance during Q1/2010. The steady improvement in the global economic recovery and growing strength of Indonesia’s domestic economic fundamentals has provided positive support for the exchange rate. In averages for the period, the rupiah gained 2.2% to Rp 9,254 to the US dollar (Graph 3.1). This appreciation was accompanied by subdued volatility (Graph 3.2). At end-Q1/2010, the rupiah closed at Rp 9,090 to the US dollar.
Rising negative sentiment on global financial markets in response to the fiscal deficit problems affecting some European nations bore down temporarily on Asia’s regional currencies, including the rupiah. The fiscal deficits sustained by the GIPSY countries (Greece, Ireland, Portugal, Spain and Italy) fuelled jitters over the sustainability of global
economic recovery. However, the steady improvement in the global economy and especially in Asia restored stability to Asia’s regional currencies and even prompted an appreciating trend in line with rising investor confidence in the economy of the Asian region.
While influenced by external conditions, the appreciation in the rupiah was also bolstered by the solid condition of the domestic economy. The Indonesian economy managed a respectable performance with 5.4% growth (yoy) in Q1/2010. At the same time, inflation in Q1/2010 remained comfortably low. These twin achievements combined with positive performance in the balance of payments paved the way for rupiah appreciation during Q1/2010. The solid performance of the domestic economy imbued foreign investors with growing confidence. Strengthening investor confidence in the Indonesian economy was signified by the upgrading of Indonesia bond ratings by two international rating agencies, Fitch and S&P. The two agencies raised Indonesia’s rating to BB+ with positive outlook, so that now, Indonesia’s position is just 1 notch below investment grade.
The solid condition of economic fundamentals was matched by improvement in perceptions of domestic risks. The Credit Default Swap (CDS) indicator for Indonesia remained low at 163 bps. This was consistent with behaviour in other risk indicators. Yield spread for Indonesia government bonds over US T-Notes registered decline. Movement in the EMBIG index, which measures risks in emerging markets, remained stable and even narrowed from 294 at end-2009 to 261 at the end of Q1/2010 (Graph 3.3). At the same time, the swap premium, an indicator of expected direction of movement in the rupiah, remained stable in all tenors (Graph 3.4).
The improvement in domestic risks bolstered the attractiveness of rupiah-denominated investments. Rupiah returns were reflected in the level of Uncovered Interest Parity (UIP) at 6.33%, still the highest compared to other countries in Asia (Graph 3.5). Improvement in the risk premium provided added attraction for investment in the rupiah, reflected in the rising trend in Covered Interest Parity (CIP) indicator so far in 2010. At the end of March 2010, the CPI indicator stood at 4.69%, higher than for any other country in Asia (Graph 3.6).
INFLATION
Inflation remained at subdued levels in Q1/2010. Measured annually, CPI inflation in Q1/2010 was recorded at 3.43% (yoy), up from the end-2009 level of 2.78% (yoy) (Graph 3.7). Despite edging upwards,
Graph 3.3
Swap Premium in Various Tenors
���������� ����������
UIP for Countries in the Region
CPI inflation remained well within comfortable limits. Reflecting this is the downward trend in CPI inflation over the months, with March 2010 even recording deflation at 0.14% (mtm).
The higher CPI inflation in Q1/2010 compared to end-2009 was fuelled mainly from pressure in the volatile foods category. The delay in the rice harvest led to some shortages that in turn boosted prices. Alongside this, low imported inflation, modest inflation expectations and absence of strategic Government decisions proved adequate to offset pressure in the volatile foods category and thus keep inflation at a subdued level.
Disaggregated by category of expenditure, inflationary pressure during Q1/2010 came mainly from the foodstuffs and processed food categories (Graph 3.8). Strong pressure from escalating prices for rice and other commodities early in the quarter pushed the foodstuff index to 129.59 in Q1/2010, up from the end-2009 level of 127.46. Besides this, indices for other categories of goods, such as processed foods, also mounted significantly over the preceding period due to price increases in products made with rice and granulated sugar.
Core inflation eased during Q1/2010. Measured annually, core inflation was recorded at 3.56% (yoy), down from the end-2009 level of 4.28% (yoy). This decline came in response to external and domestic factors. On the external side, low international commodity prices and the appreciating trend in the rupiah curbed imported inflation. While inflation in trading partners did rise in line with the recovery in the world economy, this did not have a significant effect on core inflation (Graph 3.9). This was reflected in inflation indicators, including lower inflation in imported commodities and the import wholesale price index (Graph 3.10).
On the domestic front, solid economic fundamentals helped curb inflation expectations. The fairly strong economic growth at 5.4% in Q4/2009, low inflation and appreciating exchange rate had a positive effect on inflation expectations. Results from the Consensus Forecast (CF) survey in March 2010 point to a moderating trend in inflation expectations during 2010, while in 2011, expectations of inflation are predicted to be stable (Graph 3.11). Other surveys, namely the Consumer Survey and the Bank Indonesia Retail Sales Survey, also reflect comfortable levels of consumer and trader expectations (Graphs 3.12 and 3.13).
Concerning the output gap, renewed growth in demand was still met by adequate supply-side response. Pressure from the output gap on inflation has thus been kept at a minimal level. Indications of an
Graph 3.6
CIP for Countries in the Region
onset of rising demand were visible in the upward turn in real sales growth (Graph 3.14). Increases took place mainly in the clothing and accessories category and in construction. In other developments, supply-side indicators reflected in the manufacturing production index began showing a rising trend (Graph 3.15). This is consistent with capacity utilisation in manufacturing, which is also on an upward trend (Graph 3.16).
Volatile foods inflation began to mount during Q1/2010. The volatile foods category recorded 4.41% inflation (yoy), up from the end-2009 level of 3.95% (yoy). This increase was driven mainly by high rice prices in early Q1/2010, due to the effect of the delayed harvest and distribution constraints. The escalation in rice prices in turn boosted prices in the processed foods category, particularly for products made from rice. Nevertheless, this condition was resolved towards the end of the period. In March 2010, rice supplies improved with the effect of curbing further price increases for rice and even producing deflation in the volatile foods category at 1.14% (mtm) during that month.
In the administered prices category, inflationary pressure during Q1/2010 was minimal due to the absence of strategic policy decisions. With no Government plan put into effect for changes in administered prices during Q1/2010, administered prices inflation was kept at a low level. Cigarettes and household fuels were the two dominant commodities with contributions to inflation in the administered prices category at 0.06% and 0.03%. By comparison, gasoline accounted for a mere 0.02% contribution to inflation during Q1/2010. This was related to the 87.8% rise in international crude oil prices since the beginning of the year. Taken together, administered prices inflation in Q1/2009 reached 0.71% (qtq) or 2.31% (yoy).
MONETARY POLICY Interest Rates
Monetary policy transmission operated smoothly through the short-term interest rate channel during Q1/2010. This was enabled in particular by the excess levels of bank liquidity that steered the O/N interbank rate on a downward course for the lower limit of the BI Rate corridor. The daily average O/N interbank eased 11 bps to 6.19%, or 31 bps below the BI Rate (Graph 3.17). This movement was then transmitted to interbank rates in longer tenors, bringing improvement to the interbank market interest rate structure. Like movement in the O/N interbank rate, interbank rated in above O/N tenors also eased in about the same magnitude (Graph 3.18). The
Graph 3.9
Inflation of Trading Partner Countries and Exchange Rate
�����������������������������
Imported Commodies Inflation, Core Inflation, and WPI Imports
weighted average interbank rates in the 2-6, 8-26 and above 30 day tenors came down by 7-11 bps, except for the 27-30 tenor which fell by a steeper 57 bps. This is an indication of steady improvement in perceptions of counterparty risk in line with the ongoing easing of risks on the money market.
Monetary policy transmission improved in the deposit rate channel. The improvement in transmission took place in periods of no change and also decline in the BI Rate. In Q1/2010, indications point to 18bps reduction in 1-month deposit rates (Table 3.1). Accordingly, the BI Rate maintained at 6.5% since September 2009 met with positive response in a total 117 bps decline in 1-month deposit rates (as of February 2010), an improvement when compared to the previous period of no change in the BI Rate (August 2007 until January 2008). From December 2008 to February 2010, 1-month deposit rates came down by 335 bps in response to a total 300 bps reduction in the BI rate, representing a similar improvement over the preceding period of BI Rate decline (May 2006 until July 2007) when deposit rates eased 283 bps in comparison to the total BI Rate reduction of 425 bps.
The decline in deposit rates was accompanied by improvement in the deposit rate structure in various tenors. Reflecting this was the comparatively flat structure in deposit rates, although 12-month deposit rates remained above rates in the 24-month tenor.
In analysis by category of bank, the steepest decline in time deposit rates took place at foreign and joint venture banks. During Q1/2010, foreign and joint venture banks lowered deposit rates by 20 bps, the steepest reduction for any category of bank. By comparison, state owned banks lowered rates by -12 bps, Regional Development Banks by -10 bps and private banks by -7 bps. Despite this, during the period of no change in the BI Rate (since September 2009), state owned banks have pursued the most aggressive cuts in their deposit rates at 149 bps, with private banks next at 102 bps. Concerning level of rates, foreign and joint venture banks offer the lowest average deposit rate (7.3%), while Regional Development Banks offer the highest average rates (8.7%).
Monetary policy transmission is continuing in the credit channel. In Q1/2010, lending rates showed indications of continued decline alongside easing bank perceptions of economic risks. Average decline in lending rates as of February 2010 (from September 2009) reached 56 bps, or only half of the fall in 1-month deposit rates at 117 bps.
Graph 3.12. (Bank Indonesia Retail Sales Survey)
This is partly explained by persistently high perceptions of lending risk and bank efforts to maintain high margins amid low demand for credit.
In analysis by category of use, rates for working capital credit have declined by a more significant magnitude. With perceptions of economic risk easing in the banking system, working capital credit rates are estimated to be falling more aggressively, while rates for consumption credit are predicted to be thinner than for other rates, due to the less elastic nature of this lending to changes in interest rates (Table 3.1). In analysis by category of bank, state-owned banks in aggregate terms offered the lowest credit interest rates. The highest average working capital credit rate were offered by private domestic banks and Regional Development Banks, while foreign and joint venture banks, like before, charged the steepest interest rates on consumption credit.
Funds, Credits, and the Money Supply
Estimates point to slowing growth in depositor funds during Q1/2010 in keeping with the historical trend at the start of the year. As of February 2010, funding growth reached only 9.3% (yoy), down from the end-2009 expansion of 12.5% (yoy) (Graph 3.19). In response to these developments, the depositor funds position in Q1/2010 (as of February 2010) narrowed by Rp 41.4 trillion to Rp 1,931.6 trillion. When compared to the same period one year earlier (February 2009), depositor funds were in fact up by Rp 13.8 trillion. This occurred because during the crisis, members of the public were reluctant to draw on their funds for economic activity and preferred to keep their funds in banks. The resumption
Interest Rate (%)
Jan Feb Mar Apr May June July Augt Sept Oct Nov Dec Jan Feb Mar
Quarter I-2009 Quarter II-2009 Quarter III-2009
Table 3.1 Interest Rate Movements
BI Rate 8.75 8.25 7.75 7.50 7.25 7.00 6.75 6.50 6.50 6.50 6.50 6.50 6.50 6.50 6.50 Deposit Guarantee 9.50 9.00 8.25 7.75 7.75 7.50 7.25 7.00 7.00 7.00 7.00 7.00 7.00 7.00 7.00 1-month Deposit (Weighted Average) 10.52 9.88 9.42 9.04 8.77 8.52 8.31 7.94 7.43 7.38 7.16 6.87 7.09 na na Base Lending Rate 14.18 13.98 13.94 13.78 13.64 13.40 13.20 13.00 12.96 13.01 12.94 12.83 12.65 12.66 12.65 Working Capital Credit 15.23 15.08 14.99 14.82 14.68 14.52 14.45 14.30 14.17 14.09 13.69 13.69 13.75 na na Investment Credit 14.37 14.23 14.05 14.05 13.94 13.78 13.58 13.48 13.20 13.20 13.03 12.96 13.24 na na Consumption Credit 16.46 16.53 16.46 16.48 16.57 16.63 16.66 16.62 16.67 16.53 16.47 16.42 16.32 na na
Quarter IV-2009 Quarter I-2010
Graph 3.15
Manufacturing Production Index (SP)
���
���
���
��
� � � � � � � � ������� � � � � � � � � �������� � � � � � � � ������� � � � � � � � � ������� � � � � � � � � �������
���� ���� ���� ���� ����
���������������������������
Graph 3.16
Manufacturing Capacity Utilisation (SP)
���
��
��
��
�� �
�������������������������������
� � � � � � � � ������� � � � � � � � � ������� � � � � � � � � ������� � � � � � � � � ������� � � � � � � � � �������
���� ���� ���� ���� ����
of normal developments in depositor funds in Q1/2010 in line with the historical trend is a positive indication for economic activities in the population during Q1/2010.
In other developments, credit expansion during Q1/2010 took a positive turn. Credit growth in Q1/2010, including channelling, reached 9.4% (yoy), up from the end-2009 level of 8.7% (yoy) (Graph 3.19). When compared to end-2009, the credit position in Q1/2010 (as of February 2010) had narrowed further by Rp 11.2 trillion. However, when compared to the same period on year earlier (February 2009), the decline in the credit position at that time was considerably greater than at the present. This indicates an improvement in credit expansion over the preceding year, a development also confirmed by the improved monthly change in credit in February 2010 compared to performance over the past 3 years. The credit trend is forecasted to improve further in keeping with the recovery under way in domestic and external demand.
Improvement in monetary policy transmission through the credit channel was observed on both the demand side and supply side. On the demand side, stronger credit expansion was driven by the onset of recovery in domestic and external economic activity accompanied by decline in loan interest rates, as indicated by the narrowing spread between lending rates and the BI Rate. On the supply side, bank perceptions of economic risk were beginning to improve, a development that contributed towards decline in loan interest rates.
In analysis by category of use, consumption credit and investment credit maintained positive growth, in contrast to the still negative growth in working capital credit. In February 2010, working capital credit continued to record negative expansion at 4.8% (yoy). At the same time, growth in investment credit and consumption credit reached 14.7% (yoy) and 34% (yoy). The highly aggressive expansion in consumption credit boosted the aggregate level of credit expansion. In disaggregation by currency, stronger lending growth in Q1/2010 was primarily visible in rupiah-denominated credit, while credit in foreign currencies (USD) continued to show negative growth.
In analysis by sector, the improvement in credit expansion was contributed mainly by the miscellaneous sector. During Q1/2010, the miscellaneous sector underwent accelerated credit expansion at 43.5% (yoy), up from 18.8% (yoy) at the end of the preceding
Graph 3.17
Interbank O/N Rate & Monetary Instrument
�� �
Interbank Rate in Various Tenors
��� �
Funding, Credit Growth, and BI Rate
year (Graph 3.20). Other sectors also reporting accelerated lending growth were mining, transportation and social services. The electricity, gas and water utilities sector also reported brisk lending growth. In other areas, the onset of improvement in external conditions is expected to bring improved lending growth to the manufacturing and trade sectors in response to mounting external demand.
Economic liquidity and particularly M1 maintained steady expansion during Q1/2010. Growth in M1 economic liquidity, on a steady rise since October 2009, reached 13.7% (yoy) in February 2010 (Graph 3.21). Higher than expected economic growth alongside lower than expected inflation were the twin factors contributing to the steady M1 growth. M1 growth came largely from additional demand deposits while currency outside banks also showed a rising trend. The growth in demand deposits held by individuals and miscellaneous private business entities1 was consistent with credit
expansion. Besides this, growth in personal demand deposits was consistent with movement in the JSX Composite Index (JCI), reflecting increased public activity in conducting transactions in the financial sector. Indications suggest that this continued in Q1/2010 in response to positive returns on the stock market. These conditions confirm the steady improvement in domestic liquidity conditions. In other developments, growth in M2 and Rupiah M2 economic liquidity as of February 2010 was recorded at 10.4% and 12.3% (yoy), down from the end-2009 growth at 13.2% and 14.0% (yoy) (Graph 3.21). The M2 and Rupiah M2 positions narrowed by Rp 44.4 trillion and Rp 40.8 trillion due to reduction in quasi-money components at the beginning of the year.
Financial Markets
The JSX Composite Index showed positive performance during Q1/2010. During the quarter, the JSX Composite mounted 10.2% to close at 2,777.3. The Bank Indonesia decision to hold the BI Rate at 6.5% at the end of Q1/2010 was one factor bolstering index gains. This policy was translated by the market as a move by Bank Indonesia to boost economic growth momentum while keeping inflation on course for the inflation target for 2010. Added to this, the buoyant 5.4% economic growth in Q4/2009 alongside the upgrading the sovereign bond rating by S&P and Fitch paved the way for the JCI to chart the highest gains of any country in the region 2
1 Monetary Data from Commercial Bank Reports as of December 2009.
2 ahead of other stock markets including Vietnam, Thailand, Philippines, Malaysia, Singapore, China, Hongkong, India, UK, Japan and the US. During this time, the usually high-performing stock markets in China and India in fact reported relatively constrained
Graph 3.20
Nominal Growth of M1 and M2
�� JCI and Net Foreign Buying