DBS Group Holdings Ltd Incorporated in the Republic of Singapore Company Registration Number: 199901152M
To: Shareholders
The Board of Directors of DBS Group Holdings Ltd (“DBSH”) reports the following:
Unaudited Financial Results for the Third Quarter Ended 30 September 2013
Details of the unaudited financial results are in the accompanying Performance Summary.
Dividends
For the third quarter of 2013, no dividend has been declared for DBSH non-voting redeemable convertible preference shares and DBSH ordinary shares.
By order of the Board Goh Peng Fong Group Secretary 31 October 2013 Singapore
Performance Summary
Unaudited Financial Results
For the Third Quarter ended
30 September 2013
DBS Group Holdings Ltd
Contents Page
Overview 2
Net Interest Income 4
Net Fee and Commission Income 6
Other Non-Interest Income 6
Expenses 7
Allowances for Credit and Other Losses 7
Performance by Business Segments 8
Performance by Geography 11
Customer Loans 14
Non-Performing Assets and Loss Allowance Coverage 15
Customer Deposits 19
Debts Issued 19
Value at Risk and Trading Income 20
Capital Adequacy 21
Additional Pillar 3 Disclosures 22
Unrealised Valuation Surplus 22
Unaudited Consolidated Income Statement 23
Unaudited Consolidated Statement of Comprehensive Income 23
Unaudited Balance Sheets 24
Unaudited Consolidated Statement of Changes in Equity 25
Unaudited Statement of Changes in Equity 26
Unaudited Consolidated Cash Flow Statement 27
Additional Information
Issuance of Ordinary Shares 28
Interested Person Transactions 28
Selected Notes to the Interim Financial Statements 29
OVERVIEW
DBS Group Holdings Ltd (“DBSH”) prepares its consolidated DBSH Group (“Group”) financial statements in accordance with Singapore Financial Reporting Standard (“FRS”), as modified by the requirements of Notice to Banks No. 612 “Credit Files, Grading and Provisioning” issued by the Monetary Authority of Singapore. The accounting policies and methods of computation applied for the current financial periods are consistent with those applied for the financial year ended 31 December 2012, with the exception of the adoption of new or revised FRS.
On 1 January 2013, the Group adopted the following new or revised FRS that are issued by the Accounting Standards Council and relevant for the Group:
FRS 113 Fair Value Measurement
Amendments to FRS 107 Disclosures- Offsetting Financial Assets and Financial Liabilities Amendments to FRS 1 – Presentation of Items of Other Comprehensive Income
Improvements to FRSs (issued in August 2012)
FRS 113 defines fair value, establishes a framework for measuring fair value and sets out the disclosure requirements for fair value measurements. It explains how to measure the fair value when it is required by other FRS. It does not introduce new fair value measurements; neither does it eliminate the practicability exceptions to fair value measurements that currently exist in certain standards.
Amendments to FRS 107 Disclosures introduce more extensive disclosures that focus on quantitative information about recognised financial instruments that are offset on the balance sheet as well as those that are subject to master netting or similar arrangements irrespective of whether they are offset on the balance sheet.
There is no significant impact on the Group’s financial statements from the adoption of the above FRS or revised FRS. 3rd Qtr
Net fee and commission income
Allowances for credit and
other losses 151 55 >100 245 (38) 619 303 >100
Key financial ratios (%) 5/
Net interest margin 1.60 1.67 1.62 1.62 1.72
Non-interest/total income 34.6 33.5 40.1 39.3 34.6
Cost/income ratio 44.1 45.0 42.7 42.6 43.8
Return on assets 0.87 0.95 0.94 0.96 0.99
3rd Qtr Common Equity Tier 1 capital
adequacy ratio 6/ 13.3 NA 12.9 13.3 NA
Per diluted share
– earnings 1.38 1.38 1.44 1.46 1.42
– net book value 7/ 13.16 12.41 13.12 13.16 12.41
Notes:
1/ Includes customer loans classified as financial assets at fair value through profit or loss on the balance sheet 2/ Includes interbank assets classified as financial assets at fair value through profit or loss on the balance sheet 3/ Includes customer deposits classified as financial liabilities at fair value through profit or loss on the balance sheet 4/ Includes interbank liabilities classified as financial liabilities at fair value through profit or loss on the balance sheet
5/ Return on assets, return on equity, specific allowances (loan)/average loan and per share data are computed on an annualised basis
6/ With effect from 1 January 2013, Basel III capital adequacy requirements came into effect in Singapore. Changes due to Basel III affected both eligible capital and risk-weighted assets. Capital adequacy disclosures relating to dates prior to 1 January 2013 are calculated in accordance with the then prevailing capital adequacy regulations and are thus not directly comparable to those pertaining to dates from 1 January 2013.
7/ Non-controlling interests are not included as equity in the computation of return on equity and net book value per share NA Not Applicable
Net profit for the third quarter was $862 million. Net interest income reached a record and fee income from annuity businesses was maintained at recent highs. The results were slightly higher than a year ago as the increase in total income was offset by higher general and specific allowances. Compared to the previous quarter, net profit was 3% lower as trading activity was pared given the uncertain market outlook.
Net interest income rose 6% from a year ago and 2% from the previous quarter to $1.41 billion. Loans grew 19% from a year ago but the impact was partially offset by lower loan spreads and yields on investment securities. Compared to the previous quarter, loans were 3% higher while net interest margin eased slightly.
Non-interest income of $744 million was 11% higher than a year ago. Trade and transaction services, wealth management and treasury cross-selling contributed to the increase. Compared to the previous quarter, non-interest income fell 20% due to lower contributions from market-related activities.
Expenses were managed at $949 million, rising less quickly by 5% from a year ago than the 7% increase in total income. Expenses were 4% lower than the previous quarter.
Asset quality remained healthy as the non-performing loan rate was unchanged from the previous quarter at 1.2%. Specific allowances for loans of 15 basis points were double the exceptionally low levels a year ago but lower than the previous quarter’s 22 basis points. Allowance coverage of 136% was in line with recent quarters’ levels.
Funding from deposits and wholesale sources grew faster than loans during the quarter as liquidity buffers were enhanced. Capital ratios continued to exceed regulatory standards.
NET INTEREST INCOME
1/ Net interest margin is net interest income expressed as a percentage of average interest-earning assets
Net interest income rose 6% from a year ago and 2% from the previous quarter to $1.41 billion from higher customer loan volumes.
Net interest margin fell seven basis points from a year ago and two basis points from the previous quarter to 1.60%. The decline from both periods was due to lower corporate and trade loan spreads, and lower yields on investment securities.
3rd Qtr 2013 versus 3rd Qtr 2012 3rd Qtr 2013 versus 2nd Qtr 2013 Volume and rate analysis ($m)
Increase/(decrease) due to change in Volume Rate Net change Volume Rate change Net
Interest income
Customer loans 237 (111) 126 58 (24) 34
Interbank assets (16) (3) (19) 4 4 8
Securities 23 (63) (40) (15) (18) (33)
Total 244 (177) 67 47 (38) 9
Interest expense
Customer deposits 51 (42) 9 13 (7) 6
Other borrowings 15 (31) (16) 4 (10) (6)
Total 66 (73) (7) 17 (17) -
Net impact on interest income 178 (104) 74 30 (21) 9
Due to change in number of days - 15
Net Interest Income 74 24
9 Mths 2013 versus 9 Mths 2012 Volume and rate analysis ($m)
Increase/(decrease) due to change in Volume Rate Net change Interest income
Customer loans 613 (280) 333
Interbank assets (31) (5) (36)
Securities 109 (205) (96)
Total 691 (490) 201
Interest expense
Customer deposits 138 (42) 96
Other borrowings 48 (81) (33)
Total 186 (123) 63
Net impact on interest income 505 (367) 138
Due to change in number of days (15)
NET FEE AND COMMISSION INCOME
Less: fee and commission
expense 59 51 16 58 2 178 146 22
Total 462 422 9 477 (3) 1,446 1,207 20
Notes:
1/ Includes trade & remittances, guarantees and deposit-related fees 2/ Net of interchange fees paid
Net fee and commission income increased 9% from a year ago to $462 million, led by wealth management, trade and transaction services and cards, in line with efforts to grow these businesses. Compared to the previous quarter, declines in contributions from investment banking and stockbroking resulted in a 3% decrease in net fee and commission income.
For the nine months, net fee and commission income rose 20% to a record $1.45 billion. All fee segments were higher, with wealth management leading the increase. Higher contributions from stockbroking and investment banking were due to strong capital market activities in the first half of the year.
OTHER NON-INTEREST INCOME
($m) 3rd Qtr
Net (loss)/income from financial
instruments designated at fair value (18) (7) (>100) 6 NM (14) (46) 70 Net income from financial
investments 83 110 (25) 45 84 194 316 (39)
Net gain on fixed assets - - - 44 NM 44 8 >100
Others (include rental income) 11 10 10 25 (56) 45 27 67
Total 282 250 13 450 (37) 1,215 906 34
Note:
NM Not Meaningful
Total other non-interest income rose 13% from a year ago to $282 million. Trading income (including net income from financial instruments designated at fair value) rose 45% to $188 million as trading gains and income from treasury customer flows were higher. Compared to the previous quarter, total other non-interest income was 37% lower as trading income fell 44%.
EXPENSES Included in the above table were:
Depreciation of properties and other fixed
assets 52 43 21 53 (2) 160 126 27
Directors’ fees 2 1 100 1 100 4 2 100
Audit fees payable 2 2 - 1 100 5 5 -
Expenses rose 5% from a year ago to $949 million as staff and other operating costs were higher. Expenses fell 4% from the previous quarter.
For the nine months, costs rose 8% to $2.89 billion from higher headcount and investments to support business growth. The cost-income ratio improved from 44% a year ago to 43%.
ALLOWANCES FOR CREDIT AND OTHER LOSSES
($m) 3rd Qtr
Specific allowances (SP) for securities, properties and other assets
1 4 (75) 4 (75) 4 20 (80)
Total 151 55 >100 245 (38) 619 303 >100
Notes:
1/ Specific allowances for loans are classified according to where the borrower is incorporated. NM Not Meaningful
Specific allowances for loans rose to $93 million from $36 million a year ago, or to 15 basis points of loans from seven basis points a year ago. General
allowances also rose, from $15 million to $57 million, in line with faster loan growth. Both general allowances and specific allowances were lower than the previous quarter.
PERFORMANCE BY BUSINESS SEGMENTS
($m)
Consumer Banking/
Wealth Mangement
Institutional Banking
Treasury Others Total
Selected income items
3rd Qtr 2013
Net interest income 381 759 169 97 1,406
Non-interest income 255 387 56 46 744
Total income 636 1,146 225 143 2,150
Expenses 432 345 121 51 949
Allowances for credit and other losses 25 73 (3) 56 151
Share of profits of associates - - - 17 17
Profit before tax 179 728 107 53 1,067
2nd Qtr 2013
Net interest income 364 742 180 96 1,382
Non-interest income 259 440 106 122 927
Total income 623 1,182 286 218 2,309
Expenses 427 346 119 95 987
Allowances for credit and other losses 20 193 (1) 33 245
Share of profits of associates - - - 22 22
Profit before tax 176 643 168 112 1,099
3rd Qtr 2012
Net interest income 356 697 160 119 1,332
Non-interest income 213 378 64 17 672
Total income 569 1,075 224 136 2,004
Expenses 407 318 112 64 901
Allowances for credit and other losses 28 (18) (1) 46 55
Share of profits of associates - - - 28 28
Profit before tax 134 775 113 54 1,076
9 Mths 2013
Net interest income 1,104 2,219 512 280 4,115
Non-interest income 777 1,311 322 251 2,661
Total income 1,881 3,530 834 531 6,776
Expenses 1,259 1,010 350 269 2,888
Allowances for credit and other losses 63 439 (4) 121 619
Share of profits of associates - - - 66 66
($m)
Treasury Others Total
9 Mths 2012
Net interest income 1,079 2,079 541 293 3,992
Non-interest income 659 1,129 287 38 2,113
Total income 1,738 3,208 828 331 6,105
Expenses 1,157 907 332 275 2,671
Allowances for credit and other losses 75 127 (3) 104 303
Share of profits of associates - - - 103 103
Profit before tax 506 2,174 499 55 3,234
Selected balance sheet and other items 1/
30 Sept 2013
Total assets before goodwill 70,906 202,892 84,769 38,004 396,571
Goodwill on consolidation 4,802
Total assets 401,373
Total liabilities 139,313 127,222 82,662 15,287 364,484
Capital expenditure for 3rd Qtr 2013 19 8 1 41 69
Depreciation for 3rd Qtr 2013 7 2 2 41 52
30 Jun 2013
Total assets before goodwill 68,186 198,432 78,313 36,867 381,798
Goodwill on consolidation 4,802
Total assets 386,600
Total liabilities 139,914 121,567 76,288 12,123 349,892
Capital expenditure for 2nd Qtr 2013 11 9 6 29 55
Depreciation for 2nd Qtr 2013 8 2 2 41 53
30 Sept 2012
Total assets before goodwill 61,705 169,570 82,656 41,869 355,800
Goodwill on consolidation 4,802
Total assets 360,602
Total liabilities 134,727 98,968 82,449 9,618 325,762
Capital expenditure for 3rd Qtr 2012 20 8 - 65 93
Depreciation for 3rd Qtr 2012 7 3 2 31 43
Note:
1/ Refer to sections on Customer Loans and Non-Performing Assets and Loss Allowance Coverage for more information on business segments
The business segment results are prepared based on the Group’s internal management reporting which reflects the organisation management structure. As the activities of the Group are highly integrated, internal allocation has been made in preparing the segment information. Amounts for each business segment are shown after the allocation of certain centralised costs, funding income and the application of transfer pricing, where appropriate. Transactions between segments are recorded within the segment as if they are third party transactions and are eliminated on consolidation.
The various business segments are described below: Consumer Banking/ Wealth Management
Consumer Banking/ Wealth Management provides individual customers with a diverse range of banking and related financial services. The products and services available to customers include current and savings accounts, fixed deposits, loans and home finance, cards, payments, investment and insurance products.
Allowances rose 25% to $25 million mainly due to increased general allowances in line with loan growth. Compared to a year ago, profit before tax rose 34%.Total Income increased 12%. Net interest income rose 7% to $381 million, while non-interest income rose 20% to $255 million from continued customer growth and stronger cross-selling. Expenses rose 6% while allowances declined 11%.
For the nine months of the year, profit before tax was $559 million, 10% higher than a year ago. Income grew 8% to $1.88 billion. Net-interest income rose 2%. Non-interest income increased 18% to $777 million driven by higher contributions from wealth management and cards fees. Expenses rose 9% to $1.26 billion due to
headcount growth, investment in business capabilities and higher marketing and advertising activities.
Allowances declined 16% to $63 million from both lower general and specific allowances.
Institutional Banking
Institutional Banking provides financial services and products to institutional clients including bank and non-bank financial institutions, government- linked companies, large corporates and small and medium-sized businesses. The business focuses on
broadening and deepening customer
relationships. Products and services comprise the full range of credit facilities from short term working capital financing to specialized lending. It also provides global transactional services such as cash management, trade finance and securities and fiduciary services; treasury and markets products; corporate finance and advisory banking as well as capital markets solutions. In addition, Institutional Banking also includes Islamic Bank of Asia. Compared to the previous quarter, profit before tax rose 13% to $728 million as allowances were 62% lower. Net interest income rose 2% on the back of similar growth in assets. Non-interest income was 12% lower due to slower sales of treasury products. Total income was marginally lower by 3% at $1.15 billion. Expenses were little changed at $345 million as the business remained disciplined in the
management of cost. Allowances declined as general allowances were lower due to slower loan growth. Compared to a year ago, profit before tax declined 6%. Allowances were normalised in the current quarter compared to a write-back a year ago. The higher allowances were partially offset by a 7% increase in total income.
For the nine months of the year, profit before tax was 4% lower at $2.08 billion. Total income increased 10%, largely due to higher non-interest income from increased
customer focus and cross-selling. Expenses increased 11% from headcount growth and investment in business capabilities. Allowances tripled as general allowances increased in line with the faster loan growth and specific allowances rose from an exceptionally low level a year ago.
Treasury
Income reflected in the Treasury segment refers to trading and market-making income. Total income fell 21% from the previous quarter to $225 million as trading gains in foreign exchange products were lower, partially offset by higher trading gains on interest rate and credit products. Geographically, the decline in income came mainly from Singapore, Hong Kong and Taiwan, while income from Indonesia and India were higher. Expenses rose
marginally by 2% to $121 million as business related costs increased. Profit before tax fell 36% to $107 million. Income from treasury customer flows is reflected in the Institutional Banking and Consumer Banking/Wealth Management segments and not in Treasury. Income from customer flows fell 19% to $228 million from the previous quarter due to declines in customer related transactions in Hong Kong, Singapore, China and Taiwan as market outlook was uncertain. This was partially offset by increase in customer flows from Indonesia.
Compared to a year ago, profit before tax was 5% lower due to higher expenses. Total expenses rose 8% as headcount grew to support business growth, and occupancy and business related costs were higher. Total income was little changed as higher contributions from China, Indonesia, India, Hong Kong and Korea, were offset by lower income from Singapore. Income from customer flows rose 4% from a year ago.
For the nine months of the year, profit before tax fell marginally by 2% to $488 million as income was little changed. Expenses increased 5% to $350 million from higher staff, occupancy and other business expenses. Income from treasury customer flows for the first nine months rose 12% from a year ago to $805 million from higher sales to corporate, retail and wealth management customers in Hong Kong, Taiwan, China and Korea.
Others
PERFORMANCE BY GEOGRAPHY 1/
($m)
S’pore Hong
Kong
Rest of Greater China
South and South-east Asia
Rest of the World
Total
Selected income items 3rd Qtr 2013
Net interest income 880 263 119 94 50 1,406
Non-interest income 395 166 76 76 31 744
Total income 1,275 429 195 170 81 2,150
Expenses 530 179 145 74 21 949
Allowances for credit and other losses 18 61 27 30 15 151
Share of profits of associates 4 - 3 10 - 17
Profit before tax 731 189 26 76 45 1,067
Income tax expense 76 30 10 21 15 152
Net profit 603 159 16 54 30 862
2nd Qtr 2013
Net interest income 864 250 104 111 53 1,382
Non-interest income 505 274 80 37 31 927
Total income 1,369 524 184 148 84 2,309
Expenses 575 186 133 71 22 987
Allowances for credit and other losses 143 41 19 31 11 245
Share of profits of associates 3 - 3 16 - 22
Profit before tax 654 297 35 62 51 1,099
Income tax expense 94 43 14 9 2 162
Net profit 510 254 21 53 49 887
3rd Qtr 2012
Net interest income 813 228 110 118 63 1,332
Non-interest income 463 145 32 22 10 672
Total income 1,276 373 142 140 73 2,004
Expenses 527 168 124 66 16 901
Allowances for credit and other losses 69 (20) 8 8 (10) 55
Share of profits of associates 5 - 1 22 - 28
Profit before tax 685 225 11 88 67 1,076
Income tax expense 95 38 - 18 14 165
Net profit 535 187 11 70 53 856
9 Mths 2013
Net interest income 2,579 744 324 314 154 4,115
Non-interest income 1,514 683 225 157 82 2,661
Total income 4,093 1,427 549 471 236 6,776
Expenses 1,684 533 396 214 61 2,888
Allowances for credit and other losses 259 143 52 72 93 619
Share of profits of associates 11 - 7 48 - 66
Profit before tax 2,161 751 108 233 82 3,335
Income tax expense 253 116 34 56 22 481
($m)
Selected balance sheet items 30 Sept 2013
Total assets before goodwill 254,682 69,992 41,821 17,046 13,030 396,571
Goodwill on consolidation 4,802 - - - - 4,802
Total assets 259,484 69,992 41,821 17,046 13,030 401,373
Non-current assets 2/ 2,278 349 104 29 3 2,763
Gross customer loans 156,263 52,974 20,079 8,639 7,325 245,280
30 Jun 2013
Total assets before goodwill 246,092 63,587 41,490 17,579 13,050 381,798
Goodwill on consolidation 4,802 - - - - 4,802
Total assets 250,894 63,587 41,490 17,579 13,050 386,600
Non-current assets 2/ 2,223 351 106 19 2 2,701
Gross customer loans 153,224 48,283 19,949 9,408 7,529 238,393
30 Sept 2012
Total assets before goodwill 236,463 56,899 32,567 17,327 12,544 355,800
Goodwill on consolidation 4,802 - - - - 4,802
Total assets 241,265 56,899 32,567 17,327 12,544 360,602
Non-current assets 2/ 1,843 357 110 20 1 2,331
Gross customer loans 131,646 39,611 17,398 10,171 6,909 205,735
Notes:
1/ The geographical segment analysis is based on the location where transactions and assets are booked 2/ Includes investment in associates, properties and other fixed assets, and investment properties
The performance by geography is classified based on the location in which income and assets are recorded. Singapore
Net profit rose 18% from the previous quarter to $603 million. Total income fell 7% to $1.28 billion. Net interest income rose 2% to $880 million from higher loan volumes. Non-interest income was 22% lower at $395 million as stockbroking and investment banking fees fell. Trading gains were also lower.
Expenses were 8% lower at $530 million and profit before allowances was 6% lower at $745 million. Allowances fell 87% to $18 million from lower specific and general allowances.
Compared to a year ago, net profit rose 13% as income and expenses were little changed while allowances fell from lower general allowances.
Hong Kong
Currency effects were minimal compared to the previous quarter and a year ago.
Net profit fell 37% from the previous quarter to $159 million as total income fell 18% to $429 million. Net interest income increased 5% to $263 million from higher loan volumes. Loans rose 10% from growth in trade finance while deposits increased 8%. Net interest margin fell five basis points to 1.55%.
Non-interest income decreased 39% to $166 million, as the previous quarter had property disposal gains. Excluding the gains, non-interest income would be 28% lower. Fee income decreased as investment banking, stockbroking and loan related fees fell. Trading income fell from lower treasury customer flows given the uncertain market outlook Expenses were 4% lower at $179 million as staff costs fell. Allowances rose 49% to $61 million as general allowances increased in line with loan growth.
Compared to a year ago, net profit was 15% lower as an increase in total income was more than offset by higher total allowances. Net interest income increased 15% from higher loan volumes. Non-interest income was 14% higher from increased treasury customer flows and higher trading gains. Expenses rose 7%. Allowances increased to $61 million compared to a write back of $20 million a year ago as general and specific allowances were higher.
For the nine months, net profit rose 15% to $635 million as total income increased 26% to $1.43 billion. Net interest income was higher from loan growth and lower funding costs. Net interest margin rose nine basis points to 1.56%. Non-interest income rose 45% due to higher treasury customer flows and trading gains as well as asset disposal gains. Expenses were 9% higher at $533 million while allowances increased as higher general allowances were taken in line with loan growth.
Other regions
Net profit for Rest of Greater China fell 24% from the previous quarter to $16 million as higher income was more than offset by an increase in expenses and allowances. Net interest income was 14% higher at $119 million from better
margins, while non-interest income fell 5% to $76 million from lower trading gains. Expenses rose 9% to $145 million due to higher staff costs. Allowances rose 42% to $27 million as specific allowances were higher.
Compared to a year ago, net profit rose 45%. Higher net interest and non-interest income were partially offset by higher expenses and total allowances.
For the nine months, net profit fell 44% to $74 million. Total income rose 4% to $549 million as a decline in net interest income from lower net interest margin was partially offset by increased fee income and treasury income from customer flows. Expenses rose 13% to $396 million while allowances tripled to $52 million due to higher specific allowances.
CUSTOMER LOANS 1/
($m) 30 Sept 2013 30 Jun 2013 31 Dec 2012 30 Sept 2012
Gross 245,280 238,393 213,828 205,735
Less:
Specific allowances 1,197 1,286 1,217 1,189
General allowances 2,360 2,320 2,092 2,053
Net total 241,723 234,787 210,519 202,493
By business unit
Consumer Banking/ Wealth Management 68,838 66,195 61,720 60,122
Institutional Banking 173,489 169,293 149,077 143,436
Others 2,953 2,905 3,031 2,177
Total (Gross) 245,280 238,393 213,828 205,735
By geography 2/
Singapore 116,333 114,626 101,485 98,624
Hong Kong 40,093 37,760 38,119 37,538
Rest of Greater China 46,463 41,641 30,678 27,538
South and South-east Asia 21,628 23,161 23,045 22,751
Rest of the World 20,763 21,205 20,501 19,284
Total (Gross) 245,280 238,393 213,828 205,735
By industry 3/
Manufacturing 30,023 32,556 27,037 26,456
Building and construction 42,089 40,177 36,179 34,939
Housing loans 48,263 47,202 45,570 44,147
General commerce 52,196 48,230 38,230 35,691
Transportation, storage & communications 19,743 19,816 17,745 17,114 Financial institutions, investment & holding companies 10,527 9,976 11,155 10,158 Professionals & private individuals
(excluding housing loans) 18,230 16,989 14,969 14,950
Others 24,209 23,447 22,943 22,280
Total (Gross) 245,280 238,393 213,828 205,735
By currency
Singapore dollar 98,663 97,779 90,503 87,617
Hong Kong dollar 29,660 28,811 29,443 29,162
US dollar 82,354 80,146 67,156 62,254
Others 34,603 31,657 26,726 26,702
Total (Gross) 245,280 238,393 213,828 205,735
Notes:
1/ Includes customer loans classified as financial assets at fair value through profit or loss on the balance sheet 2/ Loans by geography are classified according to where the borrower is incorporated
3/ Certain loans to investment holding companies have been reclassified to better reflect the underlying principal activity of the companies owned by the holding company. The amounts for prior periods have also been reclassified to conform to the current presentation.
Gross customer loans rose 3% from the previous quarter to $245 billion. The increase was due to trade loans and secured consumer borrowing.
NON-PERFORMING ASSETS AND LOSS ALLOWANCE COVERAGE
By business unit
NPA ($m)
SP ($m)
GP ($m)
NPL (% of loans)
(GP+SP)/NPA (%)
(GP+SP)/ unsecured NPA (%)
30 Sept 2013 Consumer Banking/
Wealth Management 300 70 688 0.4 253 468
Institutional Banking 2,638 1,244 1,672 1.5 111 149
Total non-performing
loans (NPL) 2,938 1,314 2,360 1.2 125 174
Debt securities 9 3 125 - 1,422 3,200
Contingent liabilities &
others 107 48 315 - 339 789
Total non-performing
assets (NPA) 3,054 1,365 2,800 - 136 192
30 Jun 2013 Consumer Banking/
Wealth Management 297 71 661 0.4 246 452
Institutional Banking 2,578 1,306 1,659 1.5 115 150
Total non-performing
loans (NPL) 2,875 1,377 2,320 1.2 129 173
Debt securities 9 3 127 - 1,444 2,600
Contingent liabilities &
others 82 48 303 - 428 763
Total non-performing
assets (NPA) 2,966 1,428 2,750 - 141 191
31 Dec 2012 Consumer Banking/
Wealth Management 288 70 617 0.5 239 421
Institutional Banking 2,339 1,232 1,475 1.6 116 142
Total non-performing
loans (NPL) 2,627 1,302 2,092 1.2 129 165
Debt securities 13 4 117 - 931 2,420
Contingent liabilities &
others 86 49 302 - 408 747
Total non-performing
assets (NPA) 2,726 1,355 2,511 - 142 183
30 Sept 2012 Consumer Banking/
Wealth Management 302 81 600 0.5 225 394
Institutional Banking 2,347 1,183 1,453 1.6 112 138
Total non-performing
loans (NPL) 2,649 1,264 2,053 1.3 125 159
Debt securities 13 4 115 - 915 2,380
Contingent liabilities &
others 173 65 294 - 208 506
Total non-performing
By industry 1/
($m) 30 Sept 2013 30 Jun 2013 31 Dec 2012 30 Sept 2012
NPA SP NPA SP NPA SP NPA SP
Manufacturing 526 319 481 289 352 240 363 234
Building and construction 122 50 114 50 83 38 84 37
Housing loans 119 11 118 12 106 12 103 12
General commerce 424 153 406 229 277 155 268 140
Transportation, storage &
communications 1,211 527 1,231 545 1,201 520 1,167 474
Financial institutions, investment &
holding companies 301 175 297 172 404 265 412 267
Professionals & private individuals
(excluding housing loans) 156 46 158 46 162 46 174 56
Others 79 33 70 34 42 26 78 44
Total non-performing loans 2,938 1,314 2,875 1,377 2,627 1,302 2,649 1,264
Debt securities 9 3 9 3 13 4 13 4
Contingent liabilities & others 107 48 82 48 86 49 173 65
Total non-performing assets 3,054 1,365 2,966 1,428 2,726 1,355 2,835 1,333 Note:
1/ Certain loans to investment holding companies have been reclassified to better reflect the underlying principal activity of the companies owned by the holding company. The amounts for prior periods have also been reclassified to conform to the current presentation.
By loan classification
($m) 30 Sept 2013 30 Jun 2013 31 Dec 2012 30 Sept 2012
NPA SP NPA SP NPA SP NPA SP
Non-performing assets
Substandard 1,846 305 1,620 260 1,405 268 1,519 284
Doubtful 863 715 983 805 752 518 947 680
Loss 345 345 363 363 569 569 369 369
Total 3,054 1,365 2,966 1,428 2,726 1,355 2,835 1,333
Restructured assets
Substandard 907 186 942 182 888 200 805 203
Doubtful 360 337 363 338 223 114 111 96
Loss 74 74 72 72 276 276 38 38
Total 1,341 597 1,377 592 1,387 590 954 337
By collateral type
($m) 30 Sept 2013 30 Jun 2013 31 Dec 2012 30 Sept 2012
NPA NPA NPA NPA
Unsecured non-performing assets 2,167 2,190 2,115 2,162
Secured non-performing assets by collateral type
Properties 377 343 269 330
Shares and debentures 228 145 58 62
Fixed deposits 35 27 32 34
Others 247 261 252 247
By period overdue
($m) 30 Sept 2013 30 Jun 2013 31 Dec 2012 30 Sept 2012
NPA NPA NPA NPA
Not overdue 1,292 1,244 1,245 877
<90 days overdue 232 249 297 360
91-180 days overdue 304 319 193 239
>180 days overdue 1,226 1,154 991 1,359
Total 3,054 2,966 2,726 2,835
The NPL rate was unchanged from the previous quarter at 1.2% while non-performing assets rose 3% to $3.05 billion.
CUSTOMER DEPOSITS 1/
($m) 30 Sept 2013 30 Jun 2013 31 Dec 2012 30 Sept 2012
By currency and product
Singapore dollar 136,024 138,947 131,000 129,199
Fixed deposits 18,984 21,190 19,501 20,310
Savings accounts 95,416 94,347 90,561 88,839
Current accounts 20,696 22,227 20,024 19,308
Others 928 1,183 914 742
Hong Kong dollar 27,084 25,584 25,730 22,729
Fixed deposits 16,310 15,897 15,690 12,694
Savings accounts 6,495 5,902 6,283 5,858
Current accounts 4,016 3,692 3,516 3,869
Others 263 93 241 308
US dollar 62,087 49,895 45,981 48,353
Fixed deposits 30,143 23,891 24,124 24,119
Savings accounts 5,991 4,666 4,256 4,422
Current accounts 17,644 16,319 15,332 15,620
Others 8,309 5,019 2,269 4,192
Others 45,016 46,971 40,196 39,897
Fixed deposits 35,917 37,379 32,644 32,589
Savings accounts 2,879 2,900 2,412 2,022
Current accounts 4,755 5,330 3,969 3,486
Others 1,465 1,362 1,171 1,800
Total 270,211 261,397 242,907 240,178
Fixed deposits 101,354 98,357 91,959 89,712
Savings accounts 110,781 107,815 103,512 101,141
Current accounts 47,111 47,568 42,841 42,283
Others 10,965 7,657 4,595 7,042
Note:
1/ Includes customer deposits classified as financial liabilities at fair value through profit or loss on the balance sheet
Customer deposits rose 3% from the previous quarter to $270 billion, led by US dollar deposits.
Customer deposits grew 13% from a year ago, with US dollar deposits accounting for half the growth. Deposits in Singapore dollars, Hong Kong dollars and other currencies were also higher.
DEBTS ISSUED
($m) 30 Sep 2013 30 Jun 2013 31 Dec 2012 30 Sep 2012
Subordinated term debts 5,528 5,532 5,505 5,507
Medium term notes 4,864 4,511 3,168 3,184
Commercial papers 15,976 14,186 5,820 9,013
Certificates of deposit 1/ 1,122 967 1,149 1,425
Other debt securities in issue 2/ 4,300 4,370 3,617 3,432
Total 31,790 29,566 19,259 22,561
Due within 1 year 17,976 16,458 8,498 11,836
Due after 1 year 13,814 13,108 10,761 10,725
Total 31,790 29,566 19,259 22,561
Notes:
VALUE AT RISK AND TRADING INCOME
The Group uses a Value at Risk (VaR) measure as one mechanism for monitoring and controlling trading risk. The VaR is calculated using a one-day time horizon and a 99% confidence interval.
Back-testing is a procedure used to verify the predictive power of the VaR calculations involving comparison of actual daily profits and losses adjusted with the estimates from the VaR model. There were no outliers in the back-testing for the period from 1 October 2012 to 30 September 2013 and the corresponding prior period.
The following table shows the period-end, average, high and low VaR for the trading risk exposure of the Group for the period from 1 October 2012 to 30 September 2013. The Group’s trading book VaR methodology is based on Historical Simulation VaR.
1 Oct 2012 to 30 Sept 2013
($m) As at 30 Sept 2013 Average High Low
Total 29 21 33 13
The chart below shows the histogram of VaR for the Group’s trading book for the period from 1 October 2012 to 30 September 2013.
0 20 40 60 80 100 120
<
=
15
>
15
-1
8
>
18
-2
1
>
21
-2
4
>
24
-2
7
>
27
-3
0
>
30
-3
3
No
.
of
D
ay
s
VaR (S$ million)
DBSH Group VaR for Trading Book
CAPITAL ADEQUACY
($m) 30 Sep 20131/ 30 Jun 20131/ 31 Dec 20121/ 30 Sep 20121/
Share capital 9,606 9,566
Disclosed reserves and others 23,120 22,979
Regulatory adjustments due to insufficient AT1 capital (1,289) (1,280)
CET1 31,437 31,265
AT1 capital instruments 3,746 3,746
Total regulatory adjustments to AT1 capital (3,746) (3,746)
Tier 1 capital 31,437 31,265 30,196 29,126
Provisions eligible as Tier 2 capital 1,267 1,287
Tier 2 capital instruments 4,955 4,955
Total regulatory adjustments to Tier 2 capital (1) (1)
Total capital 37,658 37,506 36,831 35,837
Credit risk 189,307 194,774 173,969 175,852
Market risk 32,066 33,480 27,827 27,416
Operational risk 14,740 14,503 13,795 13,628
Total risk-weighted assets 236,113 242,757 215,591 216,896
Capital Adequacy Ratio (“CAR”) (%)
CET1 13.3 12.9 NA NA
Tier 1 13.3 12.9 14.0 13.4
Total 15.9 15.5 17.1 16.5
Pro forma CET1 under final rules effective 1 Jan 2018 11.7 11.3 NA NA
Minimum CAR (%)
CET1 4.5 4.5 NA NA
Tier 1 6.0 6.0 6.0 6.0
Total 10.0 10.0 10.0 10.0
Key: CET1: Common Equity Tier 1; AT1: Additional Tier 1; NA: Not Applicable
Note:
1/ With effect from 1 January 2013, Basel III capital adequacy requirements came into effect in Singapore. Changes due to Basel III affected both eligible capital and risk-weighted assets. Capital adequacy disclosures relating to dates prior to 1 January 2013 are calculated in accordance with the then prevailing capital adequacy regulations and are thus not directly comparable to those pertaining to dates from 1 January 2013.
ADDITIONAL PILLAR 3 DISCLOSURES
The following disclosures are made pursuant to the Monetary Authority of Singapore’s Notice to Banks No. 637 “Notice on Risk Based Capital Adequacy Requirements for Banks incorporated in Singapore” (“Notice 637”).
Composition of Capital
The Composition of Capital disclosure forms part of the Notice 637 Pillar 3 disclosures. It shows a full reconciliation between the published balance sheet and the elements of regulatory capital.
Main Features of Capital Instruments
The main features of the Group’s regulatory capital instruments are disclosed using the template specified in MAS Notice 637 Table 11D-1.
The Composition of Capital and the Main Features of Capital Instruments will be published in the Financial Results, Supplements, and Regulatory Disclosures section of the Group website:
(http://www.dbs.com/investor/quarterlyresults/default.aspx)
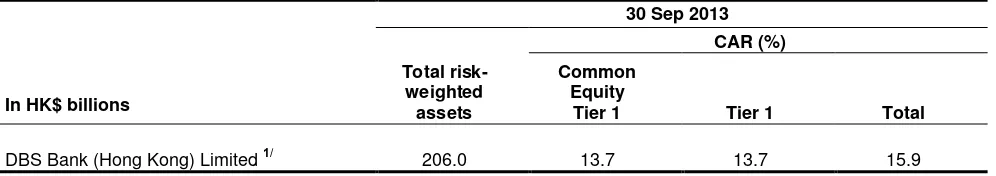
Capital Adequacy of Significant Banking Subsidiary
DBS Bank (Hong Kong) Limited is deemed to be a significant banking subsidiary for the purposes of Pillar 3 disclosures under Notice 637 paragraph 11.3.7.
30 Sep 2013 CAR (%)
In HK$ billions
Total risk-weighted assets
Common Equity
Tier 1 Tier 1 Total
DBS Bank (Hong Kong) Limited 1/ 206.0 13.7 13.7 15.9
Note:
1/ The capital adequacy ratios are calculated in accordance with the Banking (Capital) Rules issued by the Hong Kong Monetary Authority (HKMA). DBSHK uses the Internal Ratings-Based
(“IRB”) approach for the calculation of the risk-weighted assets for the majority of its credit risk exposures and the Standardised approach for those exempted from the IRB approach.
DBSHK uses the Standardised approaches for the calculation of risk-weighted assets for market risk and operational risk.
UNREALISED VALUATION SURPLUS
($m) 30 Sept 2013 30 Jun 2013 31 Dec 2012 30 Sept 2012
Properties 1/ 614 606 604 577
Financial investments classified as loans and
receivables 2/ 189 125 281 251
Total 803 731 885 828
Notes:
1/ Stated at cost less accumulated depreciation and impairment losses in the balance sheet 2/ Stated at cost less impairment losses in the balance sheet
Unaudited Consolidated Income Statement
NM Not Meaningful
Unaudited Consolidated Statement of Comprehensive Income
In $ millions
Foreign currency translation differences for foreign operations (115) (39) (>100) (29) (>100) (107) (84) (27)
Share of other comprehensive income of associates (11) (1) (>100) 5 NM (4) (8) 50
Available-for-sale financial assets and others
Net valuation taken to equity 75 203 (63) (557) NM (443) 521 NM
Unaudited Balance Sheets
Singapore Government securities and treasury bills 9,872 10,940 12,092 11,504
Due from banks 38,239 33,079 28,808 41,364
Unaudited Consolidated Statement of Changes in Equity
GROUP
In $ millions
Ordinary shares
Convertible preference shares
Treasury shares
Other reserves
Revenue
reserves Total
Non-controlling
interests Total equity
Balance at 1 January 2013 9,482 163 (103) 7,229 14,966 31,737 4,261 35,998
Purchase of Treasury shares (28) (28) (28)
Issue of shares upon exercise of share options 17 17 17
Reclassification of reserves upon exercise of
share options 4 (4) - -
Issuance of new shares pursuant to Scrip
Dividend Scheme 103 103 103
Cost of share-based payments 57 57 57
Draw-down of reserves upon vesting of
performance shares 37 (37) - -
Final dividends paid for previous year (684) (684) (684)
Interim dividends paid for current year (692) (692) (692)
Dividends paid to non-controlling interests - (103) (103)
Total comprehensive income (636) 2,699 2,063 158 2,221
Balance at 30 September 2013 9,606 163 (94) 6,609 16,289 32,573 4,316 36,889
Balance at 1 January 2012 9,101 249 (154) 7,075 12,523 28,794 4,275 33,069
Conversion of DBSH voting CPS and
Non-voting redeemable CPS to ordinary shares 86 (86) - -
Issue of shares upon exercise of share options 22 22 22
Reclassification of reserves upon exercise of
share options 2 (2) - -
Issuance of new shares pursuant to Scrip
Dividend Scheme 166 166 166
Shares distributable pursuant to Scrip Dividend
Scheme 102 102 102
Cost of share-based payments 53 53 53
Draw-down of reserves upon vesting of
performance shares 48 (48) - -
Final dividends paid for previous year (677) (677) (677)
Interim dividends paid for current year (687) (687) (687)
Dividends paid to non-controlling interests - (109) (109)
Total comprehensive income 157 2,599 2,756 145 2,901
Balance at 30 September 2012 9,479 163 (106) 7,235 13,758 30,529 4,311 34,840
Unaudited Statement of Changes in Equity
COMPANY
In $ millions Ordinary shares
Convertible preference shares
Treasury shares
Other reserves
Revenue
reserves Total equity
Balance at 1 January 2013 9,482 163 (71) 101 1,476 11,151
Purchase of Treasury shares (28) (28)
Transfer of Treasury shares 33 33
Draw-down of reserves upon vesting of performance shares (37) (37)
Issue of shares upon exercise of share options 17 17
Reclassification of reserves upon exercise of share options 4 (4) -
Cost of share-based payments 57 57
Issuance of new shares pursuant to Scrip Dividend Scheme 103 103
Final dividends paid for previous year (684) (684)
Interim dividends paid for current year (692) (692)
Total comprehensive income 1,794 1,794
Balance at 30 September 2013 9,606 163 (66) 117 1,894 11,714
Balance at 1 January 2012 9,101 249 (115) 86 1,648 10,969
Conversion of DBSH Non-voting CPS and Non-voting
redeemable CPS to ordinary shares 86 (86) -
Transfer of Treasury shares 44 44
Draw-down of reserves upon vesting of performance shares (48) (48)
Issue of shares upon exercise of share options 22 22
Reclassification of reserves upon exercise of share options 2 (2) -
Cost of share-based payments 53 53
Issuance of new shares pursuant to Scrip Dividend Scheme 166 166
Shares distributable pursuant to Scrip Dividend Scheme 102 102
Final dividends paid for previous year (677) (677)
Interim dividends paid for current year (687) (687)
Total comprehensive income (5) (5)
Balance at 30 September 2012 9,479 163 (71) 89 279 9,939
Unaudited Consolidated Cash Flow Statement
In $ millions
9 Mths 2013
9 Mths 2012
Cash flows from operating activities
Net profit for the year 2,854 2,756
Adjustments for non-cash items:
Allowances for credit and other losses 619 303
Depreciation of properties and other fixed assets 160 126
Share of profits of associates (66) (103)
Net gain on disposal (net of write-off) of properties and other fixed assets (44) (8)
Net income from financial investments (194) (316)
Income tax expense 481 478
Profit before changes in operating assets & liabilities 3,810 3,236
Increase/(Decrease) in:
Due to banks 2,675 517
Due to non-bank customers 27,491 17,491
Financial liabilities at fair value through profit or loss 1,645 (871)
Other liabilities including bills payable 3,070 (2,770)
Debt securities and borrowings 12,365 3,148
Decrease/(Increase) in:
Restricted balances with central banks (890) (267)
Singapore Government securities and treasury bills 2,220 999
Due from banks (9,431) (15,787)
Financial assets at fair value through profit or loss (3,419) (804)
Loans and advances to customers (31,540) (7,451)
Financial investments (730) (2,435)
Other assets (4,109) (298)
Tax paid (340) (360)
Net cash generated from/(used in) operating activities (1) 2,817 (5,652)
Cash flows from investing activities
Acquisition of interest in associates (2) (12)
Dividends from associates 36 74
Purchase of properties and other fixed assets (155) (184)
Proceeds from disposal of properties and other fixed assets 61 31
Net cash used in investing activities (2) (60) (91)
Cash flows from financing activities
Increase in share capital 124 292
Payment upon maturity of subordinated term debts - (2,575)
Issue of subordinated term debts - 2,943
Purchase of treasury shares (28) -
Dividends paid to shareholders of the Company (1,376) (1,364)
Dividends paid to non-controlling interests (103) (109)
Net cash used in financing activities (3) (1,383) (813)
Exchange translation adjustments (4) (110) (72)
Net change in cash and cash equivalents (1)+(2)+(3)+(4) 1,264 (6,628)
Cash and cash equivalents at 1 January 10,993 18,891
Additional Information
ISSUANCE OF ORDINARY SHARES
(a) The movement in the number of issued and fully paid-up ordinary shares is as follows:
Number of shares
Ordinary shares 2013 2012
Balance at 1 January 2,442,028,426 2,350,317,632
Shares issued on conversion of Preference shares - 70,026,649
Shares issued pursuant to Scrip Dividend Scheme 3,654,789 12,668,158 Shares issued on exercise of share options pursuant to the DBSH
Share Option Plan 1,577,827 1,621,301
As at 30 June 2,447,261,042 2,434,633,740
Shares issued pursuant to Scrip Dividend Scheme 2,341,561 -
Shares issued on exercise of share options pursuant to the DBSH
Share Option Plan 22,796 267,734
Balance at 30 September [a] 2,449,625,399 2,434,901,474
Treasury shares held by DBSH
Balance at 1 January 5,344,000 8,644,000
Shares transferred to trust holding shares pursuant to DBSH Share
Plan / DBSH Employee Share Plan (2,500,000) (3,300,000)
Purchase of Treasury Shares 1,300,000 -
As at 30 June 4,144,000 5,344,000
Purchase of Treasury Shares 500,000 -
Balance at 30 September [b] 4,644,000 5,344,000
Ordinary shares net of treasury shares [a] – [b] 2,444,981,399 2,429,557,474
(b) New ordinary shares that would have been issued on conversion of preference shares and exercise of share options are as follows:
(Number) 30 Sept 2013 30 Sept 2012
Conversion of non-voting redeemable CPS 30,011,421 30,011,421
Exercise of share options 1,537,986 3,470,831
Weighted average number of shares for 9 Mths
- ordinary shares 2,439,927,040 2,411,160,328
- fully diluted 2,470,263,113 2,441,834,244
The fully diluted shares took into account the effect of a full conversion of non-voting redeemable convertible preference shares and the exercise of all outstanding share options granted to employees when such shares would be issued to a price lower than the average share price during the period.
INTERESTED PERSON TRANSACTIONS
SELECTED NOTES TO THE INTERIM FINANCIAL STATEMENTS
Theinterim financial information should be read in conjunction with the audited financial statements included in the Group’s Annual Report 2012.
The disclosures on Fair Value of Financial Instruments and Offsetting Financial Assets and Financial Liabilities are made pursuant to the new or revised FRSs (refer to page 2 for more information)
1.
Fair Value of Financial Instruments
The valuation process and fair value hierarchy policies applied for the current financial period are consistent with those disclosed for the financial year ended 31 December 2012.
Portfolio Measurement
Portfolios of financial assets and liabilities are revalued on the basis of market mid prices, with adjustment to reflect the cost of closing out the net positions, per location, by accounting classification.
Fair Value Hierarchy
The fair value hierarchy accords the highest level to observable inputs such as unadjusted quoted prices in active markets for identical assets or liabilities and the lowest level to unobservable inputs. The fair value measurement of each financial instrument is categorised in accordance to the same level of the fair value hierarchy as the input with the lowest level that is significant to the entire measurement. If unobservable inputs are deemed as significant, the financial instrument will be categorised as Level 3.
Financial instruments that are valued using quoted prices in active markets are classified as Level 1 of the valuation hierarchy. These would include government and sovereign securities, listed equities and corporate debt securities which are actively traded. Derivatives contracts which are traded in an active exchange market are also classified as Level 1 of the valuation hierarchy.
Where fair value is determined using quoted market prices in less active markets or quoted prices for similar assets and liabilities, such instruments are generally classified as Level 2. In cases where quoted prices are generally not available, the Group will determine the fair value based on valuation techniques that use market parameters as inputs including but not limited to yield curves, volatilities and foreign exchange rates. The majority of valuation techniques employ only observable market data and so reliability of the fair value measurement is high. These would include corporate debt securities, repurchase, reverse repurchase agreements and most of the Group’s over-the-counter derivatives.
The Group classifies financial instruments as Level 3 when there is reliance on unobservable inputs to the valuation model attributing to a significant contribution to the instrument value. These would include all input parameters which are derived from historical data such as correlation or volatilities as well as unquoted equity securities. The fair value of unquoted equity securities is measured in comparison with recent transactions in the equity of the company in question or comparable companies in similar industries. Level 3 inputs also include all quoted security prices that have not been updated for more than 3 months, quoted proxies in active markets for non-similar asset classes (e.g. bonds marked over credit default swap spreads), as well as prices/valuations that are obtained from counterparties. Valuation reserves or pricing adjustments where applicable will be used to converge to fair value.
The following table presents assets and liabilities measured at fair value according to the fair value hierarchy: 30 Sept 2013
The Group
In $ millions Level 1 Level 2 Level 3 Total
Assets
Singapore Government securities and treasury bills(a) 9,747 - - 9,747 Financial assets at fair value through profit or loss(b) 9,000 5,407 552 14,959 Available-for-sale financial investments(c) 22,023 7,878 160 30,061 Securities pledged and transferred (a) 4,573 408 - 4,981 Positive fair values for financial derivatives 39 17,149 15 17,203
The Group
(a) Includes securities classified as available-for-sale and at fair value through profit or loss
(b) Includes other government securities, corporate debt securities, equity securities and other financial assets at fair value through profit or loss
(c) Includes available-for-sale financial investments and other financial assets classified as available-for-sale. Excludes unquoted equities stated at cost of
$255 million
(d) Includes debt securities in issue, due to non-bank customers (structured investments) and other financial liabilities at fair value through profit or loss
During the period, the Group transferred financial assets and liabilities consisting primarily corporate bonds of $231 million from Level 1 to Level 2 due to reduced market activity for these financial instruments.
The Group’s policy is to recognise transfers between the levels of the fair value hierarchy as at the end of the reporting period during which the change occurred.
The following table presents the changes in Level 3 instruments for the financial period ended:
In $ millions At 1
January
Fair value gains or losses
Financial assets at fair value through profit or loss
97 (2) - 469 - (12) - - 552
Financial liabilities at fair value through profit or loss
26 - - - - (4) - (1) 21
Negative fair values for financial derivatives
11 - - - (11) -
Total 37 - - - - (4) - (12) 21
Gain and losses on financial assets and liabilities measured at fair value
In $ millions Category reported in the Income Statement
9 Mths 2013 Net trading Income Net income from
financial investments
Total
Total gains or losses for the period included in profit or loss - 6 6
Of Which:
Change in unrealized gains or losses for the period included in profit or loss for assets held at the end of the reporting period
- - -
Effect of changes in significant unobservable assumptions to reasonably possible alternatives
As at 30 September 2013, financial instruments measured with valuation techniques using significant unobservable inputs (Level 3) included unquoted equity investments, corporate debt securities, equity, interest rate and credit derivatives and financial liabilities from structured product issuances.
There are limited inter-relationships between unobservable inputs as the financial instruments are usually categorised into Level 3 because of a single unobservable input.
In estimating significance, the Group performed sensitivity analysis based on methodologies applied for fair value adjustments. These adjustments reflect the values which the Group estimates to be appropriate to reflect uncertainties in the inputs used (e.g. based on stress testing methodologies on the unobservable input). The methodologies used can be statistical or based on other relevant approved techniques.
The movement in fair value arising from reasonably possible changes to the valuation assumptions is assessed as not significant.
In $ millions Fair Value at
30 Sep 2013
Classification Valuation technique Unobservable Input
Assets
Corporate debt securities 552 FVPL(a) Discounted Cash Flows Credit spreads Corporate debt securities 26 AFS(b) Discounted Cash Flows Credit spreads
Equity securities (Unquoted) 134 AFS(b) Net Asset Value Net asset
value of securities
Positive fair values for financial
derivatives 15 FVPL
(a) CDS models / Option & interest rate pricing model
Credit spreads / Correlations/ Basis Volatility
Total 727
Liabilities
Other debt securities in issue 21 FVPL(a) Discounted Cash Flows Credit spreads
Total 21
(a) FVPL denotes financial instruments classified as fair value through profit or loss (b) AFS denotes financial instruments classified as available-for-sale
Financial assets and liabilities not carried at fair value
Unquoted equities of $255 million as at 30 September 2013 were stated at cost less accumulated impairment losses because the fair value cannot be reliably estimated using valuation techniques supported by observable market data. The Group intends to dispose of such instruments through public listing or trade sale.
2.
Offsetting Financial Assets and Financial Liabilities
Financial assets and liabilities are presented net when there is a legally enforceable right to set off the recognised amounts, and there is intention to settle them on a net basis or to realise the asset and settle the liability simultaneously.
Financial assets and liabilities offset on the balance sheet
As at 30 September 2013, “Loans and advances to customers” of $2,272 million (31 December 2012: $3,710 million) were set off against “Due to non-bank customers” of $2,348 million (31 December 2012: $3,734 million) because contractually the Group has a legally enforceable right to set off these amounts, and intends to settle the loans and the deposits simultaneous ly at maturity or termination dates. This resulted in a net amount of $76 million being reported under “Due to non-bank customers” as at 30 September 2013 (31 December 2012: $24 million).
Financial assets and liabilities subject to netting agreement but not offset on the balance sheet
The Group enters into master netting arrangements with counterparties where it is appropriate and feasible to do so to mitigate counterparty risk. The credit risk associated with favourable contracts is reduced by a master netting arrangement to the extent that if an event of default occurs, all amounts with the counterparty are settled on a net basis. Master netting arrangements do not result in an offset of financial assets and liabilities on the balance sheet, as the legal right to set off the transactions is conditional upon default.
These agreements include derivative master agreements (including the International Swaps and Derivatives Association (ISDA) Master Agreement), global master repurchase agreements and global securities lending agreements. The collaterals received and posted under these agreements are generally conducted under terms that are in accordance with normal market practice. In these agreements, the counterparty is typically allowed to sell or repledge those non-cash collaterals (i.e. securities) lent or transferred, but has an obligation to return the securities at maturity. If the securities decrease in value, the Group may, in certain circumstances, be required to pay additional cash collateral, and typically the counterparty has recourse only to the securities. Please refer to the Risk Management section of the Group’s 2012 Annual Report for further details around the impact of a downgrade of the Group on its requirement to post more collateral.
In addition, the Group receives cash and other collaterals such as marketable securities to reduce its credit exposure. The Group also engages in a variety of counterparty credit mitigation strategies in addition to netting and collateral arrangements. The Risk Management section of the Group’s 2012 Annual Report explains the use of such credit risk mitigants.
30 Sept 2013
In $ millions
Types of financial assets/liabilities
Carrying amounts on
balance sheet
(A)
Financial instruments not in scope of offsetting
disclosures (B)
Gross recognised financial instruments in
scope (A - B= C + D +E)
Related amounts not set off on balance sheet
Net amounts in scope
(E) Financial
instruments (C)
Cash collateral received/ pledged
(D) Financial Assets
Positive fair values for financial derivatives
17,203(a) 7,370(b) 9,833 9,157(b) 429 247
Reverse repurchase agreements
4,889(c) 707 4,182 4,182 - -
Securities borrowings
31(d)
- 31 31 - -
Total 22,123 8,077 14,046 13,370 429 247
Financial Liabilities
Negative fair values for financial derivatives
17,101(a) 5,896(b) 11,205 9,143(b) 1,465 597
Repurchase agreements
4,324(e)
758 3,566 3,566 - -
Securities lendings -(f) - - - - -