Styrene and Azo-Styrene Based Colorimetric Sensors
for Highly Selective Detection of Cyanide
Agustina Eka Prestiani
*and Bambang Purwono
Department of Chemistry, Faculty of Mathematics and Natural Sciences, Universitas Gadjah Mada Sekip Utara PO BOX BLS 21 Yogyakarta 55281, Indonesia
Received May 9, 2017; Accepted July 17, 2017
ABSTRACT
A novel styrene (1) and azo-styrene(2)based chemosensor from vanillin has been successfully synthesized. Sensor 1 was obtained via one step Knoevenagel condensation using Ultrasound method and sensor 2 was afforded via azo coupling and Knoevenagel condensation reactions. Both of sensors showed high sensitivity and selectivity to detect CN-in aqueous media, even in the presence of other anions, such as F-, Cl-, Br-, I-, CO
32-, SO42-,
H2PO4-, and AcO-. Colorimetric sensing of sensor1 was due to the deprotonation of sensor binding site (-OH) by
cyanide anion. It consequently improved the selectivity and sensitivity in sensing cyanide which was observed by the color change of sensor from yellowness to red-purple and then purple in 1 min. Sensor2 exhibited chemodosimeter phenomenon which is caused by the nucleophilic addition of cyanide and gave color change from green to greenish-blue. The results enable to detect an detection by naked eye.
Keywords:colorimetric chemosensor; styrene; azo-styrene; cyanide
ABSTRAK
Sintesis senyawa turunan stirena (1) dan azo-stirena (2) dari vanilin telah berhasil dikembangkan sebagai kemosensor anion. Sensor 1 diperoleh dari reaksi kondensasi Knoevenagel, sedangkan sensor 2 diperoleh dari reaksi kopling diazo dan kondensasi Knoevenagel. Uji aktivitas senyawa1dan2dilakukan pada anion F-, Cl-, Br-, I-,
CO32-, SO42-, H2PO4-, CN-, and AcO-. Hasil penelitian menunjukkan bahwa sensor1 dan2memiliki sensitivitas dan
selektivitas terhadap anion CN-yang memberikan perubahan warna dari kekuningan menjadi merah-ungu kemudian
ungu dalam waktu 1 menit, sementara sensor 2menghasilkan perubahan warna dari hijau menjadi biru-kehijauan. Perubahan warna pada sensor 1 disebabkan oleh deprotonasi anion CN- pada sisi ikat –OH, sedangkan pada
sensor2perubahan warna terjadi dikarenakan adisi nukleofilik oleh anion sianida yang ditunjukkan dari spektra UV-vis mengalami pergeseran hipsokromik. Proses deteksi anion pada sensor1 dan2menghasilkan perubahan warna yang dapat diamati secara kasat mata, sehingga mempermudah deteksi anion.
Kata Kunci:kolorimetri; stirena; azo-stirena; anion sianida
INTRODUCTION
The recognition and sensing of anions are the growing interest area in supramolecular chemistry due to its important role in a wide range of chemical, biological, environmental, and industrial applications [1]. Among the various anions (i.e. fluoride, chloride, acetate, and phosphate), cyanide (CN-) ion gained great interest because of its lethal effect on living organisms and environment [2]. Nevertheless, CN- is widespread in an industrial process, such as gold mining, electroplating, metallurgy, and the synthesis of nylon, fibers, and resins which have resulted in severe pollution of water supplies [3]. Cyanides also do harm to human beings by absorption through the lungs, gastrointestinal tract and skin, leading to vomiting, convulsions, loss of consciousness, and eventual death [4]. Therefore, highly
selective and sensitive probes for the cyanide anion are of considerable interest due to their application to environmental and the pathological imaging of the anions [5].
amide, indocarbazole, imidazolium, urea, thiourea, hydrazone, pyrrole [8].
Currently, many excellent anion chemosensors have been reported with high selectivity and sensitivity. However, there are disadvantageous due to the complicated structure of those chemosensors, requiring of hard synthetic routes or troubling in the purification process and give poor yield. Shao et al. have reported naked eye and fluorogenic detection of cyanide using urea-coumarin derivates based on intramolecular charge transfer (ICT) which is not easy to synthesize and merely showed selective response only in the presence of acetate ion [8]. Velmathy et al. also have reported fluorogenic and chromogenic heterocyclic pyrrole derivates to recognized CN- ion which is also showed complicated compound to synthesize [9].
Colorimetric anion sensor design, with high sensitivity and selectivity that both easy to synthesize and to recognize by the naked eye, become a new challenge. In this research, we have developed styrene
1 and azo-styrene 2 derivatives from vanillin via Knoevenagel condensation that were synthesized using ultrasound method [10]. Vanillin was used as starting material because it has a hydroxyl group as a binding site and aldehyde group which can be modified as a signalling unit. In this project, sensor1contained styrene group that bind nitro group and sensor 2 was synthesized as the modification of sensor 1. In addition, the nitro group as chromophore unit can increase the ability of the sensor to bind with anions. Azo group was added to sensor 2 as chromophore unit because it can extend delocalization and increase the ability to recognize anion by the naked eye. This result will give high selectivity of anion sensors.
EXPERIMENTAL SECTION
Materials
Vanillin, nitromethane, glacial acetic acid, ammonium acetate, p-nitroaniline, hydrochloric acid, aquadest, sodium azide, sodium nitrite, ethanol, methanol, dimethyl sulfoxide (DMSO), acetone, sodium fluoride, sodium bromide, sodium chloride, sodium iodide, sodium carbonate, sodium sulphate, sodium dihydrogen phosphate, sodium cyanide, and sodium acetate. All reagents in analytical grade were obtained from E Merck Co Inc. (Germany) and were used without further purification.
Instrumentation
In general, the melting point of the compounds was determined using melting point electrothermal 9100.. Synthesis was performed by using Ultrasound Bruder
1200. FTIR spectra were recorded using Shimadzu Prestige-21 instrument use KBr pellet. GC-MS were recorded using Shimadzu QP2010S. The 1H-NMR and 13C-NMR spectra were recorded from Nuclear Magnetic Resonance Spectrometer (JEOL-MY500). UV-vis spectra were recorded with Shimadzu UV-1800 Eng 240 V spectrophotometer with a quartz cuvette (path length = 1 cm) at room temperature (r.t). For all spectroscopic titration, 5×10⁻⁵ M concentrations were prepared in DMSO and saturated anions were prepared in aqueous medium.
Procedure
Synthesis and characterization of sensor 1
Sensor 1 was synthesized via ultrasound methods. Into mixture of nitromethane (6.50 mL) and ammonium acetate (1.65 g) was added to a mixture of glacial acetic acid (1.65 mL) and vanillin (1.52 g, 10 mmol) then sonicated at room temperature for 2 h. The precipitate was filtered followed by washing with aquadest then dried. The product was purified by recrystallization from methanol Sensor 1 was obtained as a orange solid in 70.87%, m.p. 166.2 °C; FT-IR (KBr) (cm-1): 3471 (-OH group), 1604 (C=C alkyne), 1519 (C=C aromatic), 1489 and 1288 (-NO2 group), 1126 and 1018 (-C-O-C), 954 (-C=C trans), m/z [M+]: 195.
Synthesis and characterization of sensor 2
Sensor 2was synthesized via coupling diazo and Knoevenagel condensation reactions by ultrasound method.
Azo coupling. Into solution of hydrochloric acid 37% (7.40 mL, 75 mmol) and aquadest (7.40 mL) was added p-nitroaniline (3.45 g, 25 mmol). The mixture was stirred in 0-5 °C. To the stirred solution was added solution of sodium nitrite (2.10 g, 30 mmol) in 10 mL aquadest. The mixture was stirred for 1 h in 0-5 °C. The product was solution of benzene diazonium chloride. Into a solution of sodium carbonate (10 g) and aquadest (75 mL) was added vanillin (3.80 g, 25 mmol). The mixture was cooled at 0-5 °C. Into benzene diazonium chloride solution was added vanillin solution drops for 1 h and stirred the mixture for 4 h. The precipitate was neutralized by hydrochloride acid solution 10% then was filtered followed by washing with aquadest then was dried to give the desired compound as brown solid. The crude was purified by recrystallization with ethanol. FTIR (KBr) v (cm-1) 3448 (OH group), 3109 (Csp2-H), 1689 (C=O), 1604 (C=C aromatic), 1519 and 1342 (-NO2), 1427 (-N=N), 1280 and 1137 (C-O-C).
HO
Vanillin Nitromethane Sensor 1
HO
Vanillin p-Nitrobenzenediazonium chloride Azo-vanillin
+ CH3 NO2
Azo-vanillin Nitromethane Sensor2
O2N
and glacial acetic acid (1.70 mL) was added azo-vanillin (0.37 g, 1.25 mmol). The reaction mixture was sonicated at room temperature for 3 h. The precipitate was filtered followed by washing with aquadest then dried. The product was purified by recrystallization from methanol as brown powder in 81.40%, m.p. 218; FTIR (KBr) v (cm -139.19 (Ar1-C), 139.53 (C=C), 148.34 (C=C),150.19 (Ar2-C-NO2), 151.07 (Ar1-C-OMe), 154.93 (Ar2-C-N=N).
Study activities solvatochromic and ionochromic of sensor 1 and 2
Solvatochromic experiment.As much as 2 mL solution of the sensor1 and 2 in DMSO were prepared and the colour change was observed, then UV-vis spectra were measured in concentration of 5.0×10⁻⁵M.
Ionochromic experiment.All titration experiments were carried out at room temperature, unless otherwise mentioned. UV-vis spectra was measured using a Shimadzu UV-1800 Eng 240 V spectrophotometer. As much as of 2 mL, 5.0×10⁻⁵ M solution of the sensor 1 and 2 in DMSO and solutions of saturated salt anions
were prepared in aquadest. Into 2 mL of sensor1 and
2 was added three drops of anions. These solutions were used for all spectroscopic studies after appropriate dilution.
LoD calculation
Sensor 1. Based on Table 2 standar deviation value = 0.00427 and Fig.13, slope value (m) = 1.375, so limit of detection (LOD) sensor 1:
LOD = 3σ/m
= 3 (0.00427)/1.375 = 9.316 × 10⁻³M
Sensor 2. Based on Table 4 standar deviation value = 0.10215 and Fig.16, slope value (m) = 22.199, so limit of detection (LOD) sensor 2:
LOD = 3σ/m
= 3 (0.10215)/ 22.199 = 1.370 × 10⁻²M
RESULT AND DISCUSSION
Synthesis of Sensor 1
Vanillin contains aldehyde group which can be modified as styrene group via Knoevenagel condensation that binds nitro group. This reaction was occurred in the presence of ammonium acetate and glacial acetic acid as catalyst without solvent (Scheme 1). Ammonium acetate will deprotonate nitromethane
Scheme 1.Synthesis of sensor1from vanillin
Scheme 2.Synthesis of azo-vanillin via coupling diazo
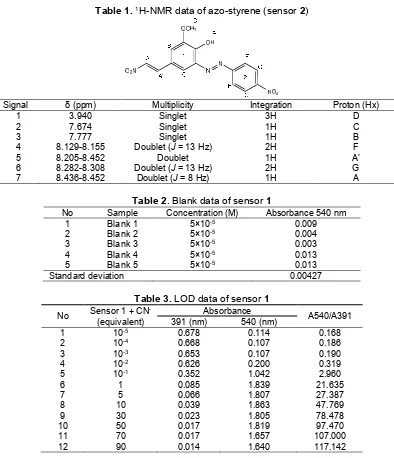
Table 1.1H-NMR data of azo-styrene (sensor2)
Signal δ (ppm) Multiplicity Integration Proton (Hx)
1 3.940 Singlet 3H D
2 7.674 Singlet 1H C
3 7.777 Singlet 1H B
4 8.129-8.155 Doublet (J= 13 Hz) 2H F
5 8.205-8.452 Doublet 1H A’
6 8.282-8.308 Doublet (J= 13 Hz) 2H G
7 8.436-8.452 Doublet (J= 8 Hz) 1H A
Table 2. Blank data of sensor1
No Sample Concentration (M) Absorbance 540 nm
1 Blank 1 5×10⁻⁵ 0.009
2 Blank 2 5×10⁻⁵ 0.004
3 Blank 3 5×10⁻⁵ 0.003
4 Blank 4 5×10⁻⁵ 0.013
5 Blank 5 5×10⁻⁵ 0.013
Standard deviation 0.00427
Table 3.LOD data of sensor1
No Sensor 1 + CN
-(equivalent)
Absorbance
A540/A391
391 (nm) 540 (nm)
1 10-5 0.678 0.114 0.168
2 10-4 0.668 0.107 0.186
3 10-3 0.653 0.107 0.190
4 10-2 0.626 0.200 0.319
5 10-1 0.352 1.042 2.960
6 1 0.085 1.839 21.635
7 5 0.066 1.807 27.387
8 10 0.039 1.863 47.769
9 30 0.023 1.805 78.478
10 50 0.017 1.819 97.470
11 70 0.017 1.657 107.000
12 90 0.014 1.640 117.142
become nucleophile because nitromethane is stable compound, so it needs to be changed become more active. Glacial acetic acid plays as a catalyst in this reaction.
The reaction process was observed and monitored by TLC with eluent ratio of ethyl acetate:n-hexane = 1:3. The product of this reaction was ((E)-2-methoxy-4-(2-nitrovinyl)phenol (1) that obtained as orange powder in 70.87% yield and melting point of 166.2 °C. Structural determination of the product was based on FTIR and GC-MS studies. The FTIR spectrum showed several peaks of -OH, -OCH3, -NO2, C-H aromatic, C=C aromatic, C=C alkyne, Csp2-H aliphatic, and Csp3-aliphatic groups. The most important information from the FTIR spectrum was the absence of aldehyde group signal at
1666 cm-1for the starting material of vanillin. Besides, the presence of styrene group signal at 1604 cm-1and nitro group signals with sharp twin peaks at 1489 and 1288 cm-1.
Synthesis of Sensor 2
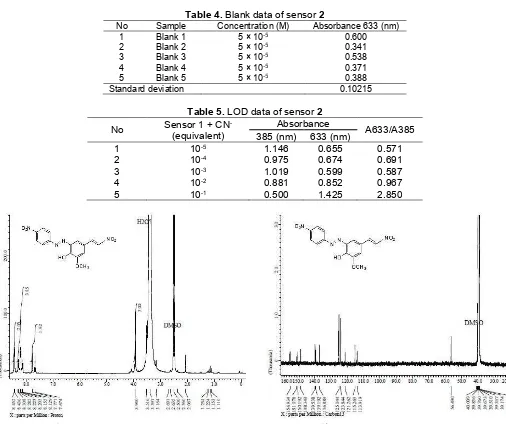
Table 4.Blank data of sensor2
No Sample Concentration (M) Absorbance 633 (nm)
1 Blank 1 5 × 10⁻⁵ 0.600
2 Blank 2 5 × 10⁻⁵ 0.341
3 Blank 3 5 × 10⁻⁵ 0.538
4 Blank 4 5 × 10⁻⁵ 0.371
5 Blank 5 5 × 10⁻⁵ 0.388
Standard deviation 0.10215
Table 5.LOD data of sensor2
No Sensor 1 + CN
-(equivalent)
Absorbance
A633/A385 385 (nm) 633 (nm)
1 10-5 1.146 0.655 0.571
2 10-4 0.975 0.674 0.691
3 10-3 1.019 0.599 0.587
4 10-2 0.881 0.852 0.967
5 10-1 0.500 1.425 2.850
Fig 1.1H-NMR spectrum of azo-styrene (2) Fig 2.13C-NMR spectrum of azo-styrene (2)
therefore, it can easily react with benzenediazonium ion. This reaction process was observed and monitored by TLC with eluent ratio of ethyl acetate:n-hexane = 2:3. The product of this reaction was ((E)-1-(4- hydroxy-3-methoxy-5-((4-nitrophenyl)diazenyl)-phenyl-ethan-1-on(2) that was obtained as brown powder in 68.22% yield with melting point 231.2-232.8 °C. Structural determination of the product was made on the basis of FTIR and GC-MS studies. The FTIR spectrum of this compound showed many peaks consists of OH, -NO2, azo (N=N), -OCH3, C=O, C-H aromatic and C=C aromatic groups. The most important information of FTIR spectrum is the presence of azo group signal at 1427 cm-1 which indicated the product of azo-vanillin was generated.
Azo-styrene compound (sensor2) can be obtained via Knoevenagel condensation reaction between
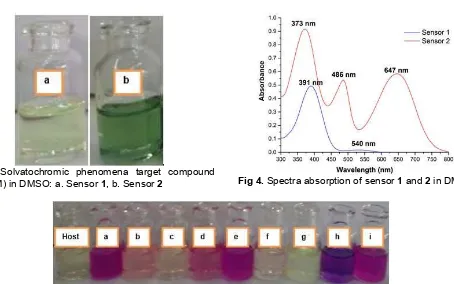
Fig 3. Solvatochromic phenomena target compound
(5×10⁻³M) in DMSO: a. Sensor1, b. Sensor2 Fig 4.Spectra absorption of sensor1and2in DMSO
Fig 5.Color change of sensor1in DMSO (5×10⁻⁵M): a. F-, b. Cl-, c. Br-, d. I-, e. CO
32-, f. SO42-, g. H2PO4-, h. CN-, i. AcO
-Fig 6. Color change of sensor2in DMSO (5×10⁻⁵): a. F-, b. Cl-, c. Br-, d. I-, e. CO32-, f. SO42-, g. H2PO4-, h. CN-, i. AcO
-In the 1H-NMR spectrum (Fig. 1) displayed seven peaks that is interpreted in Table 1. The clear evidence for the azo-styrene product was given by 13C-NMR spectrum (Fig. 2) in which typical signal corresponding to styrene carbon (-C=C-NO2) and (Ar1 -C=C-) appeared at 139.53 ppm and 148.34 ppm, respectively. MS (m/z): 344 [M+].
Study Activities Solvatochromic and Ionochromic of Sensor 1 and 2
Solvatochromic experiment
Solvatochromic phenomena of sensor 1 and 2 in DMSO are shown in Fig. 3 and absorpstion spectra are shown in Fig. 4. Based on Fig. 3 and 4, there is a relationship between color change of sensors and UV-vis absorption spectra. DMSO gives sharper color in sensor2than sensor1. Color of sensor1was yellowish,
whereas that of sensor 2 was green. This result was confirmed by UV-vis spectrophotometer [11-12].
Based on Fig. 4, there are two kind electron transition of sensor 1 and 2 that is n→π* and π→π*. Sensor 2has a maximum wavelength at 373, 486 and 647 nm meanwhile sensor1only has 391 and 540 nm. Sensor 2 showed more significant bathochromic shift than sensor 1 because it has long electron delocalization probably caused by presence of azo group and two nitro group as chromogenic unit, so sensor2shows sharp color than sensor1.
Ionochromic experiments
H3CO
O
N O O
H
CN
-H3CO
O
N O O
-HCN
H3CO
O
N O O
O2N
N N
HO
OCH3
N O
O O2N
N N
HO
OCH3
N O O CN CN
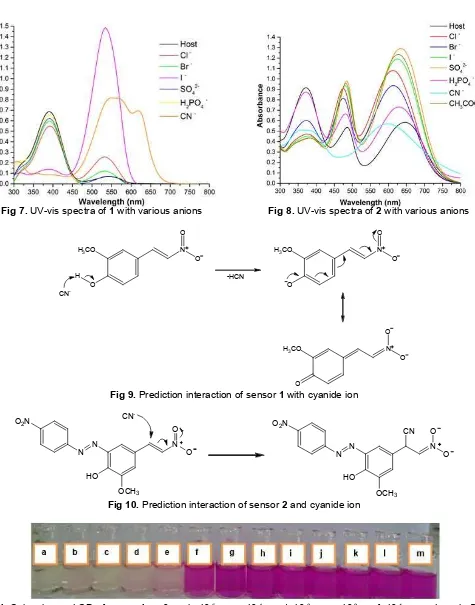
-Fig 7.UV-vis spectra of1with various anions Fig 8.UV-vis spectra of2with various anions
Fig 9.Prediction interaction of sensor1with cyanide ion
Fig 10.Prediction interaction of sensor2and cyanide ion
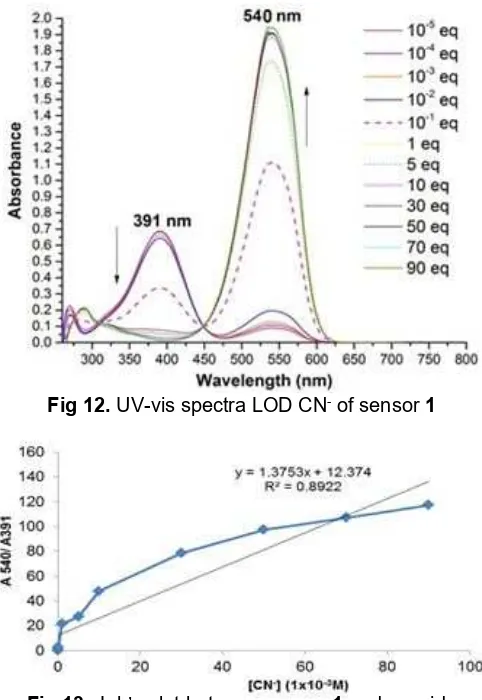
Fig 12.UV-vis spectra LOD CN-of sensor1
Fig 13.Job’s plot between sensor1and cyanide
Fig 14. Color change LOD of sensor 2; a. 0 eq, b.10-5 eq, c. 10-4eq, d.10-3eq, e.10-2eq, f.10-1eq
The addition of three drops saturated salt anions of F-, SO
42-, CO32-, and AcO- into 2 mL of1 gave red shift (bathochromic) spectra with different intensity, whereas Cl-, Br-, I-, and H2PO4, did not show any significant change. Cyanide anion gave different result where the absorption band at 391 nm (ICT) completely disappeared and new absorption was shown in 620 nm. It was due to cyanide deprotonation, therefore gave bathochromic shift. Basicity of cyanide ion was the highest than others in this experiment, so it can deprotonate binding site of sensor 1 that showed
different color change. Prediction of interaction sensor
1 with cyanide ion is shown Fig. 9. Anions F-, CO 32-, and CH3COO- have same change color that was red-purple, its probably caused by similar basicity. Prediction interaction that occurs between these anions and binding site of sensor 1 is hydrogen bonding. The presence of the other anions (Cl-, Br-, I-, SO42-) gave a similiar color change but I- ion showed intensity higher than others.
Limit of detection (LOD) cyanide ion in sensor 1
was measured by 3σ/m in DMSO through the UV-vis
titration experiment [13-15]. Color change and UV-vis spectra are shown Fig. 11 and 12 respectively. The appearance of a distinct isosbestic point at 448 nm during the titration process indicates host-guest complexation equilibrium. The standar deviation of absorbance of sensor1without CN- was obtained as σ = 0.00427 (n = 5). The absorbance at 391 nm and 540 nm were measured by incremental addition of CN -to sensor1in various concentration, the slope of which gave m = 1.375. The UV-vis titration experiments of sensor 1 revealed that the LOD of CN- was 9.316 x 10⁻³ M at 3σ/m. Limit of detection (LOD) plot between sensor1and cyanide is shown in Fig. 13.
Sensor 2 gave similar color changes were seen when F-, Cl-, Br-, I-, CO32-, SO42-, CH3COO-were added that is shown in Fig. 6. In addition, cyanide and dihydrogen phosphate gave different response. Cyanide gave color change green to greenish-blue and no significant color change when dihydrogen phosphate was added. Based on UV-vis spectra that is shown in Fig. 8, sensor 2 gave similar spectral response towards H2PO4- ion. The presence of the other anions (Cl-, Br-, and I-) with weak basicity resulted in negligible changes in UV-vis spectra sensor 2. Surprisingly, spectral changes were induced by addition of CN-. Cyanide gave hypsochromic shift (blue-shift) from 647 nm to 601 nm. That phenomenon is called chemodosimeter, it is caused by nucleophilic addition CN- to binding site of sensor 2 [15-16]. Prediction interaction of sensor 2 and CN- is shown in Fig. 10. The binding interaction of presence others anions (F-, Cl-, Br-, I-, CO32-, SO42-, CH3COO-) is probably due to hydrogen bonding between binding site of sensor2and anion [17-18].
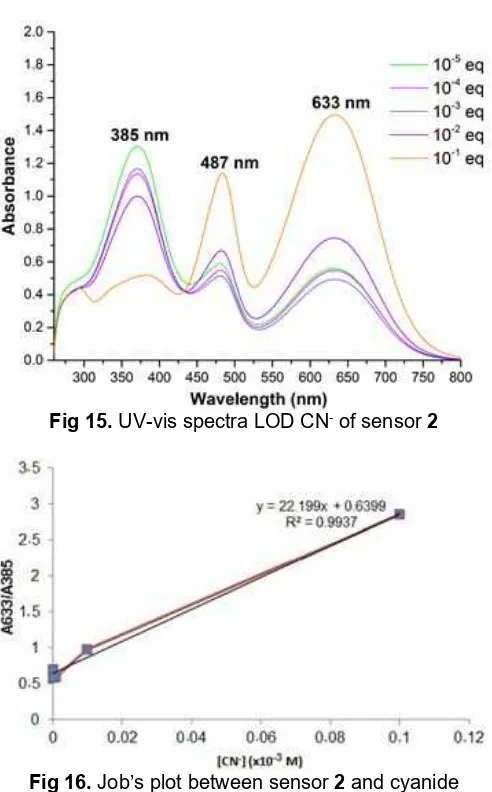
Limit of detection (LOD) color change and UV-vis spectra of sensor 2 could be seen in Fig. 14 and 15. Based on Fig. 15 there was no appearance of a distinct isosbestic point, it’s mean that chemodosimeter occurred during the titration process. The standar deviation of absorbance of sensor 2 without CN- was
obtained as σ = 0.10215 (n = 5). The absorbance at
Fig 15.UV-vis spectra LOD CN-of sensor2
Fig 16.Job’s plot between sensor2and cyanide
experiments of sensor 2 revealed that the LOD of CN -was 1.370 x 10⁻² M at 3σ/m. Limit of detection (LOD) plot between sensor2and cyanide is shown in Fig. 16.
Based on the results, sensor1has different binding interaction with sensor2. The color change in addition of cyanide to sensor1is caused by deprotonation cyanide to binding site of sensor 1. It is more favorable than nucleophilic addition in styrene group by cyanide. Therefore, significant change of color occurred from yellowish to red-purple and then purple, which could be seen in UV-vis spectra there is bathochromic shift. On the other hand, hypsochromic shift occured in sensor 2
that was caused by nucleophilic addition (Fig. 8). Nucleophilic character of the cyanide anion enable addition of sensor 2 was favorable than deprotonation. It’s probably caused by binding site of sensor 2 has steric position. There is azo group that bind nitrobenzene in ortho position of binding site, so nucleophilic addition more favorable by sensor2than deprotonation.
CONCLUSION
In summary, we have successfully synthesized a colorimetric anion sensor from vanillin. Sensor1and 2
gave selectivity for cyanide, followed by color changing from yellowish to red-purple (sensor 1) and green to greenish-blue (sensor 2). Color change that occur in sensor 1 is due to the deprotonation binding site, whereas in sensor 2 is caused by nucleophlic addition of cyanide.
ACKNOWLEDGEMENT
This research was supported by The Grant from Penelitian Unggulan Perguruan Tinggi (PUPT), Universitas Gadjah Mada with contact number: 918/UN1-P.III/LT/DIT-LIT/2006 date 1stMarch 2016.
REFERENCES
[1] Lin, W.C., Hu, J.W., and Chen, K.Y., 2015, A ratiometric chemodosimeter for highly selective naked-eye and fluorogenic detection of cyanide, Anal. Chim. Acta, 893, 91–100.
[2] Kulig, K.W., and Ballantyne, B., 1991, Cyanide Toxicity, US Department of Health & Human Service, Public Health Service, Agency for toxic Substance and Dease Registry.
[3] Na, S.Y., and Kim, H.J., 2015, Azo dye-based colorimetric chemodosimeter for the rapid and selective sensing of cyanide in aqueous solvent, Tetrahedron Lett., 56 (3), 493–495.
[4] Wang, F., Wang, L., Chen, X., and Yoon, J., 2010, Recent progress in the development of fluorometric and colorimetric chemosensors for detection of cyanide ions, Chem. Soc. Rev., 43 (13), 127–123.
[5] Yang, Z., Zhang, K., Gong, F., Li, S., Chen, J., Ma, J.S., Sobenina, L.N., Mikhaleva, A.I., Trofimov, B.A., and Yang, G., 2011, A highly selective fluorescent sensor for fluoride anion based on pyrazole derivative: Naked eye “no–yes” detection, J. Photochem. Photobiol.,A, 217, 29–34.
[6] Suganya, S., and Velmathi, S., 2015, Fluorogenic and chromogenic heterocyclic thiourea: Selective recognition of cyanide ion via nucleophilic addition reaction and real sample analysis, Sens. Actuators, B, 221, 1104–1113.
[7] Dalapati, S., Jana, S., and Guchait, N., 2014, Anion recognition by simple chromogenic and chromo-fluorogenic salicylidene Schiff base or reduced-Schiff base receptors,Spectrochim. Acta, Part A, 129, 499–508.
binding site and a coumarin group as signal unit, Dyes Pigm., 87 (3), 272–276.
[9] Velmathi, S., Reena, V., Sungaya, S., and Anandan, S., 2012, Pyrrole based Schiff bases as colorimetric and fluorescent chemosensors for fluoride and hydroxide anions, J. Fluoresc., 22 (1), 155–162.
[10] Tisseh, Z.N., Dabiri, M., Nobahar, M., Khavasi H.R., and Bazgir, A., 2011, Catalyst-free, aqueous and highly diastereoselective synthesis of new 5-substituted 1H-tetrazoles via a multi-component domino Knoevenagel condensation 1,3-dipolar cycloaddition reaction, Tetrahedron, 68 (6), 1769–1773.
[11] Nigam, S., and Rutan, S., 2001, Principles and application of solvatochromism, Appl. Spectrosc., 55 (11), 362–370.
[12] Hadjmohammadi, M.R., Chaichi, M.J., and Yousefpour, M., 2008, Solvatochromism effect of different solvents on UV-Vis spectra of flouresceine and its derivatives, Iran. J. Chem. Chem. Eng., 22 (4), 9–14.
[13] Sun, Y., Liu, Y., and Guo, W., 2009, Fluorescent and chromogenic probes bearing salicylaldehyde hydrazone functionality for cyanide detection in
aqueous solution, Sens. Actuators, B, 143 (1), 171–176.
[14] Li, J.Y., Zhou, X.Q., Zhou, Y., Fang, Y., and Yao, C., 2012, A highly specific tetrazole-based chemosensor for fluoride ion: A new sensing functional group based on intramolecular proton transfer,Spectrochim. Acta, Part A, 102, 66–70. [15] Park, S., Hong, K.H., Hong, J.I., and Kim, H.J.,
2012, Azo dye-based latent colorimetric chemodosimeter for the selective detection of cyanides in aqueous buffer, Sens. Actuators, B, 174, 140–144.
[16] Pati, P.B., 2016, Organic chemodosimeter for cyanide: A nucleophilic approach,Sens. Actuators, B, 222, 374–390.
[17] Jayasudha, P., Manivannan, R., and Elango, K.P., 2015, Simple colorimetric chemodosimeters for selective sensing of cyanide ion in aqueous solution via termination of ICT transition by Michael addition, Sens. Actuators, B, 221, 1441–1448.