89
An Analysis of Logistics Efficiency in PT. XYZ Surabaya Branch
Elyn Leevana
International Business Management Program, Petra Christian University Jl. Siwalankerto 121-131, Surabaya
E-mail: [email protected]
ABSTRACT
Logistic efficiency is an important element in enhancement of company’s competitiveness. Therefore, this research is conducted to investigate factors that influence logistics efficiency using the study case from PT. XYZ. PT. XYZ is a company in distribution industry that distributes palm oil products and other food products from the manufacturer to retail businesses. The researcher will analyze factors that influence logistics efficiency, measured by transportation costs in this research.
Research technique utilized in this research is multiple linear regression between several company’s Key Performance Indicators (KPI) which are on time delivery rate, truck capacity utilization rate, order-processing rate and fleet unit utilization rate to transportation costs. The research result shows that the KPI being investigated simultaneously influence transportation costs significantly. However, individually, only truck capacity utilization rate influences transportation costs significantly.
Keywords: Logistics efficiency, transportation costs, key performance indicators
ABSTRAK
Efisiensi logistik adalah elemen penting dalam peningkatan daya saing perusahaan. Oleh karena itu, penelitian ini dilakukan untuk mengetahui faktor yang mempengaruhi efisiensi logistik dengan menggunakan studi kasus di PT. XYZ. PT. XYZ adalah perusahaan yang bergerak di bidang distribusi produk minyak kelapa sawit dan makanan lainnya dari pabrik ke bisnis retail. Peneliti akan menganalisa faktor yang mempengaruhi efisiensi logistik, yang diukur dengan biaya transportasi di dalam penelitian ini.
Teknik analisa yang digunakan di dalam penelitian ini adalah regresi linear berganda antara beberapa Key Performance Indicators (KPI) perusahaan yaitu angka pengiriman tepat waktu, angka utilisasi kapasitas truk, angka proses pemesanan dan angka utilisasi unit armada dengan biaya transportasi. Hasil penelitian menunjukkan keseluruhan KPI yang diteliti berpengaruh signifikan terhadap biaya transportasi. Namun secara individu, hanya angka utilisasi kapasitas truk yang berpengaruh signifikan terhadap biaya transportasi.
Kata Kunci: Efisiensi logistik, biaya transportasi, key performance indicators
INTRODUCTION
Conventional Indonesia businesses did not put a meaningful attention unto logistics performance because logistics was seen to support the production in inbound logistics and warehousing then the marketing in transportation (Bahagia, Sandee, & Meeuws, 2013). According to the same source, Indonesia’s logistics cost is still as high as 27% of the GDP, which is more costly compared to other nations in ASEAN. However, companies in Indonesia have now started to improve their logistics processes, since cost reduction in logistics could improve companies’
90 through ABC group distribution company PT. XYZ or known as PT. XYZ. However, the research will specifically discuss about the logistics efficiency in PT. XYZ.
Each company has unique KPIs for logistics performance measurement (Chow, Heaver, & Henriksson, 1994). PT. XYZ measures its logistics efficiency using the set of 10 KPIs headqurter constructed. Among all 10 KPIs, this research will only focus on four KPIs, based on three criteria, which are availability, completeness and exact measurement. The four KPIs are on time delivery rate (OTD), truck capacity utilization rate (TCU), order processing rate (OPR) and fleet unit utilization rate (FUU). OTD is measuring the rate of deliveries that are delivered on time. TCU measures the percentage of truck space utilized during deliveries divided by the capacity. OPR measures the productivity of logistics administration process and FUU measures the productivity of drivers in term of number of delivery stops.
This research will investigate the impact these KPIs have on logistics efficiency, which is represented by transportation costs in the company. Transportation costs is utilized in this research to represent logistics efficiency since it is the only logistics cost components in PT. XYZ that has exact recording and most complete data. Besides that, according to Establish Inc (2010), transportation costs is 49% of total logistics cost. The percentage is very high and therefore could represent the logistics costs.
This research will investigate whether the four KPIs stated above simultaneously impacting transportation costs, as well as investigating their individual impact to transportation costs.
LITERATURE REVIEW
Several concepts and theories support the topic and also research variables.
Logistics efficiency is a concept that has various definitions. Zeng and Rossetti (2003) stated that logistics plays a more critical role in the success of supply chain and as the result. Zeng and Rossetti (2003) also stated that supply chain efficiency is being measured by total logistics costs as one of the most important indicators. Measuring the logistics cost means measuring the logistics efficiency. There are many different definitions of logistic cost. In the study of (Engblom, Solakivi, To ̈yli , & Ojala, 2012) logistic cost consists of six components, which are transport, warehousing, inventory carrying, (logistics) administration, (transport) packaging, and indirect costs of logistics. While (Zeng & Rossetti, 2003) stated that logistic costs usually associated with logistic activities of transportation, warehousing, order processing / customer service, and inventory holding. Being efficient means minimizing the costs. The logistics efficiency to be measured in this
research is only transportation costs since it is the only cost that has exact measurement and complete data in the company. Transportation costs itself has many cost components, and some transportation costs measures the monetary costs and other measures the environmental costs. A report by Black, Munn, Black and Xie (1996) recognizes seven transportation costs, which are accident costs not covered by insurance, capital costs not covered through transport taxes, operating costs of capital, parking costs (fines and fees only), air pollution costs, rehabilitation costs, value of time (personal and commercial). Transportation costs itself has now becoming an important costs to be monitored since the fuel price is rising up (Russell, Coyle, Ruamsook, & Thomchick, 2014) and it rings the alarm to manage the efficiency. Another theory that supports this research is time-based competition. Companies often measure performance through sales and cost, however, time has also been a very important measure. Time is considered as an important element of competitive advantage (Stalk & Hout, 1990). This theory emerged in the 1980s, which is then being discussed furthermore by Boston Consulting Group. This theory argues that the formula to success is that the firms deliver products with the greatest value, lowest price and in the least amount of time (Thiel, Plaschke, Reeves, Lenhard, & Rodt, 2013). Response time of the company towards customer is the crucial point for company’s performance (Stalk, 1998). It means how fast companies can be responsive and flexible in fulfilling the customers’ demand is important for the company’s advantage. In manufacturing companies, products are idle or are waiting 95% to 99.5% of the time (Stalk, 1998), which means that the time for adding values to the products is only a small percentage of total manufacturing time. Therefore, the time should be managed better so there will be no wasted resources.
Lead-time reduction in every aspect such as procurement, paperwork, manufacturing, distribution and other processes would benefits the company. The reduction of time required to make ready a product or service by 25% will boost productivity, reduce the needs of people and assets, which leads to cost reduction as much as 20% (Stalk, 1998). Implementing time-based strategies offer gains for the company such as productivity improvement, ability to set premium price, customer loyalty and also competitive advantage through planned obsolescence (Hum & Sim, 1996). This theory rings the bells in the organization and makes them realize that organization needs to shift the attention and focus from cost to time. Cost is an important factor, however, time influences costs.
91 between order and delivery is very important, and the measurement in this research will use on time delivery rate. On time delivery rate is the number of deliveries that is delivered on time divided by total deliveries.
The on time delivery in this case is following the company standard, which is two days after the invoice is printed. The rule here is to optimized the transportation costs and also meet the expected delivery time standard. The company should be realistic with the service level or delivery time that is promised. If the promised delivery time is in two days, companies do not need to force and send it within one day (Tomkins International, 2013).
Timed-based competition (on time delivery) is having a negative correlation with logistics efficiency (transportation costs), shown in the article by Stalk (1998) that stated time compression could reduce the costs. Therefore the implementation of time-based competition would compress the lead-time, and then reduce the costs that directly affecting the logistics efficiency. Cost reduction is often a direct result of reduction of non-value added time (Waters, 2007).
Capacity utilization is one of the most important concepts in this research. Capacity utilization of vehicle could be measured through several indexes, such as tonne-kilometers per vehicle per annum, weight-based loading factors and space utilization (Waters, 2007). Trucks space is not being maximized most of the time and there are many constraints that caused it to happen, which is shown by the figure 2.1.
Very few researches have been conducted to research the space utilization, however, some research has shown that the space in trucks are often only utilized the mean cube utilization of 52% (McKinnon & Ge, 2004). With only 52% being utilized, 48% of the space is being wasted and thus creates inefficiency. Vehicle capacity utilization can be maximized by maximizing weight or volume of the loads. Although some companies that prioritize inventory reduction are ready to sacrifice the transportation efficiency (Waters, 2007), however transportation efficiency has becoming more important because of the increasing fuel costs and also labor costs for drivers and also the increasing traffic congestion in urban areas. Increased vehicle capacity utilization will reduce the unit delivery cost. In this research vehicle capacity utilization will be measured by truck capacity utilization rate, which is the truck space utilization divided by the capacity of truck delivery.
Vehicle capacity utilization (truck capacity utilization rate) is having positive correlation with logistics efficiency (transportation costs). According to the research by Shu, Huang and Fu (2015), cost increases as the weight of shipment or cargo increases. Increase in capacity means more cartons and more weight of cargo to be delivered, which means that the total transportation costs will increase.
However, capacity utilization in many measures, such as weight or volume will increase the logistics efficiency if the capacity is being optimized (Waters, 2007; Bahagia, Sandee, & Meeuws, 2013). The logistic efficiency would be optimized in transportation costs per unit delivered when capacity increases. This is shown in the research by Wygonik and Goodchild (2001), where when the number of orders increase (which indicates more cargos to be delivered and more capacity utilization), the delivery cost per order would decrease.
In the relation of truck space capacity utilization rate, the researcher conclude that there would be positive correlation to total transportation costs, however it is still efficient since it drop the delivery cost per unit of cargo delivered.
Another important concept to be discussed is the productivity. Productivity is “the ratio of the output(s) that it produces to the input(s) that it uses” (Coelli, Rao, O'Donnell, & Battese, 2005, p. 2). Productivity inputs are the input for production, for instance raw material and labors, where the outputs are the finished products. Productivity that will be measured in this research is partial productivity, because this research only measures productivity of some division, and not the total productivity of the firm. Partial productivity measures is where the productivity is measured using single output produced by single input (Coelli, Rao, O'Donnell, & Battese, 2005). In this research there will be two productivity ratio to be measured, which is the order processing rate and fleet unit utilization that measure workforce productivity. Workforce productivity or labor productivity is defined as “the ratio between a volume measure of output (gross domestic products or gross value added) and a measure of input use (the total number of hours worked or total employment)” (Freeman, 2008, p. 5). The order processing rate is the administrators’ productivity, which is being measure by the invoice as the output and labor hour as the input. The fleet unit utilization is the drivers’ productivity, where the input is drivers’ working hour and number of delivery points as the output. Increased workforce productivity will reduce the operating cost (Accenture, 2013).
92 excellence. Reduced lead-time of order processing, measured by the productivity of administration process, would enable company to reduce transportation costs (Meller, 2015).
Fleet unit utilization is measuring the driver’s productivity, on number of deliveries stop they delivered daily. The number of stops each truck delivered per day is related to the route planning, which would affect the transportation costs (Salter, 2014). The source also argued that optimizing routes, improve scheduling and increase driver’s productivity would minimize the transportation costs.
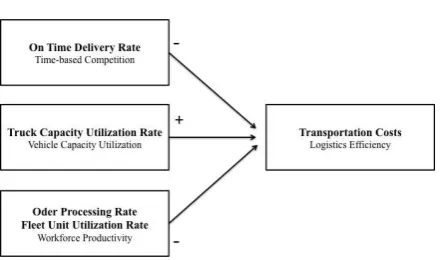
Relationship Between Concepts
Figure 1. Relationship between concepts, theories and variables
The hypothesis of this research are:
H1: Order processing rate, truck capacity utilization, order processing rate and fleet unit utilization is simultaneously influencing transportation costs significantly.
H2: Order processing rate, truck capacity utilization, order processing rate and fleet unit utilization is indivudially influencing transportation costs significantly.
Some relevant researches that supports this research is research by Engblom, Solakivi, Töyli, & Ojala (2012) found out that number of employees is significantly influencing administration costs which is one of the components in logistics costs. Another research by Wygonik & Goodchild (2001) found out that when number of order increase, which implies to higher number of deliveries will decrease the delivery cost per unit. Then the research by Donselaar, Kokke and Allessie(1998) found out that average load capacity is significantly influencing operational performance of companies, where transportation costs is part of the measurement in operational performance.
RESEARCH METHOD
This research is conducting a causal study, where it aims to know whether on time delivery rate, truck capacity utilization rate, order-processing rate, and fleet unit utilization rate are causing the increase or decrease of logistics efficiency. This research is using causal study with quantitative technique because it could give a precise insight of the variables
that probably impacting on the logistics efficiency of the company, which will give meaningful recommendation for company’s logistic efficiency improvement.
There are total of five variables that will be performed in the research. There are two types of variables, which are dependent variable and independent variable. According to Hair, Black, Babin and Anderson (2010, p. 2) dependent variable is “presumed effect of, or response to, a change in the independent variable(s)” and independent variable is “presumed cause of any change in the dependent variable”. The dependent variable is Transportation Costs and the independent variables are On Time Delivery Rate, Truck Capacity Utilization Rate, Order-Processing Rate, and Fleet Unit Utilization Rate. The detail and rate calculations will be discussed as follows:
The dependent variable is transportation costs. This research structure the transportation costs according to the transportation cost components in PT. XYZ which is shown as follows:
Table 1. Transportation Cost Components in PT. XYZ
Transportation Costs
• Drivers’ wages and small fees • Helpers’ wages and small fees • Drivers’ and helpers’ lunch fees • Drivers’ and helpers’ overtime
fees
• Destination’s Unloading Costs • Truck Fuel Costs
• Truck Maintenance Costs • Highway Fees
• Parking Fees • Security Fees
• Area Retribution Fees
There are four independent variables that will be investigated in this research. They are:
OTD =Total Invoice Delivered within Two Days Total Invoice per Day
TCU = Number of Carton Delivered per Day Capacity of Carton Delivery per Day
OPR = Total Invoice per Day
Total Administrator Working Hour per Day
FUU = Number of Delivery Stops per Day Total Driver Working Hour per Day
93 data is taken from company’s daily KPI reporting from December 2014 until the second week of April 2015.
The researcher believes that four months sample is sufficient to reflect or represent the population since the performances are quite constant and reflects the average performance. According to Central Limit Theorem, the sample means distribution is approximately normal distribution and could be seen if the samples are enough (Lind, Marchal, & Wathen, 2012). The source also stated that sample size of 30 is able to observe normality characteristic of skewed and thick-tailed distribution. According to Hair, Black, Babin and Anderson (2010), the minimum ratio of sample size to number of independent variables is 5:1. When the sample size fulfills this requirement, they stated that the result would be generalizable to the population if in fact the samples were representative. Following this requirement, the minimum sample size for this research is 20 data sets, since there are 4 independent variables. This research will use 102 observations as sample, a sample size that is larger than the minimum requirement.
The statistical method that will be performed to analyze the data is Multiple Linear Regression since this research aims to know the influence of OTD, TCU, OPR and FUU towards transportation costs. The multiple linear regression will be analyzed based on some assumptions and analyses according to Tabachnick and Fidell (2006), which are normality, homocedasticity, independence of residuals and absence of multicollinearity.
The steps of performing the research analysis is as follows:
The first step is to check the assumptions. Check whether the results form scatter plots (graphical method for normality and heterocedasiticity test), Shapiro-Wilk test (non parametric test for normality), Glejser test (non parametric test for heterocedasticity), value of VIF (multicollinearity) and also Durbin-Watson statistics (autocorrelation test) have fulfilled the requirement of assumptions that has been stated before.
Next, the model has to be evaluated. In the model summary table, there is R square column that indicates the percentage of prediction power the independent variables have to the dependent variables. However, the R square value tends to be optimistic for small sample size, therefore it is being adjusted (Tabachnick & Fidell, 2006). Thus the researcher refers to the adjusted R square value to mitigate the tendency of being over optimistic. The greater the value of adjusted R square, the better regression model could predict the dependent variable (Lind, Marchal, & Wathen, 2012).
Another test that need to be evaluated in regression model is global test, also known as F-test. In this test, the researcher aim to investigate the ability of independent variables to explain the dependent variable simultaneously (Lind, Marchal, &
Wathen, 2012), where it tests the possibility of having all independent variables to have zero regression coefficients.
If the significance F column or the ρ-value is lower than 0.05, the null hypothesis of F-test is rejected. It means the independent variables are simultaneously influencing dependent variable. If the significance F column or the ρ-value is higher than 0.05, the null hypothesis of F-test failed to be rejected. It means the independent variables are not simultaneously influencing dependent variable.
Next, each predictor will be evaluated whether they give significant impacts to the dependent variable, which is also known as t-test. After having F-test, when the researcher identified that not all independent variables have zero regression coefficient, t-test will be conducted. Therefore, t-test is to test whether each independent variable has zero regression coefficients. If the significant value of t-test or the p-value is lower than 0.05, the null hypothesis of t-test is rejected. It means that the independent variable is individually influencing dependent variable.
If the significance value of t-test or the p-value is higher than 0.05, the null hypothesis of t-test failed to be rejected. It means that the independent variable is not individually influencing dependent variable.
Researcher will check the standardized Beta to compare the predictors, but use the unstandardized values for equation coefficient as suggested by Pallant (2013) for coefficient comparison and regression formula construction. The predictors that have higher values of beta coefficient have stronger impact to the dependent variable than the predictors that have lower beta coefficient.
Thus, through those steps the researcher will analyze the regression result and gives meaningful interpretation based on the analysis.
RESULTS AND DISCUSSION
The total data being added to investigate are 102 observations. The researcher utilized SPSS to process the data. The first step researcher do is to check the classical assumption test through regression. The researcher checked the residual through graphical methods and the result was not good. The graph of normal distribution shows that there are outliers that might impact to the regression model.
Therefore, researcher eliminated some outliers that will mislead the regression result since the existence of outliers would affect the precision of regression model (Tabachnick & Fidell, 2006). The researcher determines outlier as the data that has the residual standard deviation more than three from the regression model, and eliminated them.
94 normal distribution is failed to be rejected..It means that the residuals are normally distributed. The result of Glejser test shows that significance of all independent variables is higher than 0.05, and therefore the null hypothesis of heterocedasticity test, which stated that there is no heterocedasticity among the residuals, is failed to be rejected. It means the data residual also shows no heteroceedasticity Then, the result of Durbin-Watson statistic d value is 1.978, which is larger than the upper limit value of d value, which indicates the null hypothesis of autocorrelation test that stated there is no autocorrelation, is failed to be rejected. It means there is no autocorrelation in the data. The VIF value of multicollinearity analysis is also lower than 10 for all independent variables, which means that the indpendent variables have no multicollinearity.
Multiple linear regression will be performed if all of the assumptions are met. There are several tests that would be evaluated after performing the multiple linear regression, which are adjusted R square, F-test and T-test.
The adjusted R square in this research is 0.408, that means that 40.8% of the variability in dependent variable is depending on the variability in independent variable. This adjusted R square value is relatively high, which means it is a good prediction model.
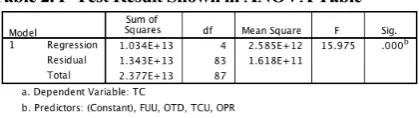
F-test, whish also known as global test, is the test to investigate whether there is simultaneous effect of independent variable towards the dependent variable.
Table 2. F-Test Result Shown in ANOVA Table
The significance level of ANOVA table above is lower than 0.05. In this test, H0 is rejected. It means that the independent variables are simultaneously influencing the dependent variable. Among four independent variables, at least one of them is significantly influencing the dependent variable.
The dependent variables coefficient is stated above. The constant for the regression model is 5,536,911.86. According to Pallant (2013), standardized values are the values that has been converted to the same scale for sake of comparison, however if the researcher would like to construct the regression formula, then the unstandardized coefficient is utilized. Comparing the result of the standardized coefficient, which is the standard deviation, the researcher concludes that the order of independent variables that has highest to the lowest impact on dependent variable are TCU, OPR, FUU and OTD respectively. Based on the result, only one independent variable is contributing statistically significant unique contribution to dependent variable, which is Truck Capacity utilization (TCU).
Table 3. Independent Variable t-Test Results
The positive and negative sign in the coefficient represent the correlation each independent variable has to dependent variable. Based on the results, the regression model could be expressed as follows:
Y = 5,536,911.86 –11,1114.18X1+2,416,696.80X2
-29,055.91X3+101,668.11X4
Y = Transportation Costs
X1= On Time Delivery Rate (OTD) X2= Truck Capacity Utilization Rate (TCU) X3= Order-Processing Rate (OPR)
X4= Fleet Unit Utilization Rate (FUU)
The only significant independent variable is truck capacity utilization rate, where the p-value of this rate is lower than 0.05 and thus the H0 for this rate is rejected. That means that truck capacity utilization rate is individually influencing transportation costs significantly. Based on the regression model, the interpretation is that increase in 1 of TCU rate will increase 2,416,696.80 Rupiah in transportation costs.
The research passed normality, heterocedasticity, autocorrelation and mutilcollinearity test. All assumptions are met after elimination of outliers. The adjusted R square of the multiple linear regression is 0.408, which is relatively high and indicates that the regression model is predicting the regression model well. The only significant variable is Truck Capacity Utilization (TCU). Other independent variables are not significantly influencing dependent variable.
Recalling the hypothesis of the research are: H1: On Time Delivery Rate, Truck Capacity Utilization Rate, Order-Processing Rate and Fleet Unit Utilization Rate simultaneously influences Transportation Costs significantly.
H2: On Time Delivery Rate, Truck Capacity Utilization Rate, Order-Processing Rate and Fleet Unit Utilization Rate individually influences Transportation Costs significantly.
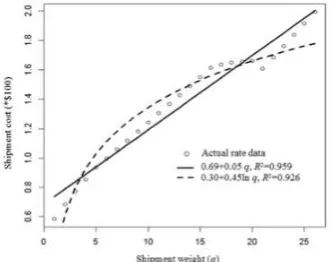
95 success factors in transportation segment plays a significant influence towards operational performance that is proportionate to transportation costs. In that research, the significance of correlation is higher than 90%, which indicates its significance in influencing operational performance. TCU also has positive correlation to transportation costs. The result of regression shows that increase in capacity would add more transportation costs. It is true that the transportation costs of total cargo would increase if more cargos were being transported, however the cost of delivery in unit decreases as capacity increases as explained in vehicle capacity utilization part in literature review. A research by Shu, Huang and Fu (2015) shows that cost increases as the weight of shipment or cargo increases. In this case, increase in capacity means more cartons and more weight of cargo to be delivered. They created a graph of UPS worldwide data set rate model, which is shown as follows:
Figure 2. Rate model of data set of UPS worldwide expedited service
Source: Shu, Huang & Fu (2015, p. 2987)
However, as what economic of density suggests, transportation cost per unit would decrease. Per-unit cost of transporting a cargo increases less than proportionately with the cargo weight (Hubbard, 2001). It implies that there is increase of costs following increase of capacity, nevertheless, the total transportation cost increase is less than the economic benefits of per-unit transportation cost. The relevant research by Wygonick and Goodchild (2001) also verified that higher number of orders, in this case could be indication of higher capacity utilization, would cause cost per order to decrease.
Three other variables that appear to be not individually influencing transportation costs significantly are On Time Delivery Rate, Order Processing Rate and Fleet Unit Utilization Rate.
On time delivery rate is not significantly influence transportation cost in this research. The on time delivery rate is the number of invoice delivered on time per total invoice per day. The on time delivery rate does not significantly influence transportation costs because the carton unit per
invoice varied per invoice. Some invoices had small orders and some others have large orders. Therefore, the number of invoices itself could not predict the transportation cost because of the variation of delivery units. The researcher could also see the positive correlation between on time delivery rate and transportation costs. According to the research by Shen and Daskin (2005) stated there is a trade-off between service level and cost, where their research shows that cost of service-maximization solution could be 6 to 20 times bigger that cost-minimization solution in distribution. The same pattern happens in this research, where an increase of service to customer in term of on time delivery could increase the transportation costs, although not significantly.
Order Processing Rate and Fleet Unit Utilization Rate measures administrator’s productivity and driver’s productivity. Productivity is closely related to cost efficiency, however those two rates are not influencing transportation costs significantly. The order-processing rate measures the number of invoices that could be generated by the administrator’s working hour per day. The order-processing rate could not significantly influence transportation cost. According to relevant research by Engblom, Solakivi, To ̈yli and Ojala (2012), we could see that administration is another cost component in logistics costs, which is separated from transportation costs. And the factor that is significantly influencing administration costs is the number of employees, which could be associated with the administrator’s productivity. Based on the research, the researcher concludes that administrator’s productivity has significant impact on the administration costs and not to transportation costs. Besides that, it does not impact transportation costs significantly because the number of invoice produced each administrators’ hour per day dose not mean that the invoices would be delivered within that particular date. Since the standard of the company for delivery on time is within 3 days, the company would deliver the products within three days accordingly to the most efficient routes. Therefore, the order-processing rate could not significantly predict the transportation costs.
96 However, the distances between stops are varied among all trucks and all destinations. Besides that, the traffic condition would somehow affect efficiency since more traffic congestion means more fuel consumption. The FUU rate does not measures those variables while those variables might be more significant to the transportation costs rather than number of the stops itself.
CONCLUSION
The research aims to investigate about factors that influence the logistics efficiency in the company. The researcher uses the case study of PT. XYZ, which is a distribution company to know their logistics efficiency. The logistics efficiency covers many areas such as transportation, inventory handling, administration, and more. However, this research specifically investigated about transportation efficiency measured by transportation costs since it contributes the most to the total logistics cost as stated in previous section. There are four items that are set as predictors in this research are on time delivery rate, truck capacity utilization rate, order-processing rate and fleet unit utilization rate. These predictors are assumed to be able to predict the dependent variable, which is the transportation costs.
The outcome of the research is different from what is assumed by the researcher in the beginning. All the predictors are simultaneously impacting transportation costs significantly. This means that all of the predictors are giving significant impact to the transportation costs if they are being put together. However, when the researcher evaluated the individual influence of each predictor towards transportation costs, only truck capacity utilization influences transportation costs significantly. This happens due to failure of measuring other factors that matters more to the transportation costs in PT. XYZ.
Lower transportation costs would mean lower logistics cost, which is the logistics efficiency. Since the only significant factor is truck capacity utilization rate, the researcher would conclude that the increase of truck capacity utilization rate would increase transportation costs. However, the researcher suggests that it would decrease the transportation costs per unit of carton delivered based on several relevant researchers. Therefore, the logistics efficiency is enhanced when this rate is maximized. Nevertheless, the other factors’ correlations were not explained since they are not influencing transportation costs significantly and therefore the interpretation of the correlation would not represent reliable relationship.
The result of this research gives information to the company that the factor they need to focus in maximizing is the truck capacity utilization rate in their key performance indicators if they would like to decrease the transportation costs per unit. The academician would also have an insight of what
factors matters in measuring or predicting transportation costs. Besides that, the academicians would have this research results as reference consideration for their future researches. They could do further research to prove the significance of on time delivery rate, order-processing rate and also fleet unit utilization rate to other logistics cost components other than transportation costs. The researcher also gained insights of how these factors influence transportation costs, which eventually affect logistics efficiency.
This research has concluded that the factors that influence transportation costs significantly is truck capacity utilization rate. Therefore the company should pay attention and focus in this rate when associating with transportation costs.
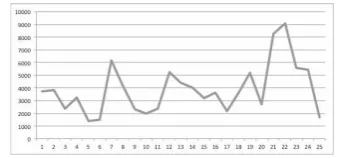
The researcher recommends the company to always maximize the truck capacity utilization. Based on the data, the truck capacity utilization rate is usually low. This happens because of the demand fluctuation in the company, where the demand is quite low in the beginning of the month but very high at the end of the month. The graph below shows the demand pattern in PT. XYZ:
Figure 3. Number of carton delivered in December 2014
The x-axis shows the working day and the y-axis shows the number of carton delivered. The graph shows increasing trend. The number drop significantly during the 23rd until 25th day because it was the end of the year and it was very close to holiday.
The capacity is not maximized during the beginning of the month. Therefore, the researcher recommends the company to pool the orders from customers in the beginning of the month, and create a schedule to pool not urgent deliveries into certain dates to maximize the truck capacity. The company could also merge the deliveries of certain area into one truck. Therefore, that particular truck could have higher capacity utilization and the company could use less but full loaded trucks.
There are several limitations in this research. The researcher faces several problems in the process, which are:
97 internship in the supply chain management division and therefore could only acquired the data from the logistics division. The other financial data is stored in the headquarter in Jakarta and they did not agree to give the data to the researcher even though the company identity would not be stated in the research. Those data such as company’s turnover is only disclosed to some people in the company, therefore the researcher could not research about the turnover effect to the logistics efficiency.
Second limitation is the availability of the data. The predictors’ data was acquired through the daily reporting of logistics key performance indicators in the company. The process of reporting itself is new to the company and only started in November 2014. However, the reporting was in the standardized and complete form only in December 2014. The researcher wished to have annual data because it fluctuates less. However since this reporting is new and the researcher only has four months time for internship, only daily data from December until early April could be acquired.
The last but not least is the problem of exact cost measurement. The researcher initially plan to research about logistic costs in whole, which means that it would also consider other costs beside transportation costs such as administration costs, warehousing costs, inventory holding costs, etc. However the company does not have the exact measure for costs other than transportation costs. The company paid the utility costs such as electricity and water fees in one payment for the whole company, which includes office, warehouse and other buildings. Therefore, the researcher could not determine the percentage of electricity usage foe warehouse only, for instance. Besides that, many costs in administration are also blurred. The paper costs, electricity costs, communication costs, etc. has not exact recordings. The inventory holding costs is also not recorded in regular basis. The company only updates their inventory handling costs when they needed it, and maybe only once a month, which made researcher unable to record this cost. These condition which made researcher would have to assume many costs if the researcher would like to include these costs into the research.
Due to the limitations stated above, the researcher gives several suggestions for further research.First, the researcher suggests that the further research would include all logistics costs components and uses the case study from companies that are willing to disclose their data. Besides that, the cost data should be real time data and free from assumptions. The further research for this research is to investigate the other rates, which are on time delivery rate, order-processing rate, truck capacity utilization rate and also fleet unit utilization rate to the total logistics costs that includes every costs component. Then, the researcher suggests that the
next research would use annually data instead of daily data since annual data fluctuates less.
REFERENCES
Accenture. (2013, September 16). Seven Ways to Reduce Costs and Improve Workforce Productivity Analysis. Retrieved March 9, 2015, from Accenture: http://www.accenture.com/us- en/Pages/insight-seven-ways-reduce-costs-improve-workforce-productivity-summary.aspx
Bahagia, P. D., Sandee, H., & Meeuws, R. (2013). States of Logistics Indonesia 2013. Jakarta: Center of Logistics and Supply Chain Studies, Institut Teknologi Bandung (ITB), Asosiasi Logistik Indonesia, Panteia/NEA, STC-Group and the World Bank.
Chow, G., Heaver, T. D., & Henriksson, E. L. (1994). International Journal of Physical Distribution & Logistics Management Vol 24 No.1 , 17-28. Coelli, T. J., Rao, D. S., O'Donnell, C. J., & Battese, G. E.
(2005). An Introduction to Efficiency and Productivity Analysis. New York: Springer Science+Business Media, Inc.
Donselaar, K. v., Kokke, K., & Allessie, M. (1998). Performance measurement in the transportation and distribution sector. International Journal of Physical Distribution & Logistics Management , 28 (6), 434-450.
Engblom, J., Solakivi, T., To ̈yli , J., & Ojala, L. (2012). Multiple-method Analysis of Logistics Costs . Int. J. Production Economics , 137, 29-35.
Establish, Inc. (2010). Logistics Cost and Service Logistics Cost and Service 2010. Retrieved 04 1, 2015, from Inter-American Development Bank: http://logisticsportal.iadb.org/sites/default/files/2010 _logistics_cost_and_service_presentation.pdf Freeman, R. (2008). Labour Productivity Indicators.
OECD, Structural Economic Statistics. OECD. Garuda Food. (2011). Distribution Network. Retrieved
February 11, 2015, from Garuda Food: http://www.garudafood.com/?page_id=725 Hair, J. F., Black, W. C., Babin, B. J., & Anderson, R. E.
(2010). Multivariate Data Analysis. Upper Saddle River: Prentice Hall.
Hubbard, T. N. (2001). Information, Decisions, and Productivity: On-Board Computers and Capacity Utilization in Trucking. Cambridge: National Bureau of Economic Research.
Hum, S.-H., & Sim, H.-H. (1996). Time-based Competition: Literature Review and Implications for Modelling. International Journal of Operations & Production Management , 16 (1), 75-90.
Lind, D. A., Marchal, W. G., & Wathen, S. A. (2012). Statistical Techniques in Business & Economics. New York: McGraw-Hill.
98 International Journal of Logistics: Research and applications , 7 (3), 219-38.
Meller, R. (2015, March). Order Fulfillment as a Competitive Advantage. Retrieved June 11, 2015,
from Supply Chain 247:
http://www.supplychain247.com/article/order_fulfil lment_as_a_competitive_advantage
Pallant, J. (2013). SPSS Survival Manual. New York: McGraw-Hill.
Red Prairie. (2002). Achieving Measurable Results in Logistics . Alpharetta: Red Prairie.
Russell, D., Coyle, J., Ruamsook, K., & Thomchick, E. (2014). The real impact of high transportation costs. Retrieved June 10, 2015, from Supply Chain Quarterly:
http://www.supplychainquarterly.com/topics/Logist
ics/20140311-the-real-impact-of-high-transportation-costs/
Salter, W. (2014). Cutting Costs. Retrieved June 11, 2015, from Transportation & Logistics International: http://www.tlimagazine.com/index.php/sections/col umns/1830-cutting-costs
Shen, Z.-J. M., & Daskin, M. S. (2005). Trade-offs Between Customer Service and Cost in Integrated Supply Chain Design. Manufacturing & Service Operations Management , 7 (3), 188–207.
Shu, M. H., Huang, J., & Fu, Y. (2015). A production– delivery lot sizing policy with stochastic delivery time and in consideration of transportation cost . Applied Mathematical Modelling , 39 (10-11), 2981–2993.
Stalk, G. (1998, November 30). The Time Paradigm. Retrieved March 6, 2015, from Forbes.com: http://www.forbes.com/asap/1998/1130/213.html Stalk, G., & Hout, T. M. (1990). Competing Against Time.
New York: Free Press.
Tabachnick, B. G., & Fidell, L. S. (2006). Using Multivariate Statistics (Vol. 5). Boston: Pearson. Tomkins International. (2013). Six Ways to Save Costs in
Transportation and Logistics. Retrieved June 11, 2015, from Tomkins International: http://www.tompkinsinc.com/six-ways-to-save-costs-in-transportation-and-logistics/
Thiel, W., Plaschke, F., Reeves, M., Lenhard, E., & Rodt, M. (2013, Desember 10). BCG Perspectives by Boston Consulting Group. Retrieved March 6, 2015, from BCG Perspectives by Boston
Consulting Group:
https://www.bcgperspectives.com/content/articles/in formation_technology_strategy_financial_manage ment_budgeting_reporting_time_based_competitio n_fast_data/
Waters, D. (2007). GLOBAL LOGISTICS New Directions in Supply Chain Management. (D. Waters, Ed.) London: Kogan Page Limited.
Wygonik, E., & Goodchild, A. (2001). Evaluating CO2 emissions, cost, and service quality trade-offs in an urban delivery system case study . IATSS Research , 35, 7-15.