REPORT OF
REPORT OF
NATIONAL
NATIONAL
TRANSPLANT
TRANSPLANT
REGISTRY
REGISTRY
2005
2005
2
nd
nd
Editors:
Hooi LS
Lela Yasmin Mansor
With contributions by:
REPORT OF THE
NATIONAL TRANSPLANT REGISTRY
2005
Editors
Hooi L.S.
Lela Yasmin Mansor
With contributions by:
Published by:
National Transplant Registry
1
stFloor MMA House
124, Jalan Pahang
53000 Kuala Lumpur
Malaysia
Tel
: (603) 4045 5948
Fax
: (603) 4044 0613
e-mail : [email protected]
Website: http://www.mst.org.my
This report is copyrighted. However it may be freely reproduced without the
permission of the National Transplant Registry. Acknowledgement would be
appreciated. Suggested citation is: Hooi L.S., Lela Yasmin Mansor (Eds). 2nd Report
of the National Transplant Registry Malaysia 2005. Kuala Lumpur 2006.
The first report of the National Transplant Registry was launched on 20 December 2005. We are pleased that the second report of the National Transplant Registry has now been published.
We would like to thank all the 160 source data producers without whom this report would not be possible. We are amazed by the level of cooperation provided by many private hospitals and institutions who have voluntarily reported their transplant data. Please keep up the good work.
Altogether there are seven chapters to cater to the 7 types of transplants for which data is being collected: Blood and Marrow Transplant, Cornea Transplant, Heart /Lung Transplant, Liver Transplant, Renal Transplant, Heart Valve Transplant, Bone and Tissue Transplant. Each organ or tissue system has an expert panel to determine the type of data to be collected, interpret the analyzed data and come out with the report. We wish to thank all individuals and representatives from the various professional societies who sit in these expert panels for their continued and invaluable support.
In this second report an eight chapter has been added to capture data on cadaveric organ and tissue donation. This has been possible with the assistance of the National Transplant Resource Centre, Hospital Kuala Lumpur.
Lastly we wish to record once again our sincere appreciation to the Ministry of Health, Clinical Research Centre, Hospital Kuala Lumpur, our supporters from the pharmaceutical industry and other well wishers for their continued support.
Thank you.
Tan Sri Dato’ Dr Yahya Awang Dato’ Dr Zaki Morad Datin Dr Lela Yasmin Chairperson Co-Chairperson Mansor
NTR NTR Co-chairperson
The National Transplant Registry would like to record its appreciation to everyone who have helped make this report possible.
We would especially like to thank the following:
• Our source data providers who are the transplant surgeons, physicians and staff of all organ and tissue transplant centres and transplant follow up centres from the government, university and private sectors, without whose commitment, hard work and timely data submission there will be no report
• National Renal Registry for sharing the renal transplant data • Clinical Research Centre, Hospital Kuala Lumpur
• Ministry of Health
• The members of the various expert panels for their expertise and for devoting their valuable time and effort in preparing and writing the various chapters • And not forgetting our supporters from the industry and other well-wishers:
Roche (M) Sdn Bhd
Norvartis Corporation (M) Sdn Bhd
Discipline: Blood and Marrow Transplant
1. Division of Haematology, Department of Medicine, University of Malaya Medical Centre 2. Haematology Department, Hospital Kuala Lumpur
3. Haematology Department, Subang Jaya Medical Centre
4. Maybank BMT Centre, Hospital Universiti Kebangsaan Malaysia
5. Oncology-Haematology Department, Gleneagles Medical Centre, Penang 6. Oncology-Haematology Department, Lam Wah Ee Hospital
7. Paediatric BMT Unit, Department of Paediatrics, University of Malaya Medical Centre 8. Paediatric BMT Unit, Institute of Paediatrics, Hospital Kuala Lumpur
9. Paediatric BMT Unit, Subang Jaya Medical Centre
Discipline: Cornea Transplant
1. Eye Clinic, Mahkota Medical Centre
2. Hope Eye Centre, Gleneagles Intan Medical Centre, Kuala Lumpur 3. Klinik Pakar Mata Centre For Sight
4. Ophthalmology Department, 94 Hospital Angkatan Tentera Kem Terendak 5. Ophthalmology Department, Hospital Universiti Kebangsaan Malaysia 6. Ophthalmology Department, Gleneagles Medical Centre, Penang 7. Ophthalmology Department, Hospital Alor Setar
8. Ophthalmology Department, Hospital Batu Pahat 9. Ophthalmology Department, Hospital Bukit Mertajam
10. Ophthalmology Department, Hospital Duchess of Kent, Sandakan 11. Ophthalmology Department, Hospital Ipoh
12. Ophthalmology Department, Hospital Kajang 13. Ophthalmology Department, Hospital Kangar 14. Ophthalmology Department, Hospital Kuala Lipis 15. Ophthalmology Department, Hospital Kuala Lumpur 16. Ophthalmology Department, Hospital Kuala Pilah 17. Ophthalmology Department, Hospital Kuala Terengganu 18. Ophthalmology Department, Hospital Melaka
19. Ophthalmology Department, Hospital Mentakab 20. Ophthalmology Department, Hospital Miri
21. Ophthalmology Department, Hospital Pakar Sultanah Fatimah 22. Ophthalmology Department, Hospital Pantai Indah
23. Ophthalmology Department, Hospital Pulau Pinang 24. Ophthalmology Department, Hospital Putrajaya
25. Ophthalmology Department, Hospital Queen Elizabeth, Kota Kinabalu 26. Ophthalmology Department, Hospital Raja Perempuan Zainab II, Kota Bharu 27. Ophthalmology Department, Hospital Selayang
28. Ophthalmology Department, Hospital Seremban 29. Ophthalmology Department, Hospital Sibu
38. Ophthalmology Department, Hospital Umum Sarawak
39. Ophthalmology Department, Hospital Universiti Sains Malaysia 40. Ophthalmology Department, Sri Kota Medical Centre
41. Ophthalmology Department, University of Malaya Medical Centre 42. Ophthalmology Unit, Department of Surgery, Universiti Putra Malaysia 43. Optimax Eye Specialist Centre
44. Puteri Specialist Hospital, Johor Bahru
45. Tan Eye Specialist Centre, Sunway Medical Centre
46. Tun Hussein Onn National Eye Hospital, Tun Hussein Onn National Eye Hospital
Discipline: Heart and Lung Transplant
1. Cardiothoracic Department, Institut Jantung Negara 2. Institut Perubatan Respiratori, Hospital Kuala Lumpur
Discipline: Heart Valve Transplant
1. Cardiovascular Tissue Bank, Department of Cardiothoracic Surgery, Institut Jantung Negara
Discipline: Liver Transplant
1. Department of Paediatrics, University of Malaya Medical Centre 2. Hepatobiliary Department, Hospital Selayang
3. Institute of Paediatrics, Hospital Kuala Lumpur 4. Subang Jaya Medical Centre
Discipline: Renal Transplant
1. 96 Hospital Angkatan Tentera Kem Lumut
2. C. S. Loo Kidney & Medical Specialist Centre, Perak Community Specialist Hospital 3. MAA-Medicare Kidney Charity, Cheras
4. National Kidnay Foundation Dialysis Centre, Taiping 5. Nephrology Department , Hospital Alor Setar
6. Nephrology Department, Hospital Batu Pahat 7. Nephrology Department, Hospital Bintulu
8. Nephrology Department, Hospital Duchess of Kent 9. Nephrology Department, Hospital Dungun
10. Nephrology Department, Hospital Ipoh 11. Nephrology Department, Hospital Kangar 12. Nephrology Department, Hospital Kemaman 13. Nephrology Department, Hospital Kluang
18. Nephrology Department, Hospital Mentakab 19. Nephrology Department, Hospital Miri
20. Nephrology Department, Hospital Pakar Sultanah Fatimah 21. Nephrology Department, Hospital Pontian
22. Nephrology Department, Hospital Pulau Pinang 23. Nephrology Department, Hospital Queen Elizabeth
24. Nephrology Department, Hospital Raja Perempuan Zainab II 25. Nephrology Department, Hospital Segamat
26. Nephrology Department, Hospital Selayang 27. Nephrology Department, Hospital Serdang 28. Nephrology Department, Hospital Seremban 29. Nephrology Department, Hospital Sibu
30. Nephrology Department, Hospital Sultan Ismail Pandan 31. Nephrology Department, Hospital Sultanah Aminah 32. Nephrology Department, Hospital Taiping
33. Nephrology Department, Hospital Tanah Merah 34. Nephrology Department, Hospital Tawau 35. Nephrology Department, Hospital Teluk Intan 36. Nephrology Department, Hospital Temerloh
37. Nephrology Department, Hospital Tengku Ampuan Afzan 38. Nephrology Department, Hospital Tengku Ampuan Rahimah 39. Nephrology Department, Sarawak General Hospital
40. Nephrology Department, UKM Hospital
41. Nephrology Department, University Malaya Medical Centre 42. Nephrology Department, USM Hospital
43. Nephrology Unit, Ampang Puteri Specialist Hospital 44. Nephrology Unit, Assunta Hospital
45. Nephrology Unit, Mahkota Medical Centre 46. Nephrology Unit, Subang Jaya Medical Centre 47. Nephrology Unit, Sunway Medical Centre 48. Normah Medical Specialist Centre
49. Paediatric Renal Transplant Clinic, Hospital Kuala Lumpur 50. Paediatric Ward, Hospital Sultanah Aminah
51. Renal Care, Ipoh Specialist Hospital 52. Renal Dialysis Centre Sdn. Bhd.
53. Renal Transplant Clinic, Damai Medical & Heart Clinic 54. Renal Transplant Clinic, Hospital Lam Wah Ee
55. Renal Transplant Clinic, Pusat Pakar Tawakal 56. Renal Transplant Clinic, Sabah Medical Centre 57. Renal Transplant Clinic, Selangor Medical Centre 58. Renal Transplant Clinic, Sri Kota Medical Centre 59. Renal Transplant Unit, Hospital Pantai Mutiara 60. S.P. Menon Dialysis Centre, Klang
61. Simon Wong Medical & Kidney Clinic, Timberland Medical Centre 62. Smartcare Dialysis Centre, Cheras
63. Smartcare Dialysis Centre, Subang Jaya 64. Tan Medical Renal Clinic
65. The Rotary Haemodialysis Centre 66. Tung Shin Hospital
1. Department of Orthopaedic & Traumatology, Hospital Kangar 2. Department of Orthopaedic Surgery, Hospital Alor Setar 3. Department of Orthopaedic Surgery, Hospital Taiping
4. Department of Orthopaedic Surgery, University of Malaya Medical Centre 5. Department of Orthopaedics, Hospital Ipoh
6. Department of Orthopaedics, Hospital Kajang
7. Department of Orthopaedics, Hospital Kuala Terengganu 8. Department of Orthopaedics, Hospital Kuantan
9. Department of Orthopaedics, Hospital Pulau Pinang
10. Department of Orthopaedics, Hospital Raja Perempuan Zainab II 11. Department of Orthopaedics, Hospital Seberang Jaya
12. Department of Orthopaedics, Hospital Sultanah Aminah
13. Department of Orthopaedics, Hospital Tengku Ampuan Rahimah 14. Department of Orthopaedics, Hospital Universiti Sains Malaysia 15. Department of Orthopaedics, Sarawak General Hospital
16. Department of Orthopaedics, Sultanah Fatimah Specialist Hospital
17. Department of Orthopaedics, Traumatology and Rehabilitation, International Islamic University Malaysia
18. Department of Surgery, Hospital Kota Bharu 19. Hospital Fatimah, Ipoh
20. Institute of Orthopaedic & Traumatology, Hospital Kuala Lumpur 21. Island Hospital, Penang
22. Malaysian Institute For Nuclear Technology Research 23. National Tissue Bank, Universiti Sains Malaysia 24. Normah Medical Specialist Centre, Kuching
25. Ophthalmology Department, Hospital Kuala Lumpur 26. Ophthalmology Department, Hospital Teluk Intan
27. Ophthalmology Department, Hospital Tengku Ampuan Afzan 28. Ophthalmology Department, Hospital Tengku Ampuan Rahimah 29. Ophthalmology Department, Sri Kota Medical Centre
30. Timberland Medical Centre, Kuching
The National Transplant Registry (NTR) is a Ministry of Health (MOH) supported registry whose aim is to collect information about organ and tissue transplantations in Malaysia. The information allows us to estimate the magnitude of transplant activity in the country. Such information besides being useful to practitioners of transplantation is useful in assisting the MOH, non-governmental organisations, private providers and industry in program planning and evaluation of transplantation services.
The objectives of NTR are to:
1. Determine the frequency and distribution of all types of transplantation activity in Malaysia.
2. Determine the outcomes of transplantation.
3. Determine the factors influencing outcomes of transplantation. 4. Evaluate transplantation services in the country.
5. Stimulate and facilitate research on transplantation and its management.
The NTR receives data on organ / tissue transplantation from 3 main sources:
1. The individual doctors who provide transplantation services, who voluntarily report data to the NTR. Data collection will be from seven main types of transplantation services:
• Blood and Marrow Transplant • Cornea Transplant
• Heart and Lung Transplant • Liver Transplant
• Renal Transplant • Heart Valve Transplant • Bone and Tissue Transplant
2. The National Vital Registration system (Jabatan Pendaftaran Negara). Their data is useful for determining or verifying mortality outcomes of transplant patients.
3. Information Documentation Unit of the MOH, which operates the Health Management Information system (HMIS).
SPONSORS OF THE NTR
• Medical Development Division, MOH • National Transplant Coordinating Committee • Malaysian Society Of Transplantation
Current membership of the Governance Board are as follows:
Name Representation
Tan Sri Dato’ Dr. Yahya Awang
Chairperson
Cardiothoracic Consultant, Damansara Specialist Hospital NTR Expert Panel
Chairman of Heart / Lung Transplant
Dato’ Dr. Zaki Morad Mohd Zaher
Co-chair
Head, Department of Nephrology, Hospital Kuala Lumpur NTR Expert Panel
Chairman of Renal Transplant
Datin Dr. Fadhilah Zowyah Lela Yasmin Mansor
Co-chair
Chairperson, Registry Subcommittee National Transplant Coordinating Committee Ministry Of Health
Dato' Dr. Tan Kai Chah Hepatobiliary / Liver Transplant Surgeon, Subang Jaya Medical Centre
Dr. Teng Seng Chong Medical Development Division, Ministry of Health
Dr. Tan Chwee Choon Malaysian Society of Transplantation
Dr. Lim Teck Onn Clinical Research Centre (CRC), Hospital Kuala Lumpur
Dr. Jamaiyah Haniff Clinical Research Centre (CRC), Hospital Kuala Lumpur
Mr. Rohan Malek Malaysian Urological Association
Dr. Hooi Lai Seong Malaysian Society of Nephrology
Mr. Hamdan Leman Malaysian Society of Thoracic & Cardiovascular Surgeons
Dr. Aizai Azan Abdul Rahim National Heart Association of Malaysia
Prof. Dr. Abdul Rani Samsudin Malaysian National Tissue Bank
Dr. Wong Jun Shyan Ophthalmological Society Of MMA
Tan Sri Datuk Dr. Mohd. Ismail Merican
Malaysian Liver Foundation
Dr. Hamidah Shaban Malaysian Thoracic Society
Prof. Dr. Zulmi Wan Malaysian Orthopaedic Association NTR Expert Panel
Chairman of Bone and Tissue Transplant Dr. Gill Satwant Singh National Kidney Foundation of Malaysia Dr. Chang Kian Meng Malaysian Society of Haematology
Dr. Kelvin Lim Lye Hock Malaysian Association of Oral & Maxillofacial Surgeons Dr. R T Arasu Malaysian Dental Association
Dr. Alan Teh Kee Hean NTR Expert Panel
Co-chair of Blood and Marrow Transplant (Adult) Prof. Dr. Chan Lee Lee NTR Expert Panel
Co-chair of Blood and Marrow Transplant (Paediatric) Dato’ Dr. Zakaria Zahari NTR Expert Panel
Chairman of Liver Transplant Dr. Shamala Retnasabapathy NTR Expert Panel
Chairman of Cornea Transplant Dr. Goh Bak Leong NTR Expert Panel
Co-chair of Renal Transplant Mr. Mohamed Ezani Hj Md. Taib NTR Expert Panel
NTR has established seven groups of expert panel comprising members of the medical profession and allied health with expert knowledge in the various disciplines:
• Blood and Marrow Transplant • Cornea Transplant
• Heart and Lung Transplant • Liver Transplant
• Renal Transplant • Heart Valve Transplant • Bone and Tissue Transplant
The role of the expert panel is:
1. To undertake quality control of the clinical registry form and the data dictionary 2. To undertake quality control of the reported data
3. To undertake literature review in the relevant area 4. To interpret the results generated by NTR’s statisticians
5. To write the section of the NTR report relevant to the panel expertise 6. To specify the data reporting procedure
7. To facilitate access to source documents for Transplant Registry Unit (TRU) staff to do data verification
List of Expert Panel members for each respective discipline:
Discipline: Blood and Marrow Transplant
Co-Chair (Adult) Dr. Alan Teh Kee Hean
Co-Chair (Paeds) Prof. Dr. Chan Lee Lee
Member Prof. Dr. Cheong Soon Keng
Dr. Chang Kian Meng
Dr. Gan Gin Gin @ Gan Shiaw Sze Dr. Hishamshah Mohd Ibrahim Dr. Jameela Sathar
Prof. Dr. Lin Hai Peng Dr. Mahfuzah Mohamed Dr. Ng Soo Chin
Dr. S Visalachy Purushothaman Dr. Vijaya Sangkar
Discipline: Cornea Transplant
Chairman Dr. Shamala Retnasabapathy
Co-Chair Dr. Choong Yean Yaw
Member Dato’ Dr. Veera Ramani
Dr. Jonathan Choon Siew Cheong Dr. Chuah Kay Leong
Dr. Michael Law Sie Haur Dr. Mariam Ismail
Discipline: Heart and Lung Transplant
Chairman Tan Sri Dato’ Dr. Yahya Awang
Co-Chair Mr. Mohamed Ezani Hj Md.Taib
Member Datin Dr. Aziah Ahmad Mahayiddin
Dr. Ashari Yunus
Dr. Aizai Azan Abdul Rahim Dato’ Dr. David Chew Soon Ping Dr. Hamidah Shaban
Discipline: Liver Transplant
Chairman Dato’ Dr. Zakaria Zahari
Member Dr. Ganesalingam A/L Kanagasabai
Dr. Goon Hong Kooi Dr. Lim Chooi Bee
Assoc. Prof. Dr. Lee Way Seah
Dr. Sushila Sivasubramaniam Dr. Tan Soek Siam
Dr. S Thavaranjitham
Discipline: Renal Transplant
Chairman Dato’ Dr. Zaki Morad Mohd Zaher
Co-Chair Dr. Goh Bak Leong
Member Dr. Fan Kin Sing
Dr. Lily Mushahar Mr. Rohan Malek Dr. S Prasad Menon Prof. Dr. Tan Si Yen
Discipline: Heart Valve Transplant
Chairman Mr. Mohamed Ezani Hj Md.Taib
Discipline: Bone / Tissue Transplant
Chairman Prof. Dr. Zulmi Wan
Member Prof. Dr. Abdul Rani Samsudin
Dr. Badrul Shah Badaruddin Dato’ Dr. Hasim Mohamad Dr. Norimah Yusof
Clinical Registry Coordinator Ms. Leong Wei Chee
SUPPORTING STAFF FROM THE CLINICAL RESEARCH CENTRE
The Clinical Research Centre (CRC) of the Ministry of Health provides technical support for the National Transplant Registry. The clinical epidemiologists provide methodological and epidemiological input while the database is supported on CRC’s IT infrastructure.
Clinical Epidemiologist Dr. Jamaiyah Haniff
Clinical Epidemiologist Dr. Anita Das
Information & Communication Ms. Celine Tsai Pao Chien Technology (ICT) Manager
Network Administrator Mr. Kevin Ng Hong Heng
Assistant Network Administrator Mr. Adlan Ab. Rahman
Database Administrator Ms. Lim Jie Ying
Programmer Mr. Sebastian Thoo / Mr. John Chong
Desktop publisher Ms. Azizah Alimat
BIOSTATISTICAL CONSULTANTS
Consultant Biostatistician Dr. Sharon Chen Won Sun
Biostatistician Mr. Tan Wei Hao
Biostatistician Ms. Suziah binti Simat
Foreword i
Acknowledgements ii
Participating Centres iii
About the National Transplant Registry vii
Sponsors of the NTR vii
Governance Board viii
Expert Panel ix
NTR staff xi
Supporting staff of Clinical Research Centre xi
Contents xii
Introduction 1
Report Summary 3
Chapter 1: Blood and Marrow Transplantation 6
Chapter 2: Cornea Transplantation 40
Chapter 3: Heart and Lung Transplantation 66
Chapter 4: Liver Transplantation 77
Chapter 5: Renal Transplantation 92
Chapter 6: Heart Valve Transplantation 128
Chapter 7: Bone and Tissue Transplantation 139
Chapter 8: Cadaveric Organ and Tissue Donation 145
Appendix A: Data Management 156
Appendix B: Analysis Sets and Statistical Methods 159
Appendix C: Glossary 160
The national transplant registry (NTR) was planned and set up in November 2003. The parties involved in the setting up of the NTR are the Clinical Research Centre (CRC), Medical Development Division, Ministry of Health and the Malaysian Society of Transplantation. Due to policy changes, the running of the NTR has been transferred to the Malaysian Society of Transplantation since December 2005. The Transplant Registry Unit of the CRC continues to provide the expertise for statistical analysis and IT support. The NTR is currently staffed by a full time Clinical Research Coordinator Ms Leong Wei Chee. I wish to take this opportunity to record our sincere appreciation and thanks to Ms Woo Li Fong who has resigned as Clinical Registry Manager to work overseas. Ms Woo had played an important role in getting the cooperation and support of all our source data producers (SDPs). The SDPs are individual doctors or transplant units who voluntarily report data on their transplant activities.
Transplant registry databases are important as they can be used to describe and monitor trends in transplantation. They can play a critical role in assessing transplantation, help identify factors that influence outcome and help evaluate late transplant complications.
The government, scientific community, pharmaceutical industry and public can have access to the NTR data as the reports once published remains in the public domain and can be downloaded from the internet. The government and policy makers can use this data to address issues related to funding and reimbursement policy, legislative and regulatory policy, performance standards and quality control. The scientific community and the public can use this data for research, policy analysis and evaluation of organ allocation policies. Patients and families can use the data to evaluate their transplant options. Therefore the valuable information provided justifies the investment put into transplant registries.
In fact at the 57th World Health Assembly organised by WHO in Geneva in May 2004, the Issue of Human Organ and Tissue Transplantation was addressed. One of the resolutions passed included requesting among other things for the Director General of Health of member countries to collect and examine data on practices, safety, quality, efficacy and epidemiology of organ and tissue transplantation. The aim is to foster global collection of data on donation and transplantation of all organs and tissues. With the setting up of the NTR and the publication of the second report we are surely moving in the right direction in this respect.
In this second report of the National Transplant Registry, there are no major surprises. New information and updates have been added to the first report. You may notice some discrepancies in the numbers of patients transplanted in the various years listed if you were to compare this second report with the first report. These discrepancies are unavoidable to some extent as transplants done in a particular year may only be reported in later years as data gets updated.
Transplantation activity in this country however remains relatively low. In 2005 the transplants that were done in Malaysia included:
- 192 corneal transplants
- 145 blood and bone marrow transplants - 46 kidney transplants
- 5 liver transplants
patients went overseas for commercial transplants. These commercial transplants done overseas make up 70% of new renal transplant recipients. Even if we take these into account, the kidney transplant rate in Malaysia is low at about 6 per million population per year. In contrast, the intake of new dialysis patients was 101 per million population in 2005. This means that that less than 6% of end stage kidneys failure get transplanted – the vast majority having to accept live long dialysis therapy as their only option. In 2005, our cadaver organ donation rate remains very low at 0.53 per million population.
We hope all that all parties concerned will work harder to find ways to increase the level of transplant activity in this country. We all share the same desire to improve the plight of many Malaysians who are in dire need of life saving organ transplants or tissue transplants that will improve the quality of lives.
This low level of transplant activity may also have an impact on the long-term viability of the National Transplant Registry. However in the near term we are confident that the NTR will continue to develop and progress. We are fortunate that the founding members of the NTR including Tan Sri Dato’ Dr. Yahya Awang, Dato’Dr. Zaki Morad Mohd. Zaher, Datin Dr. Lela Yasmin Mansor and Dr. Lim Teck Onn remain enthusiastic and committed. It is also hoped that Dr. Hooi Lai Seong who has contributed much of her free time doing the tedious work of editing this report will continue as editor for future reports. The NTR continues to depend on financial support from the Ministry of Health, the pharmaceutical industry and other well-wishers. It is hoped that all concerned will realize the benefits of having a national transplant registry and continue to contribute to its success and development.
Thank you.
Tan Chwee Choon
1. BLOOD AND MARROW TRANSPLANTATION
There was a total of 1048 haematopoietic stem cell transplantations reported to the Registry between 1987 and 2005; of which 699 recipients were alive at the end of 2005.
The majority of all transplants (72%) were for malignant disorders and most of these are haematological malignancies like leukaemia and lymphoma. The main non-malignant disorders transplanted were thalassaemia and aplastic anaemia.
There were 145 new transplantations done in the 9 transplant units in Malaysia in 2005.
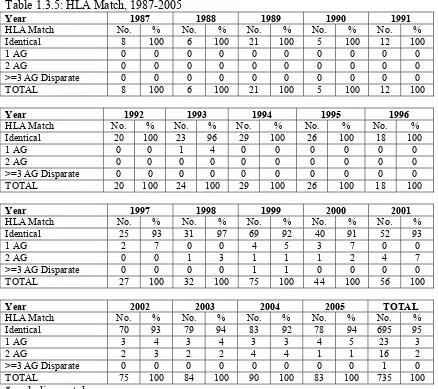
Mean age of new transplant patients in 2005 was 26 + 16 years; 48% were male, 46% Chinese. Autologous transplants accounted for 39%. Seventy-nine percent of the transplant sources were from peripheral blood stem cells and 94% were from HLA identical donors.
In 2005, 36 patients died. Underlying disease, infection and GVHD were the commonest causes of death accounting for 39%, 25% and 17% respectively.
2. CORNEAL TRANSPLANTATION
There were 46 centres which agreed to provide cornea transplantation data.
One hundred and ninety-two new cornea transplantations were reported in Malaysia in 2005. Mean age of new transplant recipients in 2005 was 46 + 21 years. Of these, 59% were male, 32% of recipients were Malay, 38% Chinese, 21% Indian and 9% other races.
The primary diagnoses for cornea transplantation recipients in 2005 were cornea perforation (19%), keratoconus (18%), pseudophakic bullous keratopathy (18%), microbial keratitis (17%), cornea scars (10%), other (non-pseudophakic) bullous keratopathy (7%), and failed previous cornea grafts (7%).
Seventy-six percent recipients were legally blind before their transplant surgery.
In 2005, 71% of donated corneas were from the USA, 17% from Sri Lanka and 12% from local sources. The mean age of the donors was 57 + 14 years.
and 2005.
There were only 1 heart transplant and 1 lung transplant performed in 2005. The lung transplant was a single lung transplant. 7 heart grafts were functioning at the end of 2005and all were followed up in Institut Jantung Negara.
Two thirds of the recipients were males and over half were Indians. The mean age of recipients was 36 + 16 years. Ischaemic cardiomyopathy was the commonest primary diagnosis (8/15) followed by dilated cardiomyopathy (6/15).
Five recipients died in hospital following transplantation; four patients succumbed to late deaths after their heart transplant.
The transplant patient survival rate was 60% and 40% at 1 year and 3 years respectively.
4. LIVER TRANSPLANTATION
There were a total of 80 liver transplantations reported to the Registry between 1993 and 2005; 45 grafts were functioning at the end of 2005.
There were 5 new liver transplantations done in Malaysia in 2005.
There were 4 centres of follow-up for liver transplant recipients in 2005.
Mean age of all transplant patients was 7 + 13 years (range 3 months to 74 years); 55% were male, 51% Chinese, 76% were for biliary atresia. A majority was living donor liver transplantations (84%).
At the time of transplantation the main immunosuppressive drugs used were tacrolimus (76%) and steroids (55%).
Transplant patient survival rate for the cohort 1993 to 1998 was 71% at 1 year; survival rate for the cohort 1999 to 2005 was 66% at 1 year.
5. RENAL TRANSPLANTATION
There were 67 centres of follow-up for renal transplant recipients in 2005. Incident rates for renal transplantation were static, from 7 per million population in 1996 to 6 per million in 2005. There were 155 new renal transplants in 2005.
The number of functioning renal transplants has increased steadily from 1023 in 1996 to 1681. The transplant prevalence rate was 69 per million population in 2005.
cyclosporine, 14% tacrolimus, 44% mycophenolate mofetil and 39% azathioprine.
In 2005, 38 (2%) of prevalent transplant recipients died and 15 (1%) lost their grafts. Infection and cardiovascular disease were the commonest causes of death accounting for 42% and 11% respectively. Death at home was the third commonest cause at 11%. Renal allograft rejection accounted for 78% of graft loss.
The overall transplant patient survival rate from 1993 to 2005 was 95%, 92%, 89% and 81% at 1 year, 3 years, 5 years and 10 years respectively, while the overall graft survival rate was 92%, 85%, 79% and 63% respectively.
6. HEART VALVE TRANSPLANTATION
There were a total of 163 heart valve homografts reported to the Registry between 1996 and 2005; 144 grafts were functioning at the end of 2005. Eighty-two were aortic and 81 were pulmonary valves.
Mean age of all heart valve transplant patients was 11 + 11 years (range 3 months to 70 years); 50% were male, 61% Malay.
7. BONE AND TISSUE TRANSPLANTATION
In 2005, 131 bone allografts and 64 amniotic membranes were supplied by National Tissue Bank, USM.
Twenty-one hospitals used the bone grafts and 16 centres used the amniotic membranes.
8. CADAVERIC ORGAN AND TISSUE DONATION
There were 13 donors in 2005 of which 5 were brain dead multi-organ and tissue donors and 8 were post cardiac death tissue donors. The rate is 0.53 donations per million population. The first lung donor for lung transplantation occurred in December 2005.
The mean age of the donors was 46.4 +24.8 years. The youngest was a Malay three year old child who donated liver, kidneys, heart valves and eyes, the oldest was an 81 year old eye donor. All the donors were Malaysians, of whom 7 were Indians, 5 Chinese and 1 Malay. Seven donors were from Selangor. There were more male donors than female (62% versus 38 %).
Editors:
Dr. Alan Teh Kee Hean Prof. Dr. Chan Lee Lee
Expert Panel
Dr. Alan Teh Kee Hean (Chair – Adult) Prof. Dr. Chan Lee Lee (Chair – Paediatric)
Prof. Dr. Cheong Soon Keng Dr. Chang Kian Meng
Dr. Gan Gin Gin
Dr. Hishamshah Mohd Ibrahim Dr. Jameela Sathar Prof. Dr. Lin Hai Peng Dr. Mahfuzah Mohamed
Dr. Ng Soo Chin Dr. Visalachy Purushothaman
Dr. Vijaya Sangkar
Contents
1.0 Introduction
1.1 Stock and Flow of Blood and Marrow Transplantation
• Stock and flow • Transplant rates • Places of transplant
1.2 Recipients’ Characteristics
• Demographics • Primary diagnosis
1.3 Transplant Practices
• Graft number • Type of transplant
• Transplant source and HLA match
1.4 Transplant Outcomes
• Patient survival
List of Tables
Table 1.1.1: Stock and Flow of Blood and Marrow Transplantation, 1987-2005 ... 10 Table 1.1.2: New Transplant Rate per million population (pmp), 1987-2005... 11 Table 1.1.3: Centre distribution (SDP), 1987-2005 ... 12 Table 1.2.1: Gender distribution, 1987-2005 ... 14 Table 1.2.2: Ethnic group distribution, 1987-2005 ... 16 Table 1.2.3: Age distribution, 1987-2005 ... 18 Table 1.2.4: Primary Diagnosis, 1987-2005 ... 20 Table 1.3.1: Graft number, 1987-2005... 22 Table 1.3.2: Type of transplant, 1987-2005... 24 Table 1.3.3: Type of transplant by Centre, 1987-2005 ... 25 Table 1.3.4: Transplant source, 1987-2005... 26 Table 1.3.5: HLA Match, 1987-2005... 28 Table 1.3.6: Allogeneic Donor Relationship, 1987-2005 ... 29 Table 1.4.1: Cause of Death, 1987-2005 ... 30
List of Figures
Figure 1.1.1: Stock and Flow of Blood and Marrow Transplantation, 1987-2005... 10 Figure 1.1.2: New Transplant Rate per million population (pmp), 1987-2005 ... 11 Figure 1.1.3: Centre distribution (SDP), 1987-2005... 13 Figure 1.2.1: Gender distribution, 1987-2005... 15 Figure 1.2.2: Ethnic group distribution, 1987-2005... 17 Figure 1.2.3: Age distribution, 1987-2005... 19 Figure 1.3.1: Graft number, 1987-2005 ... 23 Figure 1.3.2: Type of transplant, 1987-2005 ... 24 Figure 1.3.3: Type of transplant by Centre, 1987-2005... 25 Figure 1.3.4: Transplant source, 1987-2005 ... 27 Figure 1.4.1: Patient survival by year of transplant, 1987-2005... 31 Figure 1.4.2: Patient survival by gender, 1987-2005 ... 31 Figure 1.4.3: Patient survival by age group, 1987-2005 ... 32 Figure 1.4.4: Patient survival by type of transplant, 1987-2005... 32 Figure 1.5.1: Disease-free survival for Acute Myeloid Leukaemia, 1987-2005
(Allogeneic vs. Autologous) ... 33 Figure 1.5.2: Disease-free survival for Acute Lymphoblastic Leukaemia, 1987-2005
(Allogeneic) ... 33 Figure 1.5.3: Disease-free survival for Thalassaemia, 1987-2005 (Allogeneic) ... 34 Figure 1.5.4: Disease-free survival for Non-Hodgkin’s Lymphoma, 1987-2005
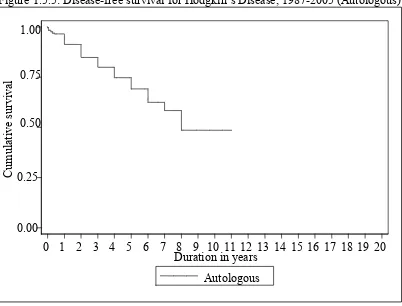
(Allogeneic vs. Autologous) ... 34 Figure 1.5.5: Disease-free survival for Hodgkin’s Disease, 1987-2005 (Autologous).. 35 Figure 1.5.6: Disease-free survival for Chronic Myeloid Leukaemia, 1987-2005
(Allogeneic) ... 35 Figure 1.5.7: Disease-free survival for Aplastic Anaemia, 1987-2005 (Allogeneic) .... 36 Figure 1.5.8: Disease-free survival by age group for Acute Myeloid Leukaemia,
1987-2005... 36 Figure 1.5.9: Disease-free survival by age group for Acute Lymphoblastic Leukaemia,
1987-2005 ... 37 Figure 1.5.10: Disease-free survival by age group for Thalassaemia, 1987-2005... 37 Figure 1.5.11: Disease-free survival by age group for Non-Hodgkin’s Lymphoma,
1987-2005 ... 38 Figure 1.5.12: Disease-free survival by age group for Hodgkin’s Disease, 1987-2005 38 Figure 1.5.13: Disease-free survival by age group for Chronic Myeloid Leukaemia,
1.0 INTRODUCTION
This is the second report on Blood and Marrow Transplant activity recorded by the Blood and Marrow Transplant Registry under the umbrella of the National Transplant Registry.
The registry continues to be of vital importance as it would serve the following purposes:
1. provide an accurate record of the number of haematopoietic stem cell transplantations performed in the country
2. reflect the changing trends in patient numbers, indications for transplant, mode of transplants and centres involved
3. report on the outcome of haematopoietic stem cell transplantation which would allow national and international comparisons
1.1 STOCK AND FLOW
At the time of the second report, a cumulative total of 1048 transplants have been performed by the 9 stem cell transplant centres in the country. The number of transplants recorded in 2005, 145, is an increase over the previous year’s total of 139.
Table 1.1.1: Stock and Flow of Blood and Marrow Transplantation, 1987-2005
Year 87 88 89 90 91 92 93 94 95
New transplant patients 8 6 22 5 12 21 19 25 30
Deaths 1 1 6 6 1 2 9 5 16
Lost to follow up 0 0 0 0 0 0 0 0 0
Alive at 31stDecember 7 12 28 27 38 57 67 87 101
Year 96 97 98 99 00 01* 02 03 04 05
New transplant patients 28 33 49 62 94 108 114 128 139 145
Deaths 11 15 17 15 31 47 30 50 43 39
Lost to follow up 0 0 0 0 0 0 0 0 0 0
Alive at 31stDecember 118 136 168 215 278 338 422 500 596 699**
*1 patient in year transplant 2001 with no death date
**2 patients with missing outcome status and 1 patient with unknown outcome status *Out of 1048 patients who were transplanted, there were 40 patients with early death before day 30 of transplant
Figure 1.1.1: Stock and Flow of Blood and Marrow Transplantation, 1987-2005
N
umber of patients
Year
0 100 200 300 400 500 600 700
New patients Alive at 31st Dec
1987 1988
1989 1990
1991 1992
1993 1994
1995 1996
1997 1998
1999 2000
2001 2002
2003 2004
Table 1.1.2: New Transplant Rate per million population (pmp), 1987-2005
Year 1987 1988 1989 1990 1991 1992 1993 1994 1995 New transplant patients 8 6 22 5 12 21 19 25 30
New transplant rate pmp 0 0 1 0 1 1 1 1 1
Year 1996 1997 1998 1999 2000 2001 2002 2003 2004 2005 New transplant patients 28 33 49 62 94 107 114 128 139 145
New transplant rate pmp 1 2 2 3 4 4 5 5 5 6
Figure 1.1.2: New Transplant Rate per million population (pmp), 1987-2005
N
ew transplant rate, pmp
Year 0
1 2 3 4 5 6
Rate, pmp
The number of transplant centres in the country remains unchanged from the previous year (i.e. 9).
Table 1.1.3: Centre distribution (SDP), 1987-2005
Year 1987 1988 1989 1990 1991 1992 1993 No. % No. % No. % No. % No. % No. % No. %
KLA 0 0 0 0 0 0 0 0 0 0 0 0 0 0
KLP 0 0 0 0 0 0 0 0 0 0 0 0 0 0
UKM 0 0 0 0 0 0 0 0 0 0 0 0 0 0
SJA 0 0 0 0 0 0 0 0 0 0 0 0 0 0
UMA 0 0 0 0 0 0 0 0 0 0 0 0 1 5
UMP 8 100 6 100 22 100 5 100 12 100 21 100 18 95
GMC 0 0 0 0 0 0 0 0 0 0 0 0 0 0 LWE 0 0 0 0 0 0 0 0 0 0 0 0 0 0
SJP 0 0 0 0 0 0 0 0 0 0 0 0 0 0
TOTAL 8 100 6 100 22 100 5 100 12 100 21 100 19 100
Year 1994 1995 1996 1997 1998 1999 2000 No. % No. % No. % No. % No. % No. % No. %
KLA 0 0 0 0 0 0 0 0 0 0 6 10 15 16
KLP 4 16 10 33 11 39 9 27 16 33 19 31 14 15
UKM 0 0 0 0 0 0 0 0 0 0 2 3 9 10
SJA 0 0 0 0 0 0 0 0 0 0 5 8 19 20
UMA 4 16 7 23 6 21 9 27 15 31 11 18 13 14 UMP 17 68 13 43 11 39 15 45 18 37 19 31 24 26 GMC 0 0 0 0 0 0 0 0 0 0 0 0 0 0 LWE 0 0 0 0 0 0 0 0 0 0 0 0 0 0
SJP 0 0 0 0 0 0 0 0 0 0 0 0 0 0
TOTAL 25 100 30 100 28 100 33 100 49 100 62 100 94 100
Year 2001 2002 2003 2004 2005 TOTAL
No. % No. % No. % No. % No. % No. %
KLA 20 19 28 25 35 27 41 29 42 29 187 18
KLP 18 17 20 18 19 15 22 16 21 14 183 17
UKM 12 11 9 8 11 9 15 11 17 12 75 7
SJA 17 16 20 18 23 18 21 15 23 16 128 12
UMA 19 18 16 14 11 9 10 7 14 10 136 13
UMP 22 20 20 18 20 16 16 12 13 9 300 29
GMC 0 0 0 0 0 0 2 1 2 1 4 0
LWE 0 0 0 0 0 0 6 4 1 1 7 1
SJP 0 0 1 1 9 7 6 4 12 8 28 3
Figure 1.1.3: Centre distribution (SDP), 1987-2005
KLA HKL, Adult KLP HKL, Paediatric
UMA UMMC, Adult UMP UMMC, Paediatric
SJA SJMC, Adult UKM Hospital UKM
N
umbe
r
Year 0
10 20 30 40 50 60 70 80 90 100 110 120
KLA KLP UKM
SJA UMA UMP
1.2 RECIPIENTS’ CHARACTERISTICS
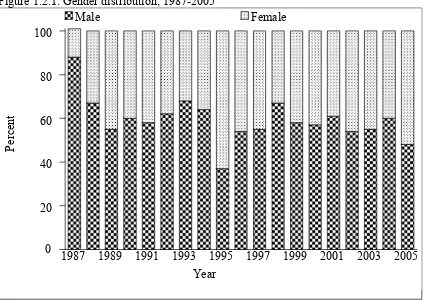
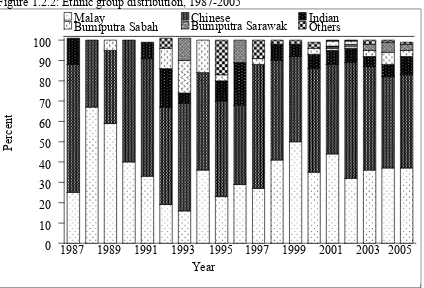
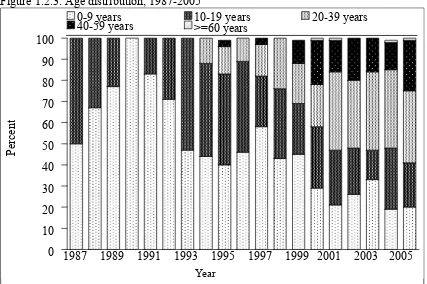
There is a slight female preponderance (48% males, 52% females) (Table 1.2.1). The largest ethnic group of transplant recipients is Chinese followed by Malays and Indians (Table 1.2.2). The young median age reflects the paediatric bias in the registry as transplants first started in paediatric patients and the adult centres started later, in 1993 (Table 1.2.3). However there is an adult preponderance in recent years.
The majority of transplants (about two-thirds) are for malignant disorders and most of these are haematological malignancies like leukaemia and lymphoma (Table 1.2.4). The bulk of non-malignant disorders requiring transplants are thalassaemia and aplastic anaemia.
Table 1.2.1: Gender distribution, 1987-2005
Year 1987 1988 1989 1990 1991 1992 1993 1994 Gender No. % No. % No. % No. % No. % No. % No. % No. %
Male 7 88 4 67 12 55 3 60 7 58 13 62 13 68 16 64
Female 1 13 2 33 10 45 2 40 5 42 8 38 6 32 9 36 TOTAL 8 100 6 100 22 100 5 100 12 100 21 100 19 100 25 100
Year 1995 1996 1997 1998 1999 2000 2001 2002 Gender No. % No. % No. % No. % No. % No. % No. % No. %
Male 11 37 15 54 18 55 33 67 36 58 54 57 66 61 62 54
Female 19 63 13 46 15 45 16 33 26 42 40 43 42 39 52 46 TOTAL 30 100 28 100 33 100 49 100 62 100 94 100 108 100 114 100
Year 2003 2004 2005 TOTAL
Gender No. % No. % No. % No. %
Male 71 55 83 60 69 48 593 57
Female 57 45 56 40 76 52 455 43 TOTAL 128 100 139 100 145 100 1048 100
Figure 1.2.1: Gender distribution, 1987-2005
Percen
t
Year 0
20 40 60 80 100
Male Female
Table 1.2.2: Ethnic group distribution, 1987-2005
Year 1987 1988 1989 1990 1991 1992 1993
Race No. % No. % No. % No. % No. % No. % No. %
Malay 2 25 4 67 13 59 2 40 4 33 4 19 3 16
Chinese 5 63 2 33 8 36 3 60 7 58 10 48 10 53
Indian 1 13 0 0 0 0 0 0 1 8 4 19 1 5
Bumiputra
Sabah 0 0 0 0 1 5 0 0 0 0 2 10 3 16
Bumiputra
Sarawak 0 0 0 0 0 0 0 0 0 0 0 0 2 11
Others 0 0 0 0 0 0 0 0 0 0 1 5 0 0
TOTAL 8 100 6 100 22 100 5 100 12 100 21 100 19 100
Year 1994 1995 1996 1997 1998 1999 2000
Race No. % No. % No. % No. % No. % No. % No. %
Malay 9 36 7 23 8 29 9 27 20 41 31 50 33 35
Chinese 12 48 14 47 11 39 20 61 24 49 26 42 48 51
Indian 0 0 3 10 6 21 0 0 4 8 4 6 7 7
Bumiputra
Sabah 4 16 1 3 0 0 1 3 0 0 0 0 3 3
Bumiputra
Sarawak 0 0 0 0 3 11 0 0 0 0 0 0 0 0
Others 0 0 5 17 0 0 3 9 1 2 1 2 3 3
TOTAL 25 100 30 100 28 100 33 100 49 100 62 100 94 100
Year 2001 2002 2003 2004 2005 TOTAL
Race No. % No. % No. % No. % No. % No. %
Malay 47 44 37 32 46 36 51 37 53 37 383 37
Chinese 48 44 65 57 65 51 63 45 67 46 508 48
Indian 8 7 8 7 6 5 9 6 13 9 75 7
Bumiputra Sabah 1 1 1 1 4 3 8 6 5 3 34 3
Bumiputra Sarawak 1 1 1 1 4 3 7 5 5 3 23 2
Others 3 3 2 2 3 2 1 1 2 1 25 2
Figure 1.2.2: Ethnic group distribution, 1987-2005
Percen
t
Year 0
10 20 30 40 50 60 70 80 90 100
Malay Chinese Indian Bumiputra Sarawak
1987 1989 1991 1993 1995 1997 1999 2001 2003 2005 Others
Table 1.2.3: Age distribution, 1987-2005
Year 1987 1988 1989 1990 1991 1992 1993
Age group No. % No. % No. % No. % No. % No. % No. %
0-9 4 50 4 67 17 77 5 100 10 83 15 71 9 47
10-19 4 50 2 33 5 23 0 0 2 17 6 29 10 53
20-39 0 0 0 0 0 0 0 0 0 0 0 0 0 0
40-59 0 0 0 0 0 0 0 0 0 0 0 0 0 0
>=60 0 0 0 0 0 0 0 0 0 0 0 0 0 0
TOTAL 8 100 6 100 22 100 5 100 12 100 21 100 19 100 Mean 9 7 8 6 6 7 9
SD 4 3 3 3 4 4 5
Median 9 8 8 6 6 6 10
Minimum 2 2 1 2 1 1 1
Maximum 15 10 13 9 13 14 17
Year 1994 1995 1996 1997 1998 1999 2000
Age group No. % No. %. No. % No. % No. % No. % No. %
0-9 11 44 12 40 13 46 19 58 21 43 28 45 27 29
10-19 11 44 13 43 12 43 8 24 16 33 15 24 27 29
20-39 3 12 4 13 3 11 5 15 12 24 12 19 19 20
40-59 0 0 1 3 0 0 1 3 0 0 7 11 20 21
>=60 0 0 0 0 0 0 0 0 0 0 0 0 1 1
TOTAL 25 100 30 100 28 100 33 100 49 100 62 100 94 100
Mean 11 13 11 12 13 17 23
SD 7 9 9 12 10 15 17
Median 11 11 11 6 10 11 18
Minimum 1 3 1 1 5 months 1 1
Maximum 29 41 37 45 39 57 61
Year 2001 2002 2003 2004 2005 TOTAL
Age group No. % No. % No. % No. % No. % No. %
0-9 23 21 30 26 42 33 26 19 29 20 345 33
10-19 28 26 25 22 18 14 41 29 30 21 273 26
20-39 40 37 36 32 47 37 52 37 50 34 283 27
40-59 16 15 23 20 21 16 18 13 35 24 142 14
>=60 1 1 0 0 0 0 2 1 1 1 5 0
TOTAL 108 100 114 100 128 100 139 100 145 100 1048 100
Mean 23 23 22 23 26 19
SD 16 16 15 15 16 15
Median 22 22 23 20 25 14
Minimum 1 month 1 5 months 1 1 1 month
Maximum 64 55 52 70 66 70
Figure 1.2.3: Age distribution, 1987-2005
Percen
t
Year
0 10 20 30 40 50 60 70 80 90 100
0-9 years 10-19 years 20-39 years 40-59 years
Table 1.2.4: Primary Diagnosis, 1987-2005
Year 1987 1988 1989 1990 1991 1992 1993
Diagnosis No. % No. % No. % No. % No. % No. % No. %
Acute leukaemia 5 63 4 67 8 36 6 32 2 40 1 8 4 19
Chronic leukaemia 0 0 0 0 1 5 2 11 1 20 1 8 4 19
Hypoplastic
anaemia 2 25 0 0 4 18 4 21 0 0 4 33 5 24
Erythrocytic
disorders 0 0 0 0 1 5 0 0 1 20 1 8 1 5
Lymphoma 0 0 0 0 0 0 0 0 0 0 0 0 0 0
Solid tumors 0 0 0 0 0 0 1 5 0 0 0 0 3 14
Myelodysplasia 0 0 0 0 0 0 1 5 0 0 0 0 0 0
Haemoglobinopathy 1 13 2 33 7 32 2 11 1 20 4 33 4 19
Multiple myeloma 0 0 0 0 0 0 0 0 0 0 0 0 0 0
Others 0 0 0 0 1 5 3 16 0 0 1 8 0 0
TOTAL 8 100 6 100 22 100 19 100 5 100 12 100 21 100
Year 1994 1995 1996 1997 1998 1999 2000
Diagnosis No. % No. % No. % No. % No. % No. % No. %
Acute leukaemia 8 32 10 33 13 46 37 39 11 33 23 47 28 45
Chronic leukaemia 4 16 5 17 5 18 13 14 6 18 7 14 7 11
Hypoplastic
anaemia 5 20 8 27 4 14 11 12 5 15 4 8 5 8
Erythrocytic
disorders 0 0 0 0 1 4 0 0 0 0 0 0 0 0
Lymphoma 0 0 0 0 0 0 19 20 2 6 5 10 6 10
Solid tumors 1 4 1 3 0 0 2 2 1 3 2 4 5 8
Myelodysplasia 2 8 0 0 0 0 1 1 0 0 1 2 0 0
Haemoglobinopathy 5 20 5 17 5 18 7 7 6 18 2 4 4 6
Multiple myeloma 0 0 0 0 0 0 1 1 0 0 0 0 3 5
Others 0 0 1 3 0 0 3 3 2 6 5 10 4 6
TOTAL 25 100 30 100 28 100 94 100 33 100 49 100 62 100
Year 2001 2002 2003 2004 2005 TOTAL
Diagnosis No. % No. % No. % No. % No. % No. %
Acute leukaemia 48 44 48 42 42 33 46 33 53 37 397 38
Chronic leukaemia 18 17 19 17 19 15 22 16 13 9 147 14
Hypoplastic anaemia 7 6 4 4 5 4 12 9 5 3 94 9
Erythrocytic disorders 0 0 1 1 2 2 0 0 0 0 8 1
Lymphoma 23 21 20 18 28 22 35 25 33 23 171 16
Solid tumors 0 0 3 3 2 2 0 0 2 1 23 2
Myelodysplasia 4 4 4 4 3 2 6 4 4 3 26 2
Haemoglobinopathy 4 4 8 7 17 13 9 6 16 11 109 10
Multiple myeloma 1 1 4 4 4 3 3 2 8 6 24 2
Others 3 3 3 3 6 5 6 4 11 8 49 5
Diagnosis list in the web-application
# Diagnosis Categorise as:
1 Acute leukaemia, unclassified 2 Acute undifferentiated leukaemia 3 ALL
4 AML denovo
5 AML post-chemotherapy 6 AML post-MDS
Acute leukemia
7 Chronic lymphocytic leukaemia
8 Chronic myeloid leukaemia Chronic leukemia 9 Aplastic anaemia
10 Fanconi's anaemia Hypoplastic anemia 11 Diamond-Blackfan anaemia
12 Congenital Dyserythropoeitic Anaemia (CDA) Erythrocytic Disorders 13 Hodgkin's lymphoma
14 Non-Hodgkin's lymphoma, Aggressive 15 Non-Hodgkin's lymphoma, Indolent
Lymphoma
16 Carcinoma, breast 17 Carcinoma, ovary 18 GCT-testicular
19 GCT-primary non-testis 20 Ewing's sarcoma
21 Glioma
22 Hepatoblastoma 23 Neuroblastoma 24 Rhabdomyosarcoma
25 Soft tissue sarcoma (non-RMS) 26 Wilms tumour
27 Primitive NET
Solid tumors
28 Juvenile Myelomonocytic leukaemia 29 Myelodyplastic syndrome (MDS) 30 Myelofibrosis
Myelodysplasia
31 Thalassaemia major
32 Sickle Cell Anaemia Haemoglobinopathy 33 Multiple myeloma Multiple myeloma 34 Haemophagocytic Lymphohistiocytosis Syndrome
35 Congenital Immunodeficiencies 36 Osteopetrosis
37 Others
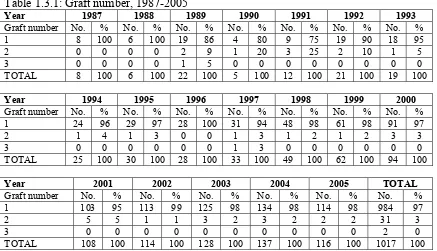
1.3TRANSPLANT PRACTICES
Allogeneic transplants still form the majority of transplants, mostly being sibling related transplants. Autologous transplants are increasing and the number of such transplants has exceeded 50 in 2005.
The increasing use of non-myeloablative transplants has enabled older patients to access allogeneic stem cell transplantation, and the upper age limit for such transplants has been steadily increasing.
The number of unrelated donor transplantation is also showing a slow increase.
Table 1.3.1: Graft number, 1987-2005
Year 1987 1988 1989 1990 1991 1992 1993
Graft number No. % No. % No. % No. % No. % No. % No. %
1 8 100 6 100 19 86 4 80 9 75 19 90 18 95
2 0 0 0 0 2 9 1 20 3 25 2 10 1 5
3 0 0 0 0 1 5 0 0 0 0 0 0 0 0
TOTAL 8 100 6 100 22 100 5 100 12 100 21 100 19 100
Year 1994 1995 1996 1997 1998 1999 2000
Graft number No. % No. % No. % No. % No. % No. % No. %
1 24 96 29 97 28 100 31 94 48 98 61 98 91 97
2 1 4 1 3 0 0 1 3 1 2 1 2 3 3
3 0 0 0 0 0 0 1 3 0 0 0 0 0 0
TOTAL 25 100 30 100 28 100 33 100 49 100 62 100 94 100
Year 2001 2002 2003 2004 2005 TOTAL
Graft number No. % No. % No. % No. % No. % No. %
1 103 95 113 99 125 98 134 98 114 98 984 97
2 5 5 1 1 3 2 3 2 2 2 31 3
3 0 0 0 0 0 0 0 0 0 0 2 0
Figure 1.3.1: Graft number, 1987-2005
Percen
t
Year 0
20 40 60 80 100
Graft number 1 Graft number 2 Graft number 3
Table 1.3.2: Type of transplant, 1987-2005
Year 1987 1988 1989 1990 1991 1992
Type of
transplant No. % No. % No. % No. % No. % No. %
Allogeneic +
Syngeneic 8 100 6 100 21 95 5 100 12 100 20 95
Autologous 0 0 0 0 1 5 0 0 0 0 1 5
TOTAL 8 100 6 100 22 100 5 100 12 100 21 100
Year 1993 1994 1995 1996 1997 1998 1999
Type of
transplant No. % No. % No. % No. % No. % No. % No. %
Allogeneic
+ Syngeneic 18 95 24 96 29 97 26 93 27 82 32 65 44 71
Autologous 1 5 1 4 1 3 2 7 6 18 17 35 18 29
TOTAL 19 100 25 100 30 100 28 100 33 100 49 100 62 100
Year 2000 2001 2002 2003 2004 2005 TOTAL
Type of
transplant No. % No. % No. % No. % No. % No. % No. %
Allogeneic +
Syngeneic 56 60 75 69 75 66 84 66 90 65 88 61 740 71
Autologous 38 40 33 31 39 34 44 34 49 35 56 39 307 29 TOTAL 94 100 108 100 114 100 128 100 139 100 144 100 1047 100
*6 patients with syngeneic type of transplant
Figure 1.3.2: Type of transplant, 1987-2005
N
umbe
r
Year
0 20 40 60 80 100 120 140
Allogeneic + Syngeneic Autologous
1987
Table 1.3.3: Type of transplant by Centre, 1987-2005
Type of transplant Allogeneic + Syngeneic Autologous TOTAL
Centre No. % No. % No. %
KLA 96 13 91 30 187 18
KLP 155 21 28 9 183 17
UKM 45 6 30 10 75 7
SJA 45 6 83 27 128 12
UMA 95 13 41 13 136 13
UMP 272 37 27 9 299 29
GMC 1 0 3 1 4 0
LWE 7 1 0 0 7 1
SJP 24 3 4 1 28 3
TOTAL 740 100 307 100 1047 100
Figure 1.3.3: Type of transplant by Centre, 1987-2005
N
umbe
r
Centre 0
20 40 60 80 100 120 140 160 180 200 220 240 260 280
Allogeneic + Syngeneic Autologous
KLA
Table 1.3.4: Transplant source, 1987-2005
Year 1987 1988 1989 1990 1991
Transplant source No. % No. % No. % No. % No. %
Marrow 8 100 6 100 22 100 5 100 12 100
PBSC / Marrow + PBSC 0 0 0 0 0 0 0 0 0 0
Cord blood / Marrow + cord 0 0 0 0 0 0 0 0 0 0
TOTAL 8 100 6 100 22 100 5 100 12 100
Year 1992 1993 1994 1995 1996
Transplant source No. % No. % No. % No. % No. %
Marrow 21 100 19 100 25 100 30 100 28 100
PBSC / Marrow + PBSC 0 0 0 0 0 0 0 0 0 0
Cord blood / Marrow + cord 0 0 0 0 0 0 0 0 0 0
TOTAL 21 100 19 100 25 100 30 100 28 100
Year 1997 1998 1999 2000 2001
Transplant source No. % No. % No. % No. % No. %
Marrow 24 73 25 51 30 28 37 60 31 33
PBSC / Marrow + PBSC 7 21 23 47 74 69 23 37 57 61 Cord blood / Marrow + cord 2 6 1 2 4 4 2 3 6 6
TOTAL 33 100 49 100 108 100 62 100 94 100
Year 2002 2003 2004 2005 TOTAL
Transplant source No. % No. % No. % No. % No. %
Marrow 31 27 44 34 30 22 23 16 451 43
PBSC / Marrow + PBSC 79 69 79 62 100 72 115 79 557 53
Cord blood / Marrow + cord 4 4 5 4 9 6 7 5 40 4
Figure 1.3.4: Transplant source, 1987-2005
N
umbe
r
0 20 40 60 80 100 120 140
Marrow PBSC/ Marrow+ PBSC Cord blood/ Marrow + cord
Table 1.3.5: HLA Match, 1987-2005
Year 1987 1988 1989 1990 1991
HLA Match No. % No. % No. % No. % No. %
Identical 8 100 6 100 21 100 5 100 12 100
1 AG 0 0 0 0 0 0 0 0 0 0
2 AG 0 0 0 0 0 0 0 0 0 0
>=3 AG Disparate 0 0 0 0 0 0 0 0 0 0
TOTAL 8 100 6 100 21 100 5 100 12 100
Year 1992 1993 1994 1995 1996
HLA Match No. % No. % No. % No. % No. %
Identical 20 100 23 96 29 100 26 100 18 100
1 AG 0 0 1 4 0 0 0 0 0 0
2 AG 0 0 0 0 0 0 0 0 0 0
>=3 AG Disparate 0 0 0 0 0 0 0 0 0 0
TOTAL 20 100 24 100 29 100 26 100 18 100
Year 1997 1998 1999 2000 2001
HLA Match No. % No. % No. % No. % No. %
Identical 25 93 31 97 69 92 40 91 52 93
1 AG 2 7 0 0 4 5 3 7 0 0
2 AG 0 0 1 3 1 1 1 2 4 7
>=3 AG Disparate 0 0 0 0 1 1 0 0 0 0
TOTAL 27 100 32 100 75 100 44 100 56 100
Year 2002 2003 2004 2005 TOTAL
HLA Match No. % No. % No. % No. % No. %
Identical 70 93 79 94 83 92 78 94 695 95
1 AG 3 4 3 4 3 3 4 5 23 3
2 AG 2 3 2 2 4 4 1 1 16 2
>=3 AG Disparate 0 0 0 0 0 0 0 0 1 0
TOTAL 75 100 84 100 90 100 83 100 735 100
Table 1.3.6: Allogeneic Donor Relationship, 1987-2005
Year 1987 1988 1989 1990 1991
Allogeneic Donor Relationship No. % No. % No. % No. % No. %
Sibling 8 100 6 100 21 100 5 100 11 92
Unrelated 0 0 0 0 0 0 0 0 0 0
Others 0 0 0 0 0 0 0 0 1 8
TOTAL 8 100 6 100 21 100 5 100 12 100
Year 1992 1993 1994 1995 1996
Allogeneic Donor Relationship No. % No. % No. % No. % No. %
Sibling 20 100 18 100 22 92 29 100 26 100
Unrelated 0 0 0 0 0 0 0 0 0 0
Others 0 0 0 0 2 8 0 0 0 0
TOTAL 20 100 18 100 24 100 29 100 26 100
Year 1997 1998 1999 2000 2001
Allogeneic Donor Relationship No. % No. % No. % No. % No. %
Sibling 26 96 32 100 72 96 44 100 55 98
Unrelated 1 4 0 0 3 4 0 0 1 2
Others 0 0 0 0 0 0 0 0 0 0
TOTAL 27 100 32 100 75 100 44 100 56 100
Year 2002 2003 2004 2005 TOTAL
Allogeneic Donor Relationship No. % No. % No. % No. % No. %
Sibling 71 95 81 96 81 90 79 91 707 96
Unrelated 4 5 3 4 9 10 8 9 29 4
Others 0 0 0 0 0 0 0 0 3 0
TOTAL 75 100 84 100 90 100 87 100 739 100
1.4TRANSPLANT OUTCOMES
The major cause of death is relapse/underlying disease with sepsis being the second commonest cause of death (Table 1.4.1).
Table 1.4.1: Cause of Death, 1987-2005
Year 1987 1988 1989 1990 1991
Cause of death No. % No. % No. % No. % No. %
Year 1992 1993 1994 1995 1996
Cause of death No. % No. % No. % No. % No. %
Year 1997 1998 1999 2000 2001
In the 2005 report there is inclusion of additional survival estimates. Besides overall survival there is also survival by age, transplant type and key disease entities (leukaemia, lymphoma, aplastic anemia and thalassaemia).
Figure 1.4.1: Patient survival by year of transplant, 1987-2005
Figure 1.4.2: Patient survival by gender, 1987-2005
0.00
0.25 0.50 0.75 1.00
Cumulative surviva
l
0 1 2 3 4 5 6 7 8 9 10 11 12 13 14 15 16 17 18 19 20 Duration in years
Year 1987-1992 Year 1993-1998 Year 1999-2005
1.00
Cumulative surviva
l
0 1 2 3 4 5 6 7 8 9 10 11 12 13 14 15 16 17 18 19 20 Duration in years
Male Female 0.75
0.50
0.25
Figure 1.4.3: Patient survival by age group, 1987-2005
Figure 1.4.4: Patient survival by type of transplant, 1987-2005
0 1 2 3 4 5 6 7 8 9 10 11 12 13 14 15 16 17 18 19 20 Duration in years
Allogeneic + Syngeneic Autologous
Cumulative surviva
l
1.00
0.75
0.50
0.25
0.00
0 1 2 3 4 5 6 7 8 9 10 11 12 13 14 15 16 17 18 19 20 Duration in years
0-9 years 10-19 years 20-39 years >=40 years
Cumulative surviva
l
1.00
0.75
0.50
0.25
1.5DISEASE-FREE SURVIVAL
Figure 1.5.1: Disease-free survival for Acute Myeloid Leukaemia, 1987-2005 (Allogeneic vs. Autologous)
Figure 1.5.2: Disease-free survival for Acute Lymphoblastic Leukaemia, 1987-2005 (Allogeneic)
0.00 0.25 0.50 0.75 1.00
Cumulative surviva
l
0 1 2 3 4 5 6 7 8 9 10 11 12 13 14 15 16 17 18 19 20 Duration in years
Allogeneic
0 1 2 3 4 5 6 7 8 9 10 11 12 13 14 15 16 17 18 19 20 Duration in years
Allogeneic Autologous
Cumulative surviva
l
1.00
0.75
0.50
0.25
Figure 1.5.3: Disease-free survival for Thalassaemia, 1987-2005 (Allogeneic)
Figure 1.5.4: Disease-free survival for Non-Hodgkin’s Lymphoma, 1987-2005 (Allogeneic vs. Autologous)
0 1 2 3 4 5 6 7 8 9 10 11 12 13 14 15 16 17 18 19 20 Duration in years
Allogeneic Autologous
Cumulative surviva
l
1.00
0.75
0.50
0.25
0.00 0.00 0.25 0.50 0.75 1.00
Cumulative surviva
l
0 1 2 3 4 5 6 7 8 9 10 11 12 13 14 15 16 17 18 19 20 Duration in years
Figure 1.5.5: Disease-free survival for Hodgkin’s Disease, 1987-2005 (Autologous)
Figure 1.5.6: Disease-free survival for Chronic Myeloid Leukaemia, 1987-2005 (Allogeneic)
0.00 0.25 0.50 0.75 1.00
Cumulative surviva
l
0 1 2 3 4 5 6 7 8 9 10 11 12 13 14 15 16 17 18 19 20 Duration in years
Allogeneic 0.00
0.25 0.50 0.75 1.00
Cumulative surviva
l
0 1 2 3 4 5 6 7 8 9 10 11 12 13 14 15 16 17 18 19 20 Duration in years
Figure 1.5.7: Disease-free survival for Aplastic Anaemia, 1987-2005 (Allogeneic)
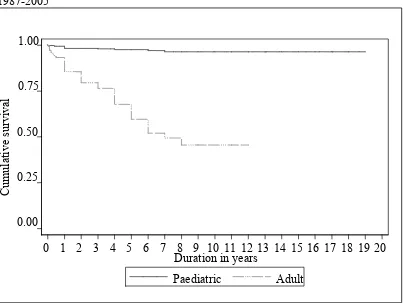
Figure 1.5.8: Disease-free survival by age group for Acute Myeloid Leukaemia, 1987-2005
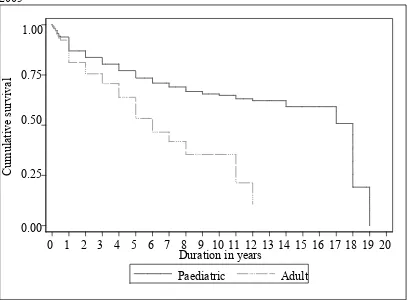
Paediatric is defined as age ≤18 years and adult age >18 years 0.25
0.50 0.75 1.00
Cumulative surviva
l
0 1 2 3 4 5 6 7 8 9 10 11 12 13 14 15 16 17 18 19 20 Duration in years
Paediatric Adult 0.00
0.00 0.25 0.50 0.75 1.00
Cumulative surviva
l
0 1 2 3 4 5 6 7 8 9 10 11 12 13 14 15 16 17 18 19 20 Duration in years
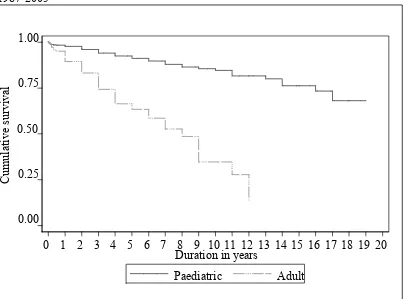
Figure 1.5.9: Disease-free survival by age group for Acute Lymphoblastic Leukaemia, 1987-2005
Paediatric is defined as age ≤18 years and adult age >18 years
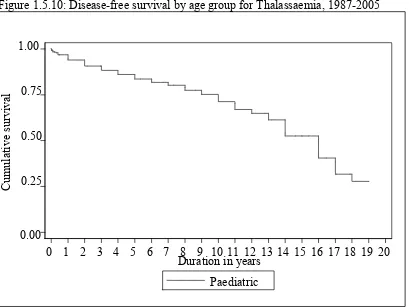
Figure 1.5.10: Disease-free survival by age group for Thalassaemia, 1987-2005
* No adult cases reported for Thalassaemia.
Paediatric is defined as age ≤18 years and adult age >18 years 0.00
0.25 0.50 0.75 1.00
Cumulative surviva
l
0 1 2 3 4 5 6 7 8 9 10 11 12 13 14 15 16 17 18 19 20 Duration in years
Paediatric
0 1 2 3 4 5 6 7 8 9 10 11 12 13 14 15 16 17 18 19 20 Duration in years
Paediatric Adult 1.00
0.75
0.50
0.25
0.00
Cumulative surviva
Figure 1.5.11: Disease-free survival by age group for Non-Hodgkin’s Lymphoma, 1987-2005
Paediatric is defined as age ≤18 years and adult age >18 years
Figure 1.5.12: Disease-free survival by age group for Hodgkin’s Disease, 1987-2005
Paediatric is defined as age ≤18 years and adult age >18 years
0 1 2 3 4 5 6 7 8 9 10 11 12 13 14 15 16 17 18 19 20 Duration in years
Paediatric Adult
Cumulative surviva
l
1.00
0.75
0.50
0.25
0.00
0 1 2 3 4 5 6 7 8 9 10 11 12 13 14 15 16 17 18 19 20 Duration in years
Paediatric Adult 1.00
0.75
0.50
0.25
0.00
Cumulative surviva
Figure 1.5.13: Disease-free survival by age group for Chronic Myeloid Leukaemia, 1987-2005
Paediatric is defined as age ≤18 years and adult age >18 years
Figure 1.5.14: Disease-free survival by age group for Aplastic Anaemia, 1987-2005
Paediatric is defined as age ≤18 years and adult age >18 years
0 1 2 3 4 5 6 7 8 9 10 11 12 13 14 15 16 17 18 19 20 Duration in years
Paediatric Adult
Cumulative surviva
l
1.00
0.75
0.50
0.25
0.00
0 1 2 3 4 5 6 7 8 9 10 11 12 13 14 15 16 17 18 19 20 Duration in years
Paediatric Adult
Cumulative surviva
l
1.00
0.75
0.50
0.25
CHAPTER 2
CORNEAL TRANSPLANTATION
Editors:
Dr. Shamala Retnasabapathy Dr. Choong Yean Yaw Dr. Michael Law Sie Haur
Expert Panel:
Dr. Shamala Retnasabapathy (Chairperson) Dr. Choong Yean Yaw (Co-chairperson)
Dr. Jonathan Choon Siew Cheong Dr. Chuah Kay Leong Dr. Michael Law Sie Haur
Dr. Mariam Ismail Assoc. Prof. S C Reddy Dato’ Dr. Veera Ramani
Dr. Sahimi Sulaiman Dr. U. Thiageswari
Contents
2.0 Introduction
2.1 Cornea Transplant Activities and Trends
• Transplant rates • Type of transplant
2.2 Recipients’ Characteristics
• Demographics • Primary diagnosis
2.3 Transplant Practices 2004 - 2005
• Pre - transplant data • Donor details • Transplant practices
2.4 Cornea Transplant Outcome 2004
• Outcome - Graft Survival • Outcome - Vision
List of Tables
Table 2.1.1: New Transplant Rate per million population (pmp), 1998-2005... 44 Table 2.1.2: Types of Cornea Transplant, 1998-2005 ... 45 Table 2.2.1: Gender distribution, 1998-2005 ... 46 Table 2.2.2: Ethnic distribution, 1998-2005 ... 47 Table 2.2.3: Age distribution of cornea transplant recipient patients, 1998-2005... 48 Table 2.2.4: Primary diagnosis, 1998-2005 ... 49 Table 2.2.5: Indications of cornea transplant, 2004-2005... 50 Table 2.3.1.1: Number of cornea transplants with complete data set ... 51 Table 2.3.2.1: No of previous grafts in grafted eye, 2004-2005 ... 51 Table 2.3.2.2: Ocular co-morbidity, 2004-2005 ... 51 Table 2.3.2.3: Pre-operative vision, 2004-2005... 52 Table 2.3.3.1: Source of Donor Cornea Tissue, 2004-2005 ... 53 Table 2.3.3.2: Donor age distribution, 2004-2005 ... 54 Table 2.3.3.3: Preservation media, 2004-2005 ... 55 Table 2.3.3.4: Cause of death in cornea donors, 2004-2005... 55 Table 2.3.4.1: Type of surgery, 2004-2005... 56 Table 2.3.4.2: Type of Combined surgery, 2004-2005 ... 56 Table 2.3.4.3: Recipient Cornea Trephined Size, 2004-2005 ... 57 Table 2.3.4.4: Difference in trephined sizes of recipient and donor corneas, 2004-2005 ... 57 Table 2.3.4.5: Suture Technique, 2004-2005... 57 Table 2.4.1.1: Stock and flow ... 58 Table 2.4.2.1: Post transplant graft status (Optical and Non-Optical) ... 58 Table 2.4.2.2: Post Transplant graft Status by Optical and Non-Optical Indication ... 58 Table 2.4.2.3: Causes of graft failure... 59 Table 2.4.3.1: Available data on post corneal transplant vision ... 60 Table 2.4.3.2: Post transplant Unaided Vision (Optical and Non-Optical) ... 60 Table 2.4.3.3: Post transplant Best Corrected Visual Acuity (Optical and Non-Optical) ... 61 Table 2.4.3.4: Post transplant Unaided Vision by Optical and Non-Optical indication 63 Table 2.4.3.5: Factors for Post-op Best Corrected Visual Acuity of worse than 6/12... 64 Table 2.5.1: Stock and Flow ... 65 Table 2.5.2: Post transplant complications ... 65 Table 2.5.3: Post transplant graft rejection types... 65
List of Figures
2.0 INTRODUCTION
Cornea transplantation surgery allows restoration of vision in patients with corneal blindness. Corneal transplantation in Malaysia dates back to the 1970’s. Today it is widely performed by ophthalmologists throughout the country both in the government and private sectors with each centre maintaining its own data. Until recently there was no central data collection on a standardised format.
The National Transplant Registry (NTR) was established in December 2003. The cornea transplant section of the NTR was given the task of establishing a systematic centralised data collection centre for all cornea transplantation performed in the country.
A total of 46 centres registered and agreed to provide information on retrospective and prospective cornea transplant activities. A total of 46 contributing surgeons participated in the NTR – Corneal Transplant section. Participation was voluntary.
Retrospective data (from 1998 to 2003) on cornea transplant activities were collected to identify the trend of cornea transplant surgery in the past few years. Retrospective data collected was recorded on the Retrospective Cornea Transplant Notification Form (Form R-mds). This was limited to minimal data set which were i) demographic data, ii) type of cornea transplant surgery and iii) primary diagnosis for cornea transplantation. All surgeons agreed to provide all information required in the retrospective cornea transplant notification form.
Prospective data (from the year 2004) on cornea transplant activities involved gathering information on all cornea transplants performed in Malaysia on two forms. The first form was the i) Cornea Transplant Notification Form (Form N-cds) which is completed at the time of surgery and gathers information on the recipient, operative procedure and the donor. Most surgeons sent a complete data set from 2004 as required in the prospective Cornea Transplant Notification Form. Some surgeons chose to provide only minimal data set as per the retrospective cornea transplant notification form (Form R-mds). The second form was the ii) Cornea Transplant Outcome Form
(Form O-cds) which is completed at the end of 12 months and annually thereafter.
The Corneal section of the NTR will be discussed under 5sections.
Section 2.1 and Section 2.2 covers notification data on cornea transplantation over 8 years from 1998 to 2005. Effort was made to ensure that all cases of cornea transplantation were reported. To the best of our knowledge, this report provides information on all cornea transplants performed in the country.
Section 2.3 covers prospective notification data on cornea transplantation (from 2004 onwards) from surgeons who sent a complete data set.
Section 2.4 covers prospective outcome data on cornea transplantation (from 2004 onwards).
2.1 CORNEA TRANSPLANT ACTIVITIES AND TRENDS (1998 – 2005)
The number of cornea transplants performed showed an increasing trend from 119 in 1998 to 221 in 2001, following which there was a slight decline in 2003 followed by a progressive increase each year to 192 in 2005 (Table 2.1.1).
Penetrating keratoplasty was the most frequent type of cornea transplant surgery and was performed in 94% of cases (Table 2.1.2).
Table 2.1.1: New Transplant Rate per million population (pmp), 1998-2005
Year 1998 1999 2000 2001 2002 2003 2004 2005
New transplants 119 122 126 221 203 165 184 192
New transplant rate pmp 5 5 5 9 8 7 7 7
Figure 2.1.1: New transplant rate, 1998-2005
N
ew transplant rate, pmp
Year
0 1
2 3 4 5 6 7 8 9
Rate, pmp
1998