ABSTRACT
Wulansari. A93213164. 2017. Students Errors in Pronouncing English Vowel
Sounds: An Acoustic Analysis Across Different Levels Of Ability At
UIN Sunan Ampel Surabaya. English Department, State Islamic
University Sunan Ampel Surabaya.
Advisors: Endratno Pilih Swasono, M.Pd.
Key words: Error Analysis, Acoustic Analysis, Phonology, Pronunciation, Vowel
Sound, Praat Software and Vowel Quality.
This study is conducted on the students errors of English pronunciation of
vowels made by three different groups of semester (second, fourth and sixth) at
English Department, State Islamic University Sunan Ampel Surabaya. This
research focuses on six English vowel quality: / /, /æ/, / /, / :/, / /, / :/, based on
the acoustic analysis through their first formant (F1), formant frequencies and the
correlation between the average formant frequencies of Native America to know
the three different groups of students errors in vowel quality. The research
defines this topic because the writer finds that most of students pronounced error
in pronouncing vowels in English words.
In this research, the writer uses a tool to identify the formant frequency of
data sources. It is called Praat Software that used for analyzing speech sound. This
software is designed by Paul Boersma and David Weenink. The writer uses
descriptive quantitative as the design of the research. Data collections technique
uses in this research are recording, collecting the data, identifying, comparing and
counting.
T
✁✂
LE OF CONTENTS
Inside Cover Page
...
. .i
Inside Title Page
..
.. ..ii
Declaration Page .
...iii
Dedication Sheet
.iv
Thesis Advisor s Approval Sheet
..v
Thesis Examiners Approval Sheet
.vi
Motto
..vii
Acknowledgement
viii
Table of Contents
..x
List of Tables
xii
List of Figure
xii
List of Appendices
..xii
Abstract
.xiii
Intisari
..xiv
CHAPTER I: INTRODUCTION
✄ ☎✄✆✝✞✟ ✠✡ ☛☞ ✌✍☛✎✏✑✒✓✏☞ ✍ ✔
.1
1.2 Statement of Research Problem
...6
1.3 Objective of the Study
6
1.4 Significance of the Study
..7
1.5 Scope and Limitation
7
1.6 Definition of Key Terms
...8
CHAPTER II: REVIEW OF RELATED LITERATURE
Theoretical Framework
..9
2.1 Definition of Phonology
...9
2.2 Pronunciation
11
2.3 Errors of pronunciation
..12
2.4 Acoustic Analysis
..13
2.5 Vowels
15
2.5.1 Short Vowels
...15
2.5.2 Long Vowels
.
..16
2.5.3 Diphthongs
16
2.7 Instrument to vowel Quality
..18
2.8 Previous Study
18
CHAPTER III: RESEARCH METHODOLOGY
3.1Research Design
.21
3.2 Research Instrument
..21
3.3 Subject of the Research
..22
3.4 Data and Data Source
.22
3.5 Technique of Data Collection
.23
3.6 Technique of Data Analysis
24
CHAPTER IV: RESEARCH FINDINGS AND DISCUSSION
A. Research Findings
36
1. Description of the Sounds of Vowels
36
2. Description of the Native Pronunciation Data
38
I. The Data Short Vowel / /
.39
II. The Data Short Vowel /æ/
42
III. The Data Short Vowel / /
.45
IV. The Data Short Vowel / /
.48
V. The Data Long Vowel / :/
.51
VI. The Data Long Vowel / :/
.54
3. Description of the three different groups students data
.60
B. Research Discussion
.68
CHAPTER V: CONCLUSION AND SUGGESTION
A. Conclusion
..71
B. Suggestion
...73
REFERENCES
75
CHAPTER I
INTRODUCTION
This chapter presents introduction of the study that explains the reasons
of conducting this research. Besides, it contains the research questions that come
up from some cases, objectives of the study that explain the aims of conducting
this research, significances of the study containing theoretical and practical
benefits. Scope and limitation of the study are also presented in this chapter.
Furthermore, definition of key terms defining the variables used in this research
is also provided in this chapter. The last, this chapter contains the research report
writing organization in which presents the outlines of research report.
1.1 Background of the study
Speaking in a second language involves different skills like grammar,
instruction, vocabulary and pronunciation (Gilakjani, 2011). Goodwin (2001)
said that the most important aspect of language learned by second language and
learners can gain the skill for effective communication in English (Gilakjani,
2011; Ahmadi, 2011). There are many people with strong desire to learn and to
speak English with correct pronunciation (Hassan, 2014). The main problem of
the speakers of other languages who speak English is substitution of sounds
(Hassan, 2014). Many English learners have major difficulties with English
pronunciation even after years of learning the language (Gilakjani, 2011).
2
software, such comparison will be made between the native speakers
production of vowel sounds and the students .
Some vowels are more difficult to identify than others (Peterson and
Barney, 1952; Harold et al, 1995). In this case, According to Ifon, Hasan,
Hastini (2014) Indonesian people often get confused when producing English
words, because there are differences between Indonesian and English. The
differences are in the number of vowel sounds. Indonesians have six vowel
sounds namely /i/, /u/, /o/, /a/, /e/, and / / (Muslich, 2013) while English has
twelve vowel sounds; /i:/, / /, /e/, /æ/, / /, / :/, / /, / :/, / /, /u:/, / :/, and / /. The
researcher only focuses on Indonesian s vowel sounds because she wants to
know the student ability on Indonesian vowel sound by doing a comparing
English vowel sounds.
3
4
5
made by the subjects such as shortening, lengthening and substitutions. The
causes of pronunciation errors made by the subjects are interlingual transfer
that related to the first language interferences and intralingual transfer that
caused by unsuccessfully in learning second language and the lack of
awareness about English phonetics.
6
measuring vowel sound to know the most difficult vowel sounds and the
percentage of English vowel quality of them using praat software. Praat
software is one of tool for knowing the English students ability in pronouncing
English vowels.
1.2 Research Problems
Based on the background and the scope of the study, this research will
answer the following statement of the problems:
1. How the percentage of vowels sound quality are used by three
different levels students of English Literature at UIN Sunan Ampel
Surabaya?
2. What are the most difficult vowel sounds produced by the three
different levels of students?
1.3 Research Objectives
Based on the problems statement mentioned above, these are the following
objective;
1. To investigate and to find the percentage of English vowel quality of
English literature student at the three different levels students at UIN
Sunan Ampel Surabaya. The vowel sound quality will be analyzed
by using Praat Software.
7
1.4 Significances of Research
This study is expected to give valuable contribution theoretically and
practically. Theoretically, the result of this study is expected to contribute on
the development articulation in pronouncing vowel and to development on
phonology and pronunciation theory in linguistics. Practically, the result on
this research is expected to be useful for many people, expecially for three
different levels of students English Department ability. This research will be
useful for the Pronunciation lecturer at UIN Sunan Ampel Surabaya for
knowing the most difficulties pronouncing vowel words and knowing the
influence of pronunciation course in the second semester. Besides, it is hoped
to be useful for other faculty who wants developing the pronunciation in the
vowels sound.
1.5 Scope and limitation Research
This study focuses on analyzing acoustic phonetic of vowels and sound by
three different group students of English Department students at Islamic State
University of Sunan Ampel Surabaya. To avoid a broader and make this research
manageable, the writer limits this study only on the analysis of three different
levels of the students English department ability in pronouncing vowel sound;
/ /, /æ/, / /, / :/, / /, / :/.
1.6 Definition of Key Terms
8
Acoustic phonetic:
Phonetics is the study of how the language sounds are
formed, in the form of vibration frequency, intensity, and timbre, and how
the sounds of language can be received by the ear (O Grady and
Archibald, 2000).
Vowels:
defined in term of position of the tongue and the shape of lips
(Poole).
Three different level students: those students are from second, fourth and
sixth students from English Department at UIN Sunan Ampel Surabaya.
Formant:
the over one pitches that give its distinctive quality in sound
(Lagefoged and Johnson, 2011).
Spectrogram: the display produces of component of sound in computer
program Ladefoged and Johnson, 2011)
Vowel Quality:
The timbre of a vowel (Ladefoged and Johnson, 2011)
Praat Software:
computer software that is used for analyzing vowel speech
✕✖✗✘✙ ✚ ✛✜✜
LITERATURE REVIEW
Theoretical Framework
This chapter consists of theories that underlie the research topic and previous
study.
2.1 Phonology
Phonology is one of the component that compose the discipline of
linguistics (Odden, 2005). Peterson (1982) Phonology is the definition of the
system and pattern of sounds that occurs in a language. According Aarts and
McMahon (2006) Phonetic and phonology are concerned with the ways how
human produces and hears speech. The connection between them is correlated
each other. It is strengthened by Odden (2005) that both phonetic and
phonology are the study about sound system of language. In addition, Poole
(1999) argues, phonology studies about sound in the context of language,
and phonetic is focused with the making of sound which is producing in the
speech of language. Besides that, Ramelan (1994) said that phonology is the
study of phones or speech sounds. There are two studies of phonology;
phonetics and phonemics.
✢
0
are formed, in the form of vibration frequency, intensity, and timbre, and how
the sounds of language can be received by the ear. Based on the breadth of
the scope of phonetics study, phonetic is divided into three types namely
organic phonetics, acoustic phonetics, and auditory phonetics (O Grady and
Archibald, 2000). Supported by
Dew and Jensen (1977) says there are three
kinds of phonetics, those are physiology phonetic, acoustic phonetic, and
auditory phonetic. Aarts (2006) explained that a articulatory phonetics is the
proccess that generate an air-stream which carries linguistic content.
Accoustic phonetics is the physical characteristics of the resulting sound
waves that pass between the speaker s vocal tract and the listener s ear, and a
auditory phonetics is the proccess where by the mechanical movements into
the middle and inner ear and perceived at a cortical level as sound.
In other hand, Malmberg (1963) says that whait is learned in the field
of acoustic phonetics is the sound of language in the terms of sound as
phsycal phenomena, such as studying the frequency of vibration, amplitude,
intensity, and timbre.
In this research, the writer concerns with the acoustic phonetic of
vowel sound. In this way concern with the producing vowel sounds between
the speaker s vocal tract and the listener ear.
2.2 Pronunciation
✣✣
is a system of arbitrary conventionalized vocal, written, or gestural symbols
that allow the members of a given community to communicate intelligibly
one another. Speech is an activity which is carried on in numerous events, and
language is knowledge, a code which is known shared by people who use
their knowledge for transmitting and interpreting massage in these events.
According to Adult Migrant English Program Research Centre journal
(2002), Pronunciation refers to the production of sounds that uses to produce
meaning. It includes attention to the particular sounds of a language
(segments), aspects of speech beyond the level of the individual sound, such
as intonation, phrasing, stress, timing, rhythm.
Christiane Dalton and Barbara Seidlhofer in Pronunciation book
(1994), they stated that pronunciation in general terms as the production of
significant sound in two senses. The first sense is talk about pronunciation as
the production and reception of sound speech. Then the second is talk about
pronunciation with reference to acts of speaking. In the simple word, we can
define pronunciation as a part of speaking skill that related with how to make
correct sounds in order to achieve meaning in context of use. Based on
Corder (1980) Pronunciation is the way in which a word is pronounced.
2.3 Errors of pronunciation
✤ ✥
the errors may occur because the learner does not know what is the correct,
and thus it cannot be self corrected.
The errors in pronouncing English may be viewed as a part of learning
English process for people who speaks English as a foreign language, because
of the errors, they will motivate learn how to correct pronounce well in
English. Lado (1996) stated that common errors in English are usually occur
in every linguistics.
2.4 Acoustic Analyses
Acoustic phonetic is the study that relies on the physical structure of
language sounds and how the human auditory tool to provide reaction to the
sounds of the language (Malmberg, 1963). Acoustic phonetic can analyze
physical of vowel sound of measuring the actual frequencies of the formant
represent graphically (Johnson, 2011). Lagefoged (1982) said that the
average of the number frequencies of the first two formants in American
English vowel.
Johnson (2011) stated that, there is a computer program that can
analyze sounds and shows the components, those components are spectral,
formant, pitch, intensity. The display is called a spectrogram. One of the
webs that can be used to make spectrograms is Praat Software. The praat is
one of computer software that is used to analyze physical properties of
speech and phonetics (acoustic), such as loudness, pitch, and quality.
✦ ✧
Lagefoged and Johnson (2011) stated that the discribing how speech
sound are made, those are the result of the tongue and lips. It means that
these movements as gestures forming particular sound. He also explains that
people can get all of information by gestures of hands that people can see,
but in making speech that people can only hear, people have found a
marvelously efficient way to give information. The gesture of the tongue
and lips are made audible, so that they can be heard and recoqnized.
Making speech gestures audible influences pushing air out of the
lungs while producng a voice in the throut or mouth ( Lagefoged, 2011). He
explains producing air of spech sounds is the respiratory system pushing air
out the lungs.
★ ✩
2.6 Vowels
✪ ✫
Vlack (2004) stated that the place of articulation of vowels is made
especially difficult because in vowels the tongue should not actually touch
any particular place in the mouth. That is there is no physical contact
between the tongue and the mouth in vowels sounds. Vowels are usually
found at the center of a syllable and it is rare to find any sound other than a
vowel which is able to stand alone as a whole syllable (Clark and Yallop,
1995). There are various kinds of English vowel sound, they are short
vowel, long vowel and diphtong. Those are short vowel, long vowel, and
diphthong. According O Connor (1973) classified vowel sound are:
2.6.1 Short vowels
Short vowel means that makes short sounds. There are seven short
vowels in English. The symbol for these short vowel are / /, / , /e/, / / /æ/,
/ /, /
/.
✬
6
just above the fully open position. /
/
lips are lightly and the back of the
tongue is in the fully open position.
2.6.2 Long vowels
Long vowels are the vowels which tend to be longer than the short
vowels in similar context.There are five long vowel sounds in English. The
symbol for these long vowel are /i:/ /u:/ / :/
/ :/ / :/.
/i:/ lips are spread the front of the sides of the tongue touches
molars. /u:/ the back of the tongue is raised the lips are rounded and the
tongue is tense. / :/ lips are relaxed and neutrally spread. The centre of the
tongue is between the half-close and half-open position.
/ :/
lips are loosely
rounded and the back of the tongue is raised to between the half-open and
half-closed position.
/ :/
lips are neutrally open and the tongue is between
the centre and the back in the fully open position.
2.6.3 Diphthongs
According to Jones (2003), a diphthong is a sound that there is a
glide from one to another. A diphthong is also defined as a combination of
vowel sounds that acts like long vowels in one syllable. However,
according Hill and Ure (1962) a diphthong can be a combination of two
vowels even they do not belong to the same syllable.
2.7 Vowel Quality
✭ ✮
differences in quality of a vowel depends on its overtime structure. It means
that a vowel sound sound contain a number of different pitches
stimultaneously. There is pitch which s actually spoken and the various
overtone pitches that gives distinctive quality. He also said that one vowel to
anotherr can be distinguished by the differencess in these overtones. Johnson
(2011) said the overtones are called formant.
Ladefoged (2011) said that there are two features of vowel quality.
They are height and backness that are used to contrast one vowel with
another, and there are other features that are used less frequently. In this case,
the feature of vowel quality based on the explanation of Lagefoged can be
concluded the formant frequency has some affects. Such as frequency of
formant one affect height and frequency of formant two affects backness.
2.8 Instrument to vowel Quality
✯
8
is used to analyze physical properties of speech and phonetics (acoustic), such
as loudness, pitch, and quality. It can be operated in UNIX, LINUX, Max and
Microsoft Windows (Wright and Nichols, 2009).
2.9 Previous Study
Hassan (2014) investigated learners whose first language is Sudanese
Spoken Arabic. The subjects for the study were fifty students from University
of Sudan of Science and Technology (SUST), and thirty university teachers
of English language from the same university. The instruments used for
collecting the data were observation, recordings and a structured
questionnaire. The data collected were analyzed both statistically and
descriptively. The findings of the study revealed that Sudanese Students of
English whose language background is Sudanese Spoken Arabic, had
problems with the pronunciation of English vowels that have more than one
way of pronunciation in addition to the consonant sound contrasts e.g. /z/ and
/ð/, /s/ and / /, /b/ and /p/, / / and /t /. Based on the findings, the study
concluded that factors such as Interference, the differences in the sound
system in the two languages, inconsistency of English sounds and spelling
militate against Sudanese Students of English (SSEs) competence in
pronunciation.
✰
9
problem in this study is kind of errors that students faced in pronouncing
English diphthong and the purpose of this study is to find out the error that
the student faced in pronouncing the English diphthong. Population of this
research is consisted of 7 classes total number 266 students are chosen as the
population, but only 31 students were the subject of research. Instrument that
is used by the writer is a test and recorder to record the pronunciation of
students in conducting tests. In analyzing the data using descriptive analysis
to calculate the percentage of all errors and interpret the results of the data
analysis. There are 3 diphthongs
a
the error number is 63,63%, while the
number of
a
30.54%, 6.08% and then
numbers. So, the results of then
analysis, the most diphthongs that students' errors pronouncing diphthong is
a
.
✳✴ ✵✶✷✸ ✹✺ ✺✺
✹✸✻✸ ✵✹✳✴
M
✸ ✷✴✼✽✾✿❀❁ ❂❃❄ ❅❆❀❇ ❀❁ ❈❆ ❈❃ ❈❅❆❉❁ ❈❆ ❊❈❃❉❆ ❂❋❈❊❀❁ ❈●❈❀❁❍ ❊ ❀❁ ❅❀ ■❅❃❏❃ ❈❊❂✿❀❁❂❃
❆ ❈❃ ❈❅❆❉❁ ❑ ▲❁ ❈ ❆ ❈❃ ❈❅❆❉❁❈❆ ❈▼ ❄ ◆❅❂✿❈❊ ❀❁ ❈ ❖ ❈✿❈❆ ❅◆ ❄❆❍❉❈❃ ❃ ❂✿ ❉❍◆◆❈❉❀ ❂✿ ❖ ❅✿❊
❅✿ ❅◆P◗❂✿❖ ❀❁ ❈ ❊❅❀ ❅❑ ✾❀ ❉❍✿❃❂❃❀ ❈❊ ❍ ❘ ❆❈❃❈❅❆❉❁ ❊❈❃ ❂❖✿ ❇ ❆ ❈❃ ❈❅❆❉❁ ❂✿❃❀❆❏●❈✿❀❇
❃❏ ❋❙❈❉❀❍❘❀❁❈❆❈❃ ❈❅❆❉❁ ❇ ❊❅❀ ❅❅✿❊❊❅❀ ❅❃❍❏❆❉❈❇❀ ❈❉❁ ✿ ❂❚❏❈❍ ❘❊❅❀ ❅❉❍◆◆❈❉❀ ❂✿ ❖❇ ❅✿❊
❀ ❈❉❁✿❂❚❏❈❍ ❘❊❅❀ ❅❅✿ ❅◆P❃ ❂❃❑
❯
.
❱ ✹❲❳❲ ❨❩ ❬❭✽❲❳ ❪❫❴▲❁❂❃ ❃❀❏ ❊P ❉❍✿❉❈❆✿❈❊ ■❂❀❁ ❀❁❈ ❅❉❍❏❃❀ ❂❉❃❄❁❍✿❈❀ ❂❉ ❍✿❀❁❈❵❍ ■❈◆ ❚❏❅◆ ❂❀P
❃❍❏✿❊❅✿❊❃❁❍ ■❈❊❀❁ ❈● ❍❃❀ ❊❂❘❘❂❉ ❏◆❀❵❍ ■❈◆❄ ❆❍❊❏❉❈❊❋P❀❁ ❆ ❈❈❊❂❘❘❈❆❈✿ ❀ ❖❆❍ ❏❄
❃❀❏ ❊❈✿ ❀ ❃ ❍❘
E
✿❖ ◆❂❃❁D
❈❄❅❆❀●❈✿ ❀ ❅❀ ❛❀ ❅❀ ❈ ✾ ❃ ◆❅●❂❉ ❜✿ ❂❵❈❆ ❃ ❂❀P ❝❜✾❞❡ ❍❘❛ ❏✿ ❅✿A
●❄❈◆❛ ❏❆❅❋❅P❅❑ ▲❁ ❈■❆ ❂❀ ❈❆ ●❅❊❈❊❅❀ ❅❅✿❅◆P❃ ❂❃❂✿❀❁ ❈❂❆❄ ❆❍✿❏✿❉❂❅❀ ❂❍✿❑ ▲❁❏❃❇❀❁ ❈■❆❂❀ ❈❆❉❍✿❊ ❏❉❀❈❊❀❁❂❃❆ ❈❃ ❈❅❆❉❁■❂❀❁❊❈❃❉❆ ❂❄ ❀ ❂❵❈❚❏❅✿ ❀❂❀ ❅❀ ❂❵❈●❈❀❁❍❊❑
❯❢❣✹❲❳❲ ❨❩ ❬❭✺❴❳ ❤❩ ✐❥❲❴❤
▲❁❈●❅❂✿ ❂✿❃❀❆❏●❈✿❀ ❍❘ ❀❁❂❃ ❆❈❃❈❅❆❉❁ ■❅❃ ❀❁ ❈ ■❆ ❂❀ ❈❆❑ ✾✿ ❀❁❂❃ ❆❈❃❈ ❅❆❉❁
❂✿ ❃❀❆❏●❈✿ ❀ ❁ ❅❊ ❋❈❈✿ ❀❁❈ ■❆❂❀ ❈❆ ❁❈❆ ❃ ❈◆❘ ❅❃ ❀❁❈ ●❅❂✿ ❆ ❈❃❈❅❆❉❁ ❂✿ ❃❀❆❏●❈✿ ❀
❀❁❆❍❏❖ ❁ ❆❈❉❍❆❊❂✿ ❖❇ ❉❍◆◆❈❉❀ ❂✿ ❖ ❀❁❈ ❊❅❀ ❅❇ ❂❊❈✿❀ ❂❘P❂✿ ❖❇ ❉❍●❄ ❅❆ ❂✿ ❖ ❅✿❊ ❉❍ ❏✿❀ ❂✿ ❖❑
▲❁❈❊❅❀ ❅❖❍❀❘❆❍ ● ❈◆❂❉❂❀ ❅❀❂❍✿ ❑▲❁ ❈❃❈❉ ❍✿❊❅❆P❂✿ ❃❀❆❏●❈✿ ❀ ■❅❃❄❆❅❅❀❃❍ ❘❀■❅❆ ❈❑ ✾❀
❂❃ ❉❍●❄❏❀ ❈❆ ❃❍ ❘❀■❅❆ ❈ ❀❁❅❀ ❂❃ ❏❃❈❊ ❘❍❆ ❅✿ ❅◆P ◗❂✿❖ ❄❁P❃ ❂❉❅◆ ❄ ❆❍❄ ❈❆ ❀ ❂❈❃ ❍❘ ❀❁❈
❄❁❍✿❈❀ ❂❉❃❑✾❀❂❃❏❃❈❊❅❃❅❀❍❍◆❀❍ ❂❊❈✿ ❀ ❂❘P❀❁❈❘❍❆●❅✿❀❘❆ ❈❚❏❈✿❉P❍ ❘❊❅❀ ❅❃❍❏❆❉❈❃
❦❦
❧♠ ❧♥♦♣qrst✉✈t✇r①r ②r③ ④s✇
⑤⑥ ⑦ ⑧ ⑨ ⑩❶⑦❷❸ ❹❺ ❸⑥ ❻⑧ ❼⑦⑧ ⑦❽❼❷⑥ ❾❽⑧ ❸⑥⑦
E
❿ ➀➁❻⑧ ⑥ ➂⑦❽❼❿ ⑦❼⑧ ⑦⑧ ➃⑦❷❻❽➁➁ ➄ ➅ ➆⑧❸⑨➇⑦❿ ❸⑧ ❹❺ ⑧ ⑦❷ ❹❿➇ ➈❺ ❹⑨❼❸ ⑥ ❽❿➇ ⑧ ❻➉❸⑥⑧ ⑦➊⑦⑧ ❸⑦❼ ❹❺
E
❿ ➀➁❻⑧ ⑥D
⑦ ➃❽❼❸➊⑦❿❸❽❸ ➋❸❽❸⑦➌⑧➁❽➊❻❷ ➍❿ ❻➎⑦ ❼⑧ ❻❸ ➄ ❹❺ ➋⑨❿ ❽❿
A
➊➃⑦➁➋⑨ ❼❽ ⑩❽➄❽ ❽❿➇ ➏ ➐ ➃⑦ ❹ ➃➁⑦ ❸⑥❽❸ ❷❽➊⑦ ❺❼ ❹➊A
➊⑦❼❻❷❽➑⑤ ⑥⑦❾ ❼❻❸⑦❼➊⑦❸❸⑥⑦➊❻❿⑧ ❹➊⑦❽❷ ❸❻➎ ❻❸❻⑦⑧❾⑥⑦❿❸⑥ ⑦ ➄❾⑦❼⑦❻❿➋⑨❼❽ ⑩❽ ➄❽➑⑤⑥ ⑦ ➄❷❽➊⑦ ❸ ❹➋⑨❼❽ ⑩❽➄❽ ⑩⑦❷❽⑨ ⑧ ⑦ ❹❺➁⑦❽❼❿ ❻❿ ➀ ❹❺ ➒⑨ ⑧ ➁❻➊❼ ⑦➁❻➀❻ ❹❿ ❽❿➇ ⑥❹➁❻➇❽ ➄➑
⑤⑥ ⑦❿➈ ❸⑥⑦ ❾❼❻❸⑦ ❼ ❽⑧➓⑦➇ ❸⑥ ⑦➊ ❸ ❹ ⑥ ⑦➁ ➃ ❽ ⑩ ❹⑨ ❸ ❸⑥ ❻⑧ ❼ ⑦⑧⑦❽ ❼❷⑥ ❽❿➇ ❸ ❹ ➃❼ ❹❿❹⑨ ❿ ❷⑦
➎ ❹❾⑦➁ ⑧ ❹⑨❿➇⑧➑ ➌❸ ❾❽⑧ ❺ ❹❷⑨ ⑧ ⑦➇ ❹❿
E
❿ ➀➁❻⑧ ⑥ ⑧❸⑨➇⑦❿ ❸⑧ ➔ ❽❸ ➍➌→ ➋⑨ ❿❽❿A
➊➃⑦➁➋⑨❼ ❽ ⑩❽ ➄❽❽ ⑩❻➁❻❸➄❹❺➃❼❹❿❹⑨ ❿❷⑦
E
❿ ➀➁❻⑧⑥➎❹❾⑦➁⑧➑❧♠➣↔③t③③ ↕➙↔③t ③♥ ✉♦④sr ②
➌❿❸⑥❻⑧❼⑦⑧ ⑦❽❼❷⑥➈❸⑥⑦ ➃❼ ❻➊❽❼➄➇❽❸❽❾❽⑧ ❼⑦❷ ❹❼➇❻❿ ➀ ❹❺❾ ❹❼➇⑧❸⑥ ❽❸ ❷ ❹❿ ❸❽❻❿⑦➇
❹❺➎❹❾⑦➁⑧➛➜➛➈ ➛➝➛➈ ➛➞ ➛➈ ➛➟➠ ➛➈ ➛➡ ➛➈ ➛➢➠ ➛➑ ⑤ ⑥⑦⑧ ⑦❷ ❹❿➇❽❼ ➄❾❽⑧❽➁❻⑧ ❸ ❹❺❽➎⑦❼ ❽➀⑦❿❽❸❻➎ ⑦
E
❿ ➀➁❻⑧⑥ ❺❹❼➊❽❿❸⑧➑ ⑤⑥❹⑧ ⑦ ➎ ❹❾⑦➁⑧ ❾⑦❼⑦ ❷⑥ ❹⑧ ⑦❿ ⑩⑦❷❽⑨ ⑧ ⑦ ❸⑥❹⑧ ⑦ ➎❹❾⑦➁ ⑧ ➇❻➇ ❿❹❸❷ ❹❿ ⑧❻⑧ ❸❻❿➌❿➇❹❿⑦⑧ ❻❽❿➑
➇❽❸❽ ❾⑦❼ ⑦ ❾ ❹❼➇⑧ ❾⑥❻❷⑥ ❾⑦❼⑦ ❸❽➓⑦❿ ❺❼ ❹➊ ➃⑥ ❹❿⑦❸❻❷⑧ ❾ ❹❼➇⑧ ❸⑥❽❸ ❷⑥❹⑧ ⑦❿
⑩➄❸⑥⑦ ❾ ❼❻❸⑦❼➑ ⑤⑥ ❹⑧ ⑦❾ ❹❼➇⑧ ❾⑦❼⑦⑧ ⑥ ❹❾❿ ❻❿ ❸⑥ ⑦ ❽ ➃ ➃⑦❿➇❻➉ ❸⑥❽❸ ❾❽⑧ ➇⑦❼❻➎ ⑦➇ ⑩ ➄
➤➆ ➃⑦ ❹ ➃➁⑦ ❻❿ ❸⑥❼⑦⑦ ➇❻❺❺ ⑦❼⑦❿❸ ➀ ❼ ❹⑨➃ ⑧ ❸⑨➇⑦❿ ❸⑧ ❹❺
E
❿➀➁❻⑧ ⑥ ➂❻❸⑦❼ ❽❸⑨❼ ⑦ ❽❸ ➋❸❽❸⑦➥ ➦
➧➨➩ ➫➭ ➯➲ ➳➵
B
➸➺ ➻➫➸➺ ➼➽➸ ➾➧➻➼➸➧➨➲➺ ➭ ➨➺ ➚➸➫A
➯➸➧➻ ➪➨ ➼➭ ➶➧ ➭➩ ➭ ➹➩➪➸ ➼➽➸➯➵ ➘➽➭ ➺ ➸➾➸➧➸ ➯ ➳ ➴➧➻➸➩ ➫➺ ➴➧➭ ➯
A
➯➸➧ ➻➪➨ ➵A
➴➼➸ ➧ ➷➸➼➼➻➩➷ ➼➽ ➸ ➫➨➼➨ ➴➧➭ ➯ ➼➽➸A
➯➸➧➻➪➨➩ ➺➬➼➽➸ ➾➧ ➻➼➸➧ ➪➭ ➯➶ ➨➧➸➫ ➾➻➼➽ ➼➽➸ ➫ ➨➼➨ ➴➧ ➭➯ ➼➽➸
E
➩➷➲➻➺ ➽ ➺ ➼ ➹➫ ➸➩➼➺ ➵ ➮➼ ➾➨➺ ➪➽➭ ➺ ➸➩➱➸➪➨ ➹➺➸➼➽➸➧➸➺ ➸➨➧ ➪➽➸➧➾➨➩ ➼➸➫ ➼➭➚➩ ➭➾➼➽➸➯➭ ➺➼➫➻➴➴➻➪ ➹➲➼✃➭➾➸➲➨➩➫➯ ➸➨➺ ➹➧➸ ➫
➼➽➸✃➭➾➸➲❐ ➹➨➲➻➼ ➳➭➴ ❒❮ ❒➬ ❒❰ ❒➬ ❒Ï ❒➬ ❒ÐÑ ❒➬ ❒Ò ❒➬ ❒ÓÑ ❒➭➴ ➹➩ ➻✃➸➧ ➺➻➼ ➳➺➼ ➹➫➸➩ ➼ ➵➘ ➽➸➾➧ ➻➼➸➧
➨➲➺➭ ➪➭ ➩➺ ➻➫➸➧ ➺ ➼➽➨➼ ÔÕ ➶ ➸➭➶ ➲➸ ➴➧ ➭➯
E
➩➷➲➻➺ ➽ ➺➼ ➹➫➸➩ ➼➺ ➨➩➫ Ö × ➶➸➭ ➶➲➸ ➴➧➭ ➯A
➯➸➧➻➪➨ ➾➸➧ ➸ ➯ ➨➫➸ ➨➪➪ ➹➧➨➼➸ ➨➩➫ ➼➽ ➸ ➳ ➾➨➩ ➼➸➫ ➼➭ ➱➸ ➼➽ ➸ ➺ ➹➱Ø➸➪➼ ➭➴ ➼➽ ➸➧➸➺ ➸➨➧➪➽➵
Ù
.
ÚÛ ÜÝÞßàáâÜãäåæ çæèã ééÜÝç àã ß➘➽➸➫➨➼➨➪➭ ➲➲➸➪➼➸➫➼➽➧➭➹➷➽➺ ➭➯➸➺➼➸➶ ➺ Ñ
Ö➵ ➘➽ ➸ ➾➧➻➼➸➧ ➯ ➨➫➸ ➨ ➲➻➺ ➼ ➭➴ ➾➭ ➧➫➺ ➼➽➨➼ ➱➸ ➹➺ ➸➫ ➻➩ ➧➸➪➭ ➧➫ ➻➩➷➵ ➘ ➽➭ ➺ ➸ ➾➸➧ ➸
➺ ➽➭ ➾➩➻➩➼➽ ➸➨➶➶ ➸➩➫ ➻ê ➸➺ ➵
ë➵ ➘➽ ➸➾➧➻➼➸➧ ➨➺ ➚➸➫ ➼➽ ➸➶ ➨➧➼➻➪➻➶ ➨➩➼ ➴➧➭ ➯➼➽➸
A
➯➸➧➻➪➨➺ ➼➭➧➸➨➫➭➧➶ ➧➭➩ ➭ ➹➩➪➸➼➽➸➾➭➧➫ ➺➼➽➨➼➽➨✃➸➱➸➸➩➫➸➼➸➧➯ ➻➩➸➫➱➳➼➽ ➸➾➧➻➼➸➧➨➩ ➫➧ ➸➪➭➧ ➫➼➽ ➸➯ ➵
ì➵ ➘➽ ➸ ➾➧➻➼➸➧ ➲➭➭➚➸➫ ➴➭ ➧ ➼➽ ➸ ➶➨➧ ➼➻➪➻➶ ➨➩➼ ➴➧➭ ➯ ➼➽ ➧➸➸ ➫➻➴➴➸➧➸➩ ➼ ➷➧ ➭ ➹➶➺ ➭➴
➺ ➼ ➹➫ ➸➩➼➺ ➾➽ ➭ ➪➭➯ ➸ ➴➧➭ ➯
E
➩➷➲➻➺ ➽ í➻➼➸➧ ➨➼➹➧➸ ➪➲➨➺ ➺ ➧➨➩ ➫➭ ➯➲ ➳➵ ➘➽ ➸➩ ➼➽➸➧➸➺ ➸➨➧➪➽ ➸➧➨➺ ➚➸➫➼➭➯ ➸➩➼➻ ➭➩➼➽➭ ➺➸➾➭➧➫ ➺➨➩➫➧ ➸➪➭➧ ➫➼➽ ➸➯ ➵
î ➵
B
➸➴➭➧ ➸ ➧➸➪➭ ➧➫ ➻➩➷E
➩➷➲➻➺ ➽➺ ➼ ➹➫➸➩ ➼➺ ï ✃➭ ➾➸➲ ➺ ➭ ➹➩➫ ➺➬ ➼➽➸ ➾➧➻➼➸➧➨➺ ➚➸➫ ➼➽ ➸➯➨➱➭ ➹➼➾➽➸➼➽ ➸➧ ➼➽➸➳➾➸➧ ➸ ➪➲➭ ➺➸➫ ➼➭
A
➯ ➸➧➻➪ ➨➩➭ ➧ ➭➼➽ ➸➧➺ ➻➩ ➼➽ ➸➻➧ ➺ ➶➸➨ ➚➻➩➷E
➩➷➲➻➺ ➽➬➱➸➪➨ ➹➺ ➸➺ ➽➸➭ ➩➲➳➧ ➸➪➭➧➫ ➸➫➴➭➧A
➯ ➸➧➻➪➨➩➨➪➪➸➩ ➼ ➵×➵ ➘➽ ➸➾➧ ➻➼➸➧➲➭➭➚➸➫➴➭➧❐➹➻➸➼➶➲➨➪➸➼➭➧ ➸➪➭➧➫➼➽➸➾➭ ➧➫➺➱➸➪➨ ➹➺➸➺ ➽➸➾➨➩ ➼➸➫
ñ ò
ó ô õö÷ øùúû÷ù üý þ÷ÿ ûö÷ ü ùûú✁ ú ü ✂ ûý û✄ ☎÷ ✂ ûú✄✂ ûö✄ý ÷ ø✄ ùÿ ý ✁ ✆÷ü ù ✆✝ ü ✂ÿ
ù÷✁ ✄ ùÿûö÷☎ô
✞ ô õö÷ øùúû÷ ùý ü✟ ÷ÿ ûö÷ ù÷✁ ✄ ùÿ ú✂✠ýû✄ ûö÷☎✄✡ ú✆÷ ö✄ ✂÷ü ✂ÿ☎✄✟ ÷ÿ ûö÷ÿü ûü
☛ù ✄☎☎ ✄ ✡ú✆÷ ö✄ ✂÷ û✄ûö÷✆ü û✄ ü ✂ÿù÷ ✂ü☎ ÷ÿ☛ú✆÷øúûöü✂☞☎✡÷ ùô
✌ ô õö÷øùúû÷ ù☎÷üý☞ù÷ÿûö÷ ù÷✁ ✄ ùÿ ú✂✠ü ✆ù÷üÿ✝ý ü✟ ÷ÿú✂ûö÷✆ü û✄ ô
✍ô
A
☛û÷ ù☎÷üý☞ùú✂✠ûö÷ù÷✁ ✄ ùÿú✂✠✎ûö÷ øùúû÷ ùü ✂ü ✆ ✝✏÷ÿü ✆✆✄☛ûö÷ÿü ûü ô✑ ✒✓✔ ✕✖✗✘✙✚✛✕✜✢✣✤✥ ✤✦ ✘✤✧★✩ ✙✩
✪✄☎÷ ý û÷ ý ø÷ ù÷ ûü þ÷ ✂ ú✂ ü ✂ü ✆✝✏ú✂✠ ûö÷ ü✁ ✄☞ý ûú✁ ✁ öü ùü✁ û÷ ù úý ûú✁ û✄
þ ✂✄ øûö÷☎ ✄ý ûÿ ú☛☛ú✁☞✆û✟✄ø÷ ✆ü ✂ÿ ûö÷✟✄ø÷ ✆✫☞ü ✆úû✝✬
✭ ô õ ö÷ øù úû÷ ùÿ ✄ ø✂✆✄üÿ÷ÿ ùüü ûý ✄☛ûøü ù÷ ☛ù✄☎ øøøô ùüü ûô✄ ù✠ ü ✂ÿ ý ü✟÷ÿ
úûú✂ûö÷ý ✄☛ûøü ù÷ú✂ûö÷✆✄✁ü ✆ÿúý þ✮
D
✯ô✰ô õ ö÷øùúû÷ ùù÷ ✂ü☎ ÷ÿûö÷☛✄✆ÿ ÷ ùô
✱ ô ✲☞ûûú✂✠ü ✆✆✄☛ûö÷ÿü ûüù÷✁ ✄ùÿ÷ÿ ú✂û✄ûö÷✆ü û✄ ô
✳ô
C
öü ✂✠ ú✂✠ ûö÷ ÿü ûü ù÷✁ ✄ ùÿú✂✠ û✄ûö÷ ☛✄ù☎ ✄☛ý ÷✁ ûù✄✠ ùü☎ ü ✂ÿ ✠ü✟ ÷ ûö÷ý ÷✁ ûù ✄✠ùü☎☞ý ú✂✠✂☞☎✡÷ ù ô
✴ô ✲ùüü û ý ûü ù û÷ÿ ☛ù✄☎ ûø✄ øú✂ÿ✄øý✬ ùüü û ✄ ✡✵÷✁ ûü ✂ÿ ùüü û ú✁ û☞ù÷ ô
A
✂ÿ✶ ✷
✸✹
C
✺✻✼✽✾✿❀❁ ❂❃❄❀ ❅❆❇> Read from file > Choose file spectrogram
1 > Ok.
❈
6
❉ ❊
❋
8
❍
0
11. For the last click < sel and out > it would be shown picture above.
■ ❏
❑ ▲
▼▼
15. Then the writer made table for making easy to know all the percentage
of every data in the three different groups.
16. The writer made the table for second, fourth and six semester
17. Then the writer made the table of the data value and to know the percentage
of incorrect vowel quality through using formula:
◆ ❖
X 100 =
50
18. After making the table and wrote all of the value frequency between sound
native speaker and sound subject, the writer compared both of them.
19. The writer was made by circle of the incorrect vowel words.
20. The writer counted all of the lower percentage every participant s vowel, and
then found the most difficult vowel.
21. The writer made table for knowing the low percentage of vowel quality and
the most difficult vowels that produced by three different groups of semester
and to know the percentage of incorrect vowel quality through using formula:
P ◗
CHAPTER IV
FINDINGS AND DISCUSSION
❙❚ ❯❱❲❚ ❳❨ ❩❬❭❱❚ ❪ ❫❱❳❴❪ ❵ ❩❩❚❬❭❬❱❵ ❛ ❩❪ ❜❪❴❱ ❬❭❝❳ ❩❯❪ ❞ ❩❪❡❞❪❫❩❚❬❜ ❭❬❢❵❬❞ ❲❣
❪❜❤✐❬❭❯❲❳❞❳❞❥❩❚❬❩❚ ❭ ❬❬❥❯❜❜❬❭ ❬❞ ❩❛ ❬❝❬❛ ❱❱ ❩❵❥❬❞ ❩❱❦❩❚ ❪ ❱ ❬❳ ❭❬ ❱❬ ❲❪❞❥❧❜❪❵❭❩❚❳❞❥
❜ ❯❜ ❩❚❱ ❬✐❬❱❩❬❭♠❙ ❚ ❬❭ ❬❱❵ ❛ ❩❪❜❩❚❬❩❚❭❬❬❥❯❜❜❬❭ ❬❞ ❩❛ ❬❝ ❬❛ ❱❱❩❵❥❬❞❩❱❨ ❬❭❲❬❞❩❳ ♥ ❬❪❜❝ ❪ ❫❬❛
❱❪❵ ❞❥❢ ❵❳❛ ❯❩❣❵ ❱ ❯❞ ♥❨❭❳❳ ❩❱❪❜❩❫❳ ❭❬❳❞❥❩❚ ❬ ❭❬❱❵❛ ❩❪❜❩❚❬✐❪ ❱ ❩❥❯❜❜❯❲❵❛ ❩❝❪❫❬❛
❱❪❵ ❞❥❱❨ ❭❪❥❵ ❲❬❥❴ ❣❩❚❭❬❬❥❯❜❜❬❭ ❬❞ ❩❛ ❬❝ ❬❛ ❱❱ ❩❵❥❬❞ ❩ ❱❪ ❜♦❞ ♥❛ ❯❱❚♣❬❨ ❳ ❭❩✐❬❞ ❩❳ ❩q rs
t❵ ❞❳❞ ❤✐❨❬❛t❵❭❳❴❳ ❣❳♠❙❚❬❞❜ ❯❞ ❳❛❛❣❳ ❩❩❚ ❬❬❞❥❪❜❩❚❯❱❲❚❳❨❩❬❭❩❚❬❭❬❱ ❬❳ ❭❲❚❬❭
❥❯❱❲❵❱ ❱❬❱❩❚❬❜❯❞❥❯❞♥❱❪❜❩❚❬❥❳ ❩❳♠
A. FINDINGS
✉ ✈ ❙ ❚ ❬❥❬❱❲❭ ❯❨ ❩❯❪ ❞❪❜❩❚❬❱❪ ❵❞❥❱❪❜❝ ❪ ❫❬❛ ❱
❙ ❚ ❬❱❪✐❬❞ ❪ ❩❬❱❜❳ ❲❩❱❳❴❪ ❵ ❩❝ ❪ ❫❬❛ ❱❪❵ ❞❥❱♠ ❙ ❚❪❱❬❳ ❭ ❬❝ ❪ ❫ ❬❛ ❱❧❨❯❩❲❚❧
❳❞❥ ❪❝❬❭❩❪ ❞ ❬♠ ✇❪❫❬❛ ❱❧ ❛ ❯❡❬ ❳❛❛ ❱❪ ❵❞❥❱ ❬①❲❬❨❩ ❩❚❬ ❨ ❵ ❭ ❬ ❩❪ ❞ ❬ ❪❜ ❳ ❩❵ ❞ ❯❞♥
❜❪ ❭❡❧ ❚ ❳❝ ❬ ❲❪✐❨ ❛ ❬① ❱ ❩❭❵ ❲❩❵❭❬❱♠ ❙ ❚ ❬ ❨❯❩❲❚ ❳ ❩ ❫❚ ❯❲❚ ❩❚❬ ❝❪❫❬❛ ❯❱ ❳ ❲❩❵❳❛❛ ❣
❱❨❪❡❬❞❧ ❫❚❯❲❚ ❥❬❨ ❬❞❥❱ ❪ ❞ ❩❚❬ ❨❵ ❛❱ ❬❱ ❴ ❬❯❞♥ ❨❭❪❥❵ ❲❬❥ ❴ ❣ ❩❚❬ ❝ ❯❴❭❳ ❩❯❞♥
❝ ❪ ❲❳❛ ❜❪❛❥❱② ❳❞❥ ❧ ❢ ❵ ❯❩❬ ❱ ❬❨ ❳ ❭❳ ❩❬ ❜❭❪✐ ❩❚❯❱❧ ❳❞❥ ❩❚❬ ❪❝❬❭❩❪❞❬ ❨❯❩❲❚ ❬❱ ❩❚ ❳ ❩
❥❬❨ ❬❞❥ ❪ ❞ ❩❚❬ ❱❚ ❳❨ ❬ ❪❜ ❩❚❬ ❭❬❱❪❞ ❳ ❩❯❞ ♥ ❲❳❝ ❯❩❯❬❱ ❪ ❜ ❩❚ ❬ ❝ ❪ ❲❳❛ ❩ ❭❳ ❲❩♠ ❙❚❬❱ ❬
❪ ❝ ❬❭ ❩❪ ❞ ❬❨ ❯❩❲❚❬❱♥❯❝❬❩❚❬❝ ❪ ❫❬❛❯❩❱❥❯❱❩❯❞❲❩❯❝ ❬❢ ❵❳❛ ❯❩❣♠
❙ ❚ ❬ ❝ ❪ ❫❬❛ ❱❪❵ ❞❥❱ ✐❳ ❣ ❴❬ ❱❳ ❯❥ ❪❞ ❳ ❝❳ ❭ ❯❬❩❣ ❪ ❜ ❞ ❪ ❩❬❱ ③❝ ❪ ❯❲❬
❨❯❩❲❚ ❬❱④❧❴❵❩❩❚ ❬❣❳ ❭❬ ❥❯❱ ❩❯❞ ♥❵ ❯❱❚ ❬❥❜❭❪✐❪❞❬❳❞ ❪ ❩❚❬❭❴ ❣❩❫❪ ❲❚ ❳ ❭❳ ❲❩❬❭❯❱ ❩❯❲
37
⑤⑥ ⑦⑧⑨⑩❶❷ ⑦❸❶ ❹❸ ❺❸ ⑧ ❺⑥❷ ❻❼ ⑧❽⑥⑩❶❺❶⑥❷❶ ⑩❸❶ ❻❸ ❾❷ ❿❸ ❶ ❻❸ ➀⑥ ➁ ⑤⑥⑦⑧⑨⑩❶❷ ⑦❸ ❶ ❹❸
❺❸⑧ ❺⑥❷❻❼⑧ ❽⑥⑩❶❺❶⑥ ❷ ❶ ⑩ ⑨⑥⑦➂ ➃❺ ❹⑥ ➁➁ ⑧⑩❽⑥ ❷ ❿ ⑩ ➄❶❷⑤⑧➁⑩ ⑧⑨➅➆ ❺⑥ ⑦❸❾❺ ⑦⑧ ❹❾ ⑨⑨⑧❿
vowel height
❶❷ ❾➁❺❶ ❹❼⑨❾❺⑥➁➅ ❺ ⑧➁ ➇ ⑩➂ ➈❸⑧⑩ ⑧ ❹❸ ❾➁❾ ❹❺ ⑧➁ ❶ ⑩❺❶ ❹ ⑥⑤⑧➁ ❺⑥❷⑧⑩ ❾➁ ⑧❹❾ ⑨⑨⑧❿ ❺❸ ⑧
formants
⑥ ➀ ❺❸⑧ ⑤⑥⑦⑧⑨⑩➉ ❺❸⑧ ⑥ ❷ ⑧ ⑦❶❺❸ ❺❸⑧ ⑨⑥ ⑦⑧➁ ❽ ❶❺ ❹❸➄❿❶ ⑩❺❶❷ ❻❼ ❶ ⑩❸❾ ➊ ⑨⑧ ❶❷ ❹➁⑧❾➋➅ ⑤⑥❶ ❹⑧➆ ➊⑧❶❷❻ ❹❾ ⑨⑨⑧❿ ❺❸⑧
first formant
❾❷ ❿ ❺❸ ⑧❸ ❶ ❻❸ ⑧➁ ⑥❷⑧ ➄❺❸⑧ ⑥❷⑧ ❸⑧❾➁ ❿ ⑦❸⑧❷ ⑦❸ ❶ ⑩❽ ⑧➁ ❶❷ ❻➆ ❺❸⑧
second formant
➄➌❾ ❿ ⑧➀⑥❻⑧❿➍➎ ⑥❸ ❷ ⑩⑥❷➉ ➏➐ ➑ ➑➆ ➂
➒❹❹⑥ ➁ ❿❶❷❻➌❾ ❿ ⑧➀⑥❻⑧❿➉ ➓❶❺ ❹❸ ❹❸❾❷❻⑧⑩❿❼ ⑧❺⑥ ⑤❾➁❶❾❺❶⑥ ❷ ⑩❶❷ ⑨❾➁➅❷ ❻ ⑧❾ ⑨
❾ ❹❺❶ ⑤❶❺➅ ❹❾❷ ⑥ ❹ ❹❼➁ ❶❷❿⑧❽⑧❷ ❿ ⑧❷❺ ⑨➅ ⑥➀ ⑩❺➁⑧⑩⑩ ❹❸❾ ❷ ❻⑧⑩➂ ➈❸⑧ ❹❸ ❾❷❻⑧⑩ ❾➁ ⑧
❾ ⑩ ⑩⑥ ❹❶❾❺ ⑧❿ ⑦❶❺❸ ❺❸⑧ ➁ ❾❺ ⑧ ⑥ ➀ ⑤❶ ➊➁❾❺❶⑥❷ ⑥ ➀ ❺❸⑧ ⑤⑥❹❾ ⑨ ➀⑥ ⑨❿ ⑩➂ ➃❺ ❶ ⑩ ❹❾ ⑨⑨⑧❿ ❺❸ ⑧
voice pitch to distinguish between the characteristic overtones of vowels
(vocal tract pitches) and the rate of vocal fold vibration. Because each
opening and closing of the vocal folds causes a peak of air pressure in the
sound wave, to estimate the pitch of a sound by observing the rate of
occurrence of the peaks in the waveform, to measure that of using the
frequency
of the sound in this way.
Frequency
is a technical term for an
acoustic property of a sound. The unit of frequency measurement is the
hertz, usually abbreviated Hz.
According the explanation above the writer analyzed the data of
using praat software and the writer focused on the first formant, because
the writer wanted to know the naturally sounds that produced by them.
38
39
41
a. The Description of those pictures
42
44
b. The Description of those pictures
45
47
c. The Description of those pictures
48
50
d. The Description of those pictures
Based on the spectrograms above, it is known that the
participant produced in above average for the first formant. It is
because the participant produced correctly. The short vowel of / / lips
are rounded but loosely, while the tongue is relatively relaxed and the
part of the tongue just behind the center is raised. The participant
speech relaxed and proper emphasis. Based on those frequencies, it
can be concluded that the participant produced F1 more than 450 Hz.
It means that the height of the participant is deservedly and the
position of this vowel already in the mid-front vowel.
53
e. The Description of those pictures
Based on the spectrograms above, it is known that the participant
produced in above average for the first formant. It is because the
participant produced correctly. The short vowel of
/ :/
lips are loosely
rounded and the back of the tongue is raised to between the half-open and
half-closed position. The participant speech relaxed and proper emphasis.
Based on those frequencies, it can be concluded that the participant
produced F1 more than 450 Hz. It means that the height of the participant
is deservedly and the position of this vowel already in the mid-open
vowel.
56
f. The Description of those pictures
Based on the spectrograms above, it is known that the
participant produced in above average for the first formant. It is because
the participant produced correctly. The short vowel of / :/ lips are
relaxed and neutrally spread. The centre of the tongue is between the
half-close and half-open position. The participant speech relaxed and
proper emphasis. Based on those frequencies, it can be concluded that
the participant produced F1 more than 450 Hz. It means that the height
of the participant is deservedly and the position of this vowel already in
the mid-front vowel.
[image:64.595.110.517.160.670.2]
57
Table 4.1
THE FREQUENCY DATA OF NATIVE
WORDS
1
2
3
4
5
6
7
8
9
10
BIT
SIT
QUIZ
LICK
TICK
HAT
GAD
GAG
CAB
CAT
MUD
CUP
TUSK
TUSSLE
TUNNEL
CALL
GAIL
BOARD
SAW
FALL
WOOD
PUT
OUT
LUCK
COULD
WORD
FUR
QUIRK
TURN
LEARN
58
airstream process includes all the ways of pushing air out that provide the power
for speech. The possibility of the airstream going out through the mouth. The
movements of the tongue and lips interacting with the roof of the mouth and the
pharynx part of the articulatory prosses.
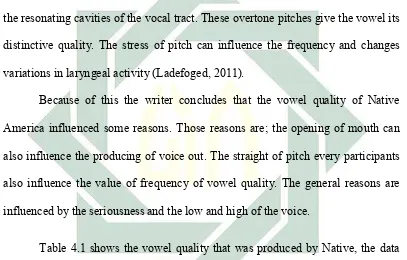
The pitch of vowel speaking which depends on the pulses being produced
by the vibrating vocal folds, and the overtone pitches that depend on the shape of
the resonating cavities of the vocal tract. These overtone pitches give the vowel its
distinctive quality. The stress of pitch can influence the frequency and changes
variations in laryngeal activity (Ladefoged, 2011).
[image:65.595.110.517.271.531.2]Because of this the writer concludes that the vowel quality of Native
America influenced some reasons. Those reasons are; the opening of mouth can
also influence the producing of voice out. The straight of pitch every participants
also influence the value of frequency of vowel quality. The general reasons are
influenced by the seriousness and the low and high of the voice.
59
[image:66.595.137.486.186.682.2]The Average of vowel quality of Native American
Table 4.2
3.
Description of the three different groups students data
VOWEL
WORDS
AVERAGE
/ /
BIT
>400 Hz
SIT
>400 Hz
QUIZ
>400 Hz
LICK
>400 Hz
TICK
>400 Hz
/æ/
HAT
>650 Hz
GAD
>600 Hz
GAG
>600 Hz
CAB
>600 Hz
CAT
>600 Hz
/ /
MUD
>550 Hz
CUP
>550 Hz
TUSK
>550 Hz
TUSSLE
>550 Hz
TUNNEL
>550 Hz
/ :/
CALL
>500 Hz
GAIL
>500 Hz
BOARD
>450 Hz
SAW
>450 Hz
FALL
>450 Hz
/ /
WOOD
>500 Hz
PUT
>500 Hz
OUT
>450 Hz
LUCK
>450 Hz
COULD
>450 Hz
/ :/
WORD
>500 Hz
FUR
>500 Hz
QUIRK
>450 Hz
TURN
>450 Hz
60
61
This table shows all the data frequency that pronounced by second semester
Table 4.3
THE FREQUENCY DATA OF SECOND SEMESTER
WORD
S
1
2
3
4
5
6
7
8
9
10
BIT
417.
1
389.
7
389.
7
417.
7
445.
7
473.
7
473.
7
445.
7
557.
7
473.
7
SIT
417.
1
389.
7
389.
7
445.
7
585.
7
473.
7
473.
7
417.
7
417.
7
473.
7
QUIZ
557.
7
389.
7
389.
7
473.
7
473.
7
417.
7
389.
7
501.
7
529.
7
445.
7
LICK
557.
7
529.
7
473.
7
417.
7
473.
7
529.
7
333.
7
557.
7
529.
7
445.
7
TICK
501.
7
417.
7
417.
7
417.
7
529.
7
529.
7
473.
7
557.
7
473.
7
445.
7
HAT
725.
7
585.
7
473.
7
613.
7
809.
8
753.
7
613.
7
865.
8
585.
7
585.
7
GAD
529.
7
473.
7
473.
7
529.
7
585.
7
641.
7
445.
7
585.
7
585.
7
501.
7
GAG
613.
7
473.
7
557.
7
529.
7
417.
7
641.
7
333.
7
585.
7
613.
7
501.
7
CAB
613.
7
613.
7
445.
7
529.
7
529.
7
557.
7
445.
7
613.
7
613.
7
501.
7
CAT
781.
8
529.
7
585.
7
557.
7
585.
7
669.
7
501.
7
697.
7
557.
7
613,
7
MUD
417.
7
361.
7
585.
7
445.
7
417.
7
837.
8
333.
7
837.
8
389.
7
557.
7
CUP
781.
8
557.
7
585.
7
865.
8
613.
7
837.
8
529.
7
585.
7
697.
7
557.
7
TUSK
781.
8
445.
7
389.
7
669.
7
613.
7
697.
7
305.
7
557.
7
725.
7
557.
7
TUSSLE
865.
8
501.
7
389.
7
641.
7
725.
7
333.
7
221.
7
641.
7
697.
7
501.
7
TUNNE
L
865.
8
361.
7
389.
7
641.
7
7
501.
333.
7
473.
7
809.
8
613.
7
473.
3
CALL
809.
8
501.
7
473.
7
557.
7
445.
7
417.
7
529.
7
809.
7
473.
7
501.
7
GAIL
529.
7
445.
7
417.
7
473.
7
473.
7
361.
1
305.
7
725.
7
501.
7
557.
7
BOARD
529.
62
SAW
445.
7
389.
7
417.
7
445.
7
473.
7
305.
7
473.
7
501.
7
361.
7
557.
7
FALL
697.
7
389.
7
529.
7
445.
7
613.
7
417.
7
641.
7
669.
7
613.
7
417.
7
WOOD
641.
7
389.
7
501.
7
417.
7
529.
7
417.
7
501.
7
613.
7
557.
7
557.
7
PUT
641.
7
389.
7
529.
7
417.
7
529.
7
445.
7
501.
7
613.
7
641.
7
557.
7
OUT
977.
8
557.
7
641.
7
753.
7
641.
7
445.
7
501.
7
921.
8
641.
7
725.
7
LUCK
753.
7
557,
7
557.
7
613.
7
641.
7
445.
7
501.
7
809.
8
417.
7
753.
7
COULD
529.
7
473.
7
529.
7
445.
7
501.
7
501.
7
529.
7
557.
7
557.
7
445.
7
WORD
529.
7
473.
7
473.
7
445.
7
501.
7
361.
7
585.
7
557.
7
557.
7
445.
7
FUR
529.
7
417.
7
585.
7
445.
7
501.
7
389.
7
501.
7
557.
7
613.
7
305.
7
QUIRK
641.
7
277.
7
473.
7
445.
7
585.
7
333.
7
417.
7
501.
7
473.
7
585.
7
TURN
641.
7
417.
7
333.
7
501.
7
529.
7
501.
7
641.
7
669.
7
473.
7
585.
7
LEARN
557.
[image:69.595.108.514.103.731.2]7
361.
7
389.
7
501.
7
473.
7
585.
7
473.
7
613.
7
613.
7
529.
7
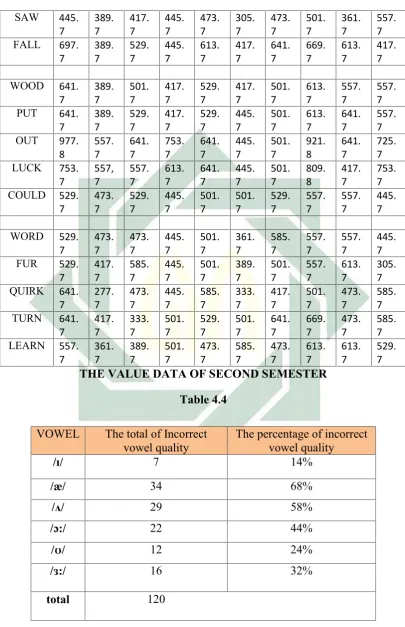
THE VALUE DATA OF SECOND SEMESTER
Table 4.4
VOWEL
The total of Incorrect
vowel quality
The percentage of incorrect
vowel quality
/ /
7
14%
/æ/
34
68%
/ /
29
58%
/ :/
22
44%
/ /
12
24%
/ :/
16
32%
[image:70.595.137.512.232.535.2]
63
Table 4.4 shows that there are 120 English Department students in
second semester made vowel errors. The problem needed more attention is
when the students study pronunciation course in the second semester. The
writer got and counted the percentage of incorrect vowel quality from the
form:
The total of incorrect vowel quality
X 100 =
50
The writer got 14%, 68%, 58%, 44%, 24%, and 32% that form
above. From the table, the writer can see students found difficulties in
pronouncing vowel
/æ/,
the percentage of the population that made this
error is 68%.
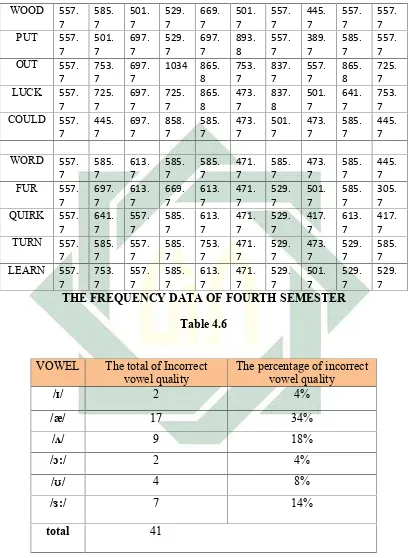
This table shows all the data frequency that pronounced by fourth semester
Table 4.5
64
WORD
S
1
2
3
4
5
6
7
8
9
10
BIT
473.
7
613.
7
725.
7
557.
7
685.
7
473.
7
502.
7
417.
7
613.
7
473.
7
SIT
473.
7
557.
7
725.
7
557.
7
685.
7
473.
7
501.
7
417.
7
529.
7
473.
7
QUIZ
473.
7
361.
7
725.
7
501.
7
685.
7
473.
7
501.
7
417.
7
669.
7
445.
7
LICK
473.
7
361.
7
725.
7
501.
7
685.
7
473.
7
501.
7
417.
7
613.
7
445.
7
TICK
473.
7
529.
7
725.
7
501.
7
685.
7
473.
7
445.
7
417.
7
613.
7
445.
7
HAT
753.
7
529.
7
725.
7
977.
8
809.
8
697.
7
781.
7
417.
7
781.
7
585.
7
GAD
669.
7
501.
7
725.
7
781.
7
781.
7
669.
7
697.
7
445.
7
669.
7
501.
7
GAG
669.
7
501.
7
725.
7
781.
8
753.
7
557.
7
669.
7
445.
7
529.
7
501.
7
CAB
669.
7
501.
7
725.
7
781.
7
781.
8
557.
7
669.
7
445.
7
669.
7
501.
7
CAT
669.
7
725.
7
725.
7
781.
7
781.
8
557.
7
669.
7
445.
7
753.
7
613.
7
MUD
641.
7
305.
7
417.
7
753.
7
557.
7
753.
7
613.
7
445.
7
669.
7
557.
7
CUP
641.
7
725.
7
865.
8
753.
7
865.
8
753.
7
837.
8
557.
7
921.
8
557.
7
TUSK
641.
7
641.
7
697.
7
893.
8
865.
8
529.
7
837.
8
417.
7
585.
7
557.
7
TUSSLE
697.
7
557.
7
501.
7
837.
8
753.
7
725.
7
837.
8
417.
7
557.
7
501.
7
TUNNE
L
697.
7
557.
7
501.
7
753.
7
7
753.
585.
7
837.
8
417.
7
641.
7
473.
7
CALL
697.
7
641.
7
501.
7
753.
7
753.
7
585.
7
781.
8
557.
7
557.
7
501.
7
GAIL
557.
7
501.
7
501.
7
613.
7
641.
7
585.
7
557.
7
445.
7
641.
7
557.
7
BOARD
557.
7
501.
7
501.
7
613.
7
641.
7
585.
7
641.
7
445.
7
641.
7
529.
7
SAW
557.
7
501.
7
501.
7
641.
7
725.
7
641.
7
781.
8
445.
7
697.
7
557.
7
FALL
557.
65
WOOD
557.
7
585.
7
501.
7
529.
7
669.
7
501.
7
557.
7
445.
7
557.
7
557.
7
PUT
557.
7
501.
7
697.
7
529.
7
697.
7
893.
8
557.
7
389.
7
585.
7
557.
7
OUT
557.
7
753.
7
697.
7
1034 865.
8
7
753.
837.
7
557.
7
865.
8
725.
7
LUCK
557.
7
725.
7
697.
7
725.
7
865.
8
473.
7
837.
8
501.
7
641.
7
753.
7
COULD
557.
7
445.
7
697.
7
858.
7
585.
7
473.
7
501.
7
473.
7
585.
7
445.
7
WORD
557.
7
585.
7
613.
7
585.
7
585.
7
471.
7
585.
7
473.
7
585.
7
445.
7
FUR
557.
7
697.
7
613.
7
669.
7
613.
7
471.
7
529.
7
501.
7
585.
7
305.
7
QUIRK
557.
7
641.
7
557.
7
585.
7
613.
7
471.
7
529.
7
417.
7
613.
7
417.
7
TURN
557.
7
585.
7
557.
7
585.
7
753.
7
471.
7
529.
7
473.
7
529.
7
585.
7
LEARN
557.
[image:72.595.108.516.110.668.2]7
753.
7
557.
7
585.
7
613.
7
471.
7
529.
7
501.
7
529.
7
529.
7
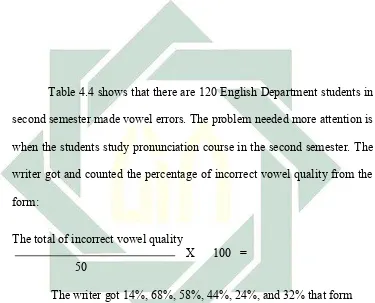
THE FREQUENCY DATA OF FOURTH SEMESTER
Table 4.6
VOWEL
The total of Incorrect
vowel quality
The percentage of incorrect
vowel quality
/ /
2
4%
/æ/
17
34%
/ /
9
18%
/ :/
2
4%
/ /
4
8%
/ :/
7
14%
[image:73.595.127.516.243.535.2]
66
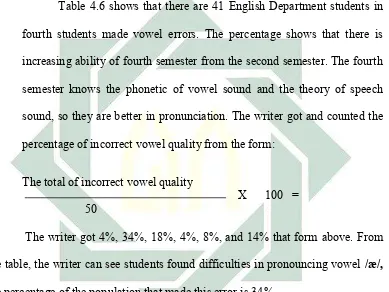
Table 4.6 shows that there are 41 English Department students in
fourth students made vowel errors. The percentage shows that there is
increasing ability of fourth semester from the second semester. The fourth
semester knows the phonetic of vowel sound and the theory of speech
sound, so they are better in pronunciation. The writer got and counted the
percentage of incorrect vowel quality from the form:
The total of incorrect vowel quality
X 100 =
50
The writer got 4%, 34%, 18%, 4%, 8%, and 14% that form above. From
the table, the writer can see students found difficulties in pronouncing vowel
/æ/,
the percentage of the population that made this error is 34%.
This table shows all the data frequency that pronounced by six semester
Table 4.7
THE FREQUENCY DATA OF SIXTH SEMESTER
WORD
S
1
2
3
4
5
6
7
8
9
10
BIT
364.
7
364
511.
6
423
393.
5
9
304.
473.
2
570.
6
482.
1
364.
7
SIT
393.
5
393.
5
541.
1
393.
5
393.
5
482.
1
530.
9
541.
1
482.
1
393.
5
QUIZ
334.
[image:73.595.110.517.633.745.2]67
LICK
393.
5
393.
5
560.
6
334.
4
393.
5
452.
5
473.
2
541.
1
452.
5
393.
5
TICK
452.
5
452.
5
570.
6
304.
9
452.
5
452.
5
530.
9
541.
1
423
452.
5
HAT
541.
1
541.
1
710.
2
718.
2
777.
3
747.
8
530.
9
600.
2
718.
2
541.
1
GAD
511.
6
511.
6
629.
7
304.
9
629.
7
688.
7
530.
9
688.
7
659.
2
511.
6
GAG
393.
5
393.
5
570.
6
304.
9
629.
7
718.
2
530.
9
482.
1
629.
7
393.
5
CAB
482.
2
482.
2
688.
7
364
747.
8
2
718.
530.
9
511.
6
718.
2
482.
2
CAT
482.
1
482.
1
688.
7
570.
6
659.
2
570.
6
530.
9
688.
7
777.
3
482.
1
MUD
275.
4
275.
4
659.
2
334.
4
570.
6
659.
2
530.
9
452.
5
541.
1
570.
6
CUP
541.
1
541.
1
688.
7
777.
3
718.
2
688.
7
530.
9
836.
3
895.
4
718.
2
TUSK
600.
2
600.
2
629.
7
747.
8
777.
3
688.
7
530.
9
806.
8
836.
3
777.
3
TUSSLE
570.
6
570.
6