Journal Homepage: - www.journalijar.com
Article DOI: 10.21474/IJAR01/5547
DOI URL: http://dx.doi.org/10.21474/IJAR01/5547
RESEARCH ARTICLE
STRATEGIES FOR ACCELERATING SECTORAL ECONOMIC GROWTH BASED ON LOCAL POTENTIALS OF REGENCIES IN MADURA.
Taufiq1, Marseto1 and Rusdi H Nugroho2.
1. Lecturer in Faculty of Economic, Study Program of Development Economic, UPN”Veteran” East Java. 2. Lecturer of Business Administration, Faculty of Social and Political Sciences, UPN”Veteran” East Java.
Method Of Research:-
One of approaches used as an instrument in selecting strategy is through SWOT analysis. This analysis is based on logics of maximizing strengths and opportunities, but in the other hand, minimizing weakness and threats. SWOT analysis attempts to compare external and internal factors. External factors include opportunities and threats, whereas internal factors involve strengths and weakness.
It can be said that SWOT analysis consists of four factors, including strengths, weakness, opportunities, and threats. SWOT analysis is very useful to analyze individual and environmental conditions, internal conditions of organization, and external environment. There is relationship across strengths, weakness, opportunities, and threats. SWOT analysis assigns strategy options in four quadrants:
Quadrant I. It is a fortunate situation. Company has opportunities and strengths to exploit existing opportunities. The expected strategy in this situation is to support aggresive growth policy.
Quadrant II. Despite the presence of threats, company still has internal strengths. The desired strategy is to use power to utilize long-term opportunities through diversification strategy (product/market).
Quadrant III. The company has very huge market opportunities, but in other hand, it also faces internal threats or weakness. The suggested strategy is focused on minimizing internal problem of company in order to capture better market share (turn around).
Quadrant IV. It is a situation without fortunes. The company must deal with threats and weakness. The recommended strategy is to perform a recovery step to escape from greater losses (defensive).
In SWOT analysis, internal and external strategic factors are compared to obtain strategy to deal with each factor, and after this, the scoring is conducted. Based on the result of analysis, the focus of recommended strategies is determined.
Strategy Selection Model:-
Pursuant to the model proposed by Boston Consulting Group (BCG), the options of suggested strategy are divided into four, respectively Star, Cash-Cow, Question-Mark, and Moldy. The selected strategy is made with two (2) criteria, respectively market growth and market share. The analysis in current research uses two (2) criteria, including sectoral economic growth and sectoral economic contribution.
Star Strategy is selected if the economic has high sectoral growth and also high sectoral contribution. Star sector needs great supports of capital investment to maximize growth potential. Star sector is considered as “improvident” in investment capital.
Cash-Cow Strategy comes into consideration if the economic has low sectoral growth but with high sectoral contribution. Cash-Cow sector does not need great supports of capital investment. Growth potential of Cash-Cow sector in the future is not greater than Star sector but Cash-Cow sector does not huge supports of new investment capital. This sector needs more policies of intensification.
Moldy Strategy is selected when the economic has low sectoral growth and low sectoral contribution. Question-Mark Strategy is used when sectoral growth of economic is high but with low sectoral contribution.
Result And Discussion:-
1. Review on Economic in Sampang Regency
Review on economic in Sampang Regency involves few macroeconomic indicators, such as: economic growth; the contribution of sectoral economic to PDRB of East Java Province; and the analysis on sectoral basis and sectoral non-basis potentials.
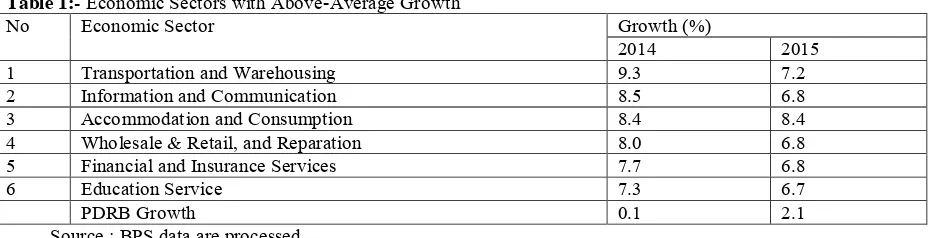
Table 1:- Economic Sectors with Above-Average Growth
No Economic Sector Growth (%)
2014 2015
1 Transportation and Warehousing 9.3 7.2
2 Information and Communication 8.5 6.8
3 Accommodation and Consumption 8.4 8.4
4 Wholesale & Retail, and Reparation 8.0 6.8
5 Financial and Insurance Services 7.7 6.8
6 Education Service 7.3 6.7
PDRB Growth 0.1 2.1
Source : BPS data are processed.
Economic growth of Sampang Regency in 2014 and 2015 reaches for 0.1% and 2.1%. Mean rate is 1.1%, and it is lower than mean rate of East Java economic growth which attains 5.7%. Most of these cconomic sectors, however, show a descending trend of growth. Sector of Transportation and Warehousing is growing at 9.3% in 2014 but declining to 7.2% in 2015. The growth of Sector of Information and Communication has attained 8.5% in 2014, but it decreases to 6.8% in 2015. The economic growth of Sector of Accommodation and Consumption is achieving 8.4% in 2014 and it remains same in 2015. Economic growth of Sector of Wholesale & Retail, and Reparation goes at 8.0% in 2014 but then falls down to 6.8% in 2015. Sector of Financial and Insurance Services grows at 7.7% in 2014 but then declines to 6.8% in 2015. Sector of Education Service is growing at 7.3% in 2014 but decreasing to 6.7% in 2015.
Economic Structure of Sampang Regency:-
Sampang Regency economic structure is understood from the contribution of each economic sector to PDRB of Sampang Regency. The dominant sectors that contribute to Sampang Regency PDRB are set in the following table.
Table 2:- Sectoral Contribution in Sampang Regency
No Economic Sector Contribution (%)
2013 2014 2015
1 Sector of Agriculture, Animal Husbandry, Forestry and Fishery 29.6 30.6 31.4 Subsector of Agriculture, Animal Husbandry, Hunting and Farming
Service
23.0 23.5 24.0
Subsector of Fishery 6.4 6.9 7.3
2 Sector of Mining and Excavation 27.9 24.1 21.7
Subsector of Mining for Oil, Gas and Native Heat 23.0 19.1 16.7
3 Sector of Wholesale & Retail, and Reparation 14.6 15.7 16.4
Subsector of Wholesale & Retail for Automobile/ Motorcycle Wheels
12.9 13.9 14.6
4 Sector of Information and Communication 4.4 4.8 5.0
Source : BPS data are processed.
Sampang Regency economic structure is dominated by four (4) main sectors, such as: Sector of Agriculture, Animal Husbandry, Forestry and Fishery; Sector of Mining and Excavation; Sector of Wholesale & Retail, and Reparation; and Sector of Information and Communication. Contribution mean from Sector of Agriculture, Animal Husbandry, Forestry and Fishery to Sampang Regency PDRB in the last three years (from 2013 to 2015) is 30.5%, followed by Sector of Mining and Excavation with 24.6%, and Sector of Wholesale & Retail, and Reparation with 15.6%. Contribution mean from Sector of Information and Communication is the lowest. Some subsectors have dominant contribution, such as: Subsector of Agriculture, Animal Husbandry, Hunting, and Farming Service with contribution mean of 23.5%; Subsector of Fishery with contribution mean of 6.9%; Subsector of Mining for Oil, Gas and Native Heat with contribution mean of 19.6%; and Subsector of Wholesale & Retail for Automobile/ Motorcycle Wheels with contribution mean of 13.8%.
Analysis on Economic Potentials:-
The analysis on Sampang Regency economic potentials is using parameters of Location Quotient and Klasen Typology.
Location Quotient (LQ) of Sampang Regency
The analysis on leading sectors in Sampang Regency is utilizing Location Quotient (LQ). Result of analysis is presented in the following table.
Table 3:- Index of Location Quotient > 1 for Sampang Regency from 2013 – 2015
No Economic Sector/Subsector 2013 2014 2015 Mean
1 Sector of Agriculture, Animal Husbandry, Forestry and Fishery
2.35 2.48 2.60 2.47
Subsector of Agriculture, Animal Husbandry, Hunting and Farming Service
2.34 2.45 2.56 2.45
Subsector of Fishery 2.84 3.04 3.20 3.02
2 Sector of Mining and Excavation 5.64 5.01 4.40 5.01
Subsector of Mining for Oil, Gas and Native Heat 6.80 5.87 4.92 5.86 Subsector of Mining and Excavation for Other Materials 3.22 3.29 3.34 3.28 3 Sector of Government Administration, Defense, and Warranty 1.80 1.91 2.00 1.90 Source : BPS data are processed.
In the last three years from 2013 to 2015, there are three (3) sectors and four (4) subsectors in the category of basis sector. LQ more than 1 (one) is attained by three sectors, such as: Sector of Agriculture, Animal Husbandry, Forestry and Fishery; Sector of Mining and Excavation; and Sector of Government Administration, Defense, and Warranty. Subsectors in basis sector category are: Subsector of Agriculture, Animal Husbandry, Hunting and Farming Service; Subsector of Fishery; Subsector of Mining for Oil, Gas and Native Heat; and Subsector of Mining and Excavation for Other Materials.
Klasen Typology Analysis:-
Klasen Typology Analysis for Sampang Regency in 2014 and 2015 is displayed in the following table.
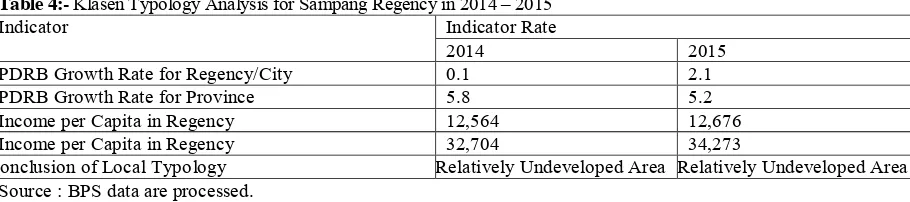
Table 4:- Klasen Typology Analysis for Sampang Regency in 2014 – 2015
Indicator Indicator Rate
2014 2015
PDRB Growth Rate for Regency/City 0.1 2.1
PDRB Growth Rate for Province 5.8 5.2
Income per Capita in Regency 12,564 12,676
Income per Capita in Regency 32,704 34,273
Conclusion of Local Typology Relatively Undeveloped Area Relatively Undeveloped Area Source : BPS data are processed.
In the last two years from 2014 to 2015, based on criteria of Klasen Typology Analysis, Sampang Regency tends to be relatively undeveloped area. Economic growth mean of this regency is lower than that of East Java Province, and so is the mean of its income per capita. Sampang Regency economic growth is 0.1% in 2014 and 2.1% in 2015 whereas economic growth of East Java Province is 5.8% in 2014 and 5.2% in 2015. Sampang Regency income per capita has attained at IDR 12,564 millions in 2014 and IDR 12,676 millions in 2015, while income per capita of East Java Province is IDR 32.704 millions in 2014 and IDR 34.273 millions in 2015.
Strategy Selection Model:-
Table 5:- Strategy Selection Model Based on BCG
No Sector / Subsector Sectoral Growth
(%)
Sectoral
Contribution (%)
Strategy Selection
1 Sector of Agriculture, Animal Husbandry, Forestry and Fishery
4.15 30.53 Star
Subsector of Agriculture, Animal Husbandry, Hunting and Farming Service
3.10 23.50 Star
Subsector of Fishery 7.90 6.86 Star
2 Sector of Mining and Excavation -10.8 24.56 Cash-Cow
Subsector of Mining for Oil, Gas and
3 Sector of Government Administration, Defense, and Warranty
3.9 4.4 Question-Mark
Mean
Of three basis sectors in Sampang Regency, it seems that Sector of Agriculture, Animal Husbandry, Forestry and Fishery is considered as Star Sector. This sector implements strategy of collecting great supports from new investment fund, and therefore, this sector is considered as “improvident” in capital necessity. Despite such improvidence, this Star Sector is the expected sector in Sampang Regency for the future. Two subsectors in Sampang Regency constitute star category, respectively Subsector of Agriculture, Animal Husbandry, Hunting and Farming Service and Subsector of Fishery.
Sector of Mining and Excavation is a sector with characteristic of Cash-Cow. This sector is not adequately promising to produce good expectancy in the future. Despite such weakness, this sector is a relatively good source of growth in Sampang Regency for now. Thus, Sector of Mining and Excavation would not need large amount of new investment fund. Moreover, in Sampang Regency, there is one subsector in cash-cow category, and this is Subsector of Mining for Oil, Gas and Native Heat.
Sector of Government Administration, Defense, and Warranty has question-mark characteristic. This sector has two opportunities, such as emphasizing on growth and facilitating the sector into further development by giving it an injection of capital investment. Selecting policy option may need deep review. In Sampang Regency, one subsector is classified into question-mark category, and this is Subsector of Mining and Excavation for Other Materials.
Review on Economic in Bangkalan Regency:-
The economic of Bangkalan Regency has been reviewed. Macroeconomic indicators determining this economic would involve economic growth; the contribution of sectoral economic to PDRB of East Java Province; and the analysis on sectoral basis and sectoral non-basis potentials.
Added-value derived from Bangkalan Regency economic growth, based on 2010 constant price basis, has reached for IDR 17,369.8 billions in 2014 and IDR 16,907.1 billions in 2015. These numbers equal to 1.58% of East Java economic in 2014 and to 1.12% in 2015, which signifies a fact of reduction by 0.46%.
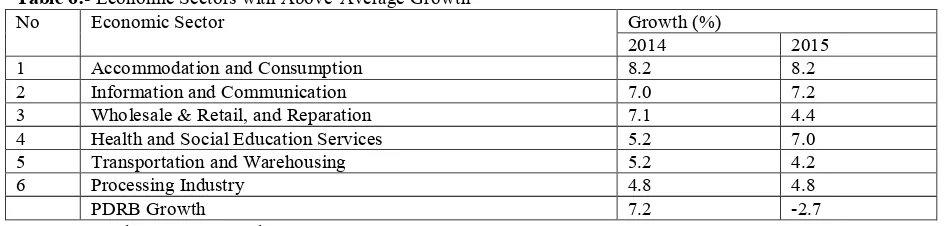
Table 6:- Economic Sectors with Above-Average Growth
No Economic Sector Growth (%)
2014 2015
1 Accommodation and Consumption 8.2 8.2
2 Information and Communication 7.0 7.2
3 Wholesale & Retail, and Reparation 7.1 4.4
4 Health and Social Education Services 5.2 7.0
5 Transportation and Warehousing 5.2 4.2
6 Processing Industry 4.8 4.8
PDRB Growth 7.2 -2.7
Bangkalan Regency economic growth in both 2014 and 2015 is attaining for 7.2% and -2.7% with mean rate of 2.25%. This mean rate seems low compared to that of East Java which stands for 5.7%. The economic sectors of Bangkalan Regency have a more promising trend of growth. Sector of Accommodation and Consumption grows from 8.2% in 2014 and it remains same in 2015. Sector of Information and Communication has grown from 7.0% in 2014 to 7.2% in 2015. However, economic growth of Sector of Wholesale & Retail, and Reparation declines from 7.1% in 2014 to 4.2% in 2015. Economic growth in Sector of Processing Industry remains same in both years which stands for 4.8%.
Economic Structure of Bangkalan Regency:-
The economic structure of Bangkalan Regency is measured from the contribution of economic sectors to Bangkalan Regency PDRB. The following table is outlining some sectors with great contribution to PDRB of Bangkalan Regency.
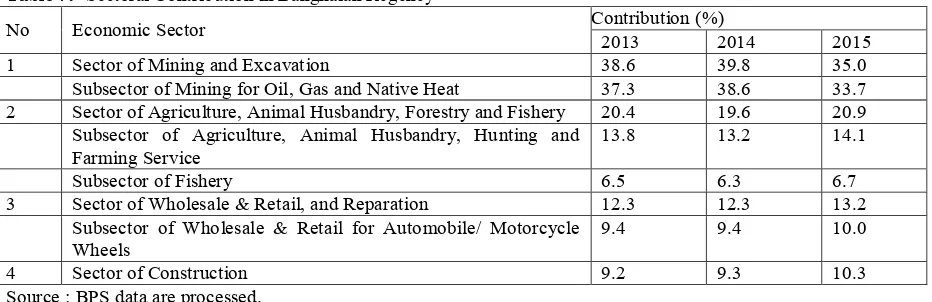
Table 7:- Sectoral Contribution in Bangkalan Regency
No Economic Sector Contribution (%)
2013 2014 2015
1 Sector of Mining and Excavation 38.6 39.8 35.0
Subsector of Mining for Oil, Gas and Native Heat 37.3 38.6 33.7
2 Sector of Agriculture, Animal Husbandry, Forestry and Fishery 20.4 19.6 20.9 Subsector of Agriculture, Animal Husbandry, Hunting and
Farming Service
13.8 13.2 14.1
Subsector of Fishery 6.5 6.3 6.7
3 Sector of Wholesale & Retail, and Reparation 12.3 12.3 13.2
Subsector of Wholesale & Retail for Automobile/ Motorcycle Wheels
9.4 9.4 10.0
4 Sector of Construction 9.2 9.3 10.3
Source : BPS data are processed.
Economic structure of Bangkalan Regency is characterized by four (4) dominant sectors, including Sector of Mining and Excavation; Sector of Agriculture, Animal Husbandry, Forestry and Fishery; Sector of Wholesale & Retail, and Reparation; and Sector of Construction. Mean rate of contribution from Sector of Mining and Excavation to Bangkalan Regency PDRB in the last three years from 2013 to 2015 is 37.8%, as the highest, followed by Sector of Agriculture, Animal Husbandry, Forestry and Fishery with 20.3% and Sector of Wholesale & Retail, and Reparation with 12.6%. Sector of Construction is the lowest and the rate is negligible. Subsectors with dominant contribution can be set in order, such as: Subsector of Mining for Oil, Gas and Native Heat with contribution of 36.53%; Subsector of Agriculture, Animal Husbandry, Hunting, and Farming Service with contribution of 13.7%; and Subsector of Fishery with contribution of 6.5%.
Bangkalan Regency economic structure in the last three years from 2013 to 2015 does not show a great change. The most dominant sector in the economic structure of Bangkalan Regency is Sector of Mining and Excavation.
Analysis on Economic Potentials:-
Economic potentials of Bangkalan Regency have been analyzed using parameters of Location Quotient and Klasen Typology.
Location Quotient (LQ) of Bangkalan Regency
The leading sectors in Bangkalan Regency are analyzed using Location Quotient (LQ). The result is shown in the following table.
Table 8:- Index of Location Quotient > 1 for Bangkalan Regency from 2013 – 2015
No Economic Sector/Subsector 2013 2014 2015 Mean
1 Sector of Agriculture, Animal Husbandry, Forestry and Fishery
1.62 1.59 1.73 1.64
Subsector of Agriculture, Animal Husbandry, Hunting and Farming Service
1.40 1.38 1.51 1.43
2 Sector of Mining and Excavation 7.79 8.25 7.09 7.71 Subsector of Mining for Oil, Gas and Native Heat 11.04 11.83 9.91 10.92 3 Sector of Government Administration, Defense, and
Warranty
1.87 1.86 2.00 1.91
4 Sector of Education Service 1.19 1.15 1.24 1.19
Source: BPS data are processed.
Within Bangkalan Regency, the last three years from 2013 to 2015 have indicated four (4) sectors and three (3) subsectors in the category of basis sector. Sectors with LQ more than 1 (one) include: Sector of Agriculture, Animal Husbandry, Forestry and Fishery; Sector of Mining and Excavation; Sector of Government Administration, Defense, and Warranty; and Sector of Education Service. Subsectors in basis sector category include: Subsector of Agriculture, Animal Husbandry, Hunting and Farming Service; Subsector of Fishery; and Subsector of Mining for Oil, Gas and Native Heat.
Klasen Typology Analysis:-
Klasen Typology Analysis for Bangkalan Regency in 2014 and 2015 is described in the following table.
Table 9:- Klasen Typology Analysis for Bangkalan Regency in 2014 – 2015
Indikator
Indicator Rate
2014 2015
PDRB Growth Rate for Regency/City 7.2 -2.7
PDRB Growth Rate for Province 5.8 5.2
Income per Capita in Regency 18,365 17,717
Income per Capita in Regency 32,704 34,273
Conclusion of Local Typology Fast Developing Area Relatively Undeveloped Area
Source : BPS data are processed.
Based on data in the last two years from 2014 to 2015, and also taking into account the criteria of Klasen Typology Analysis, it can be said that Bangkalan Regency is relatively undeveloped area. It is said so because both mean rates of economic growth and income per capita of Bangkalan Regency is lower than East Java. Economic growth of accelerating economic growth of Bangkalan Regency based on economic sectors and subsectors would be described as following.
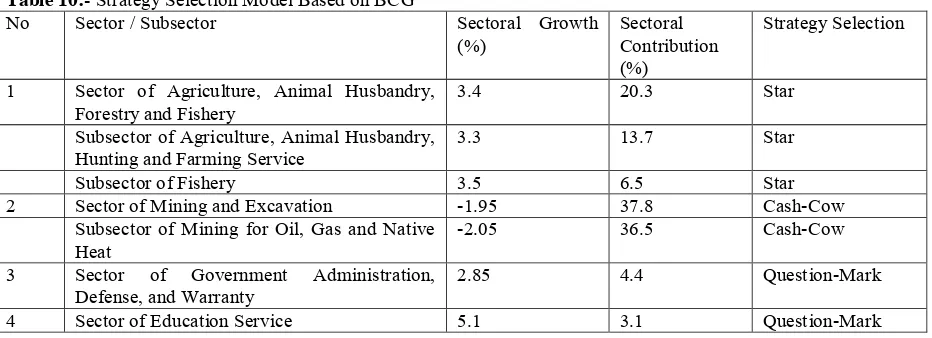
Table 10:- Strategy Selection Model Based on BCG
No Sector / Subsector Sectoral Growth
(%)
3 Sector of Government Administration, Defense, and Warranty
2.85 4.4 Question-Mark
Mean
In Bangkalan Regency, Star Sector post is occupied by Sector of Agriculture, Animal Husbandry, Forestry and Fishery. The selected strategy in this sector is by compiling huge supports from new investment fund, and it can be
said that this sector becomes “improvident” in capital necessity. Although it has such improvidence, this Star Sector
is a sector with the expected future in Bangkalan Regency. Star category in Bangkalan Regency includes two subsectors, respectively Subsector of Agriculture, Animal Husbandry, Hunting, and Farming Service; and Subsector of Fishery.
The post of Cash-Cow Sector is filled by Sector of Mining and Excavation. This sector does not seem adequate to produce the expected future but it is a relatively good source of Bangkalan Regency growth in current days. Sector of Mining and Excavation also does not require large amount of new investment fund. In Bangkalan Regency, only one subsector has a cash-cow characteristic, and this is Subsector of Mining for Oil, Gas and Native Heat.
Question-Mark characteristic is shown by Sector of Government Administration, Defense, and Warranty. This sector has two opportunities, respectively emphasizing on growth and facilitating the sector into further development by giving an injection of capital investment. Deep review is needed before selecting policy option.
Review on Economic in Pamekasan Regency:-
Review on Pamekasan Regency economic concerns with macroeconomic indicators, such as: economic growth; the contribution of sectoral economic to PDRB of East Java Province; and the analysis on sectoral basis and sectoral non-basis potentials.
Added-value given by Pamekasan Regency economic growth, based on 2010 constant price basis, is attaining IDR 8,846.2 billions in 2014 and IDR 9,317.2 billions in 2015. If compared to East Java Province, economic growth of Pamekasan Regency is equivalent to 0.71% in 2014 and 0.73% in 2015. It indicates an increase by 0.02%.
Table 11:- Economic Sectors with Above-Average Growth
No Economic Sector Growth (%)
2014 2015
1 Transportation and Warehousing 10.3 7.6
2 Enterprise Service 10.0 8.0
3 Accommodation and Consumption 8.4 8.1
4 Processing Industry 7.8 7.8
5 Information and Communication 7.6 7.5
6 Real Estate 6.9 6.8
PDRB Growth 5.6 5.3
Source: BPS data are processed.
Economic growth of Pamekasan Regency in 2014 and 2015 has reached 5.6% and 5.3%. Mean rate of this growth is 1.1%, and it must be lower than mean rate of East Java economic growth which stands for 5.7%. Growth trend of economic sectors is mostly declining. Sector of Transportation and Warehousing is growing at 10.3% in 2014 but decreasing to 7.6% in 2015. The growth of Sector of Enterprise Service has attained 10.0% in 2014 but then declined to 8.0% in 2015. Economic growth of Sector of Accommodation and Consumption is achieving 8.4% in 2014 and dropping to 8.1 % in 2015. Economic growth of Sector of Wholesale & Retail, and Reparation goes at 8.0% in 2014 but then falls down to 6.8% in 2015. Sector of Processing Industry grows at 7.8% in 2014 and it remains same in 2015. Sector of Information and Communication is growing at 6.9% in 2014 but decreasing little bit to 6.8% in 2015. Sector of Real Estate has economic growth of 6.9% in 2014 and it also goes down for little to 6.8% in 2015.
Economic Structure of Pamekasan Regency:-
Table 12:- Sectoral Contribution in Pamekasan Regency
No Economic Sector Contribution (%)
2013 2014 2015
1 Sector of Agriculture, Animal Husbandry, Forestry and Fishery 33.3 33.0 32.5 Subsector of Agriculture, Animal Husbandry, Hunting and Farming
Service
24.3 23.8 23.2
Subsector of Fishery 8.9 9.0 9.2
2 Sector of Wholesale & Retail, and Reparation 19.9 20.2 20.6
Subsector of Wholesale & Retail for Automobile/ Motorcycle Wheels
16.2 16.5 17.0
Subsector of Trading for Automobile/Motorcycle and Reparation 3.7 3.7 3.7
3 Sector of Construction 10.2 10.3 10.2
4 Sector of Government Administration, Defense, and Warranty 7.3 7.0 6.9
Source: BPS data are processed.
Pamekasan Regency economic structure is dominated by four (4) main sectors, such as: Sector of Agriculture, Animal Husbandry, Forestry and Fishery; Sector of Wholesale & Retail, and Reparation; Sector of Construction; and Sector of Government Administration, Defense, and Warranty. The highest contribution mean to Pamekasan Regency PDRB in the last three years (from 2013 to 2015) is given by from Sector of Agriculture, Animal Husbandry, Forestry and Fishery with 32.9%, followed by Sector of Wholesale & Retail, and Reparation with 20.2%, Sector of Construction with 10.2%, and Sector of Government Administration, Defense, and Warranty with 7.06%. Some subsectors already have dominant contribution, such as: Subsector of Agriculture, Animal Husbandry, Hunting, and Farming Service with contribution of 23.7%; Subsector of Fishery with contribution of 9.03%; Subsector of Wholesale & Retail for Automobile/ Motorcycle Wheels with contribution of 16.5%; and Subsector of Trading for Automobile/Motorcycle and Reparation with contribution of 3.7%.
In general, economic structure of Pamekasan Regency in the last three years, from 2013 to 2015, is not greatly changing. The most dominant sector in this regency is Sector of Agriculture, Animal Husbandry, Forestry, and Fishery.
Analysis on Economic Potentials:-
The analysis on Pamekasan Regency economic potentials is using parameters of Location Quotient and Klasen Typology.
Location Quotient (LQ) of Pamekasan Regency:-
The analysis on leading sectors in Pamekasan Regency is utilizing Location Quotient (LQ). Result of analysis is indicated as following.
Table 3:- Index of Location Quotient > 1 for Pamekasan Regency from 2013 – 2015
No Economic Sector/Subsector 2013 2014 2015 Mean
1 Sector of Government Administration, Defense, and Warranty 3.04 3.06 3.01 3.03 2 Sector of Agriculture, Animal Husbandry, Forestry and
Fishery
2.64 2.67 2.68 2.66
Subsector of Agriculture, Animal Husbandry, Hunting and Farming Service
Klasen Typology Analysis:-
Klasen Typology Analysis for Pamekasan Regency in 2014 and 2015 is displayed in the following table.
Table 14:- Klasen Typology Analysis for Pamekasan Regency in 2014 – 2015
Indicator Indicator Rate
2014 2015
PDRB Growth Rate for Regency/City 5.6 5.3
PDRB Growth Rate for Province 5.8 5.2
Income per Capita in Regency 10,579 11,022
Income per Capita in Regency 32,704 34,273
Conclusion of Local Typology Relatively Undeveloped Area Fast Developing Area Source : BPS data are processed.
In the last two years from 2014 to 2015, based on criteria of Klasen Typology Analysis, Pamekasan Regency is considered as relatively undeveloped area in 2014 but it successfully becomes fast developing area in 2015. Pamekasan Regency economic growth is 5.6% in 2014 and 5.3% in 2015 whereas economic growth of East Java Province is 5.8% in 2014 and 5.2% in 2015. Meanwhile, Pamekasan Regency income per capita has attained at IDR 32,704 millions in 2014 and IDR 34,273 millions in 2015, while income per capita of East Java Province is IDR 32.704 millions in 2014 and IDR 34.273 millions in 2015.
Strategy Selection Model:-
After adopting model suggested by Boston Consulting Group (BCG), some strategies are then selected to accelerate economic growth of Pamekasan Regency. Strategies selected based on economic sectors and subsectors are described in the following.
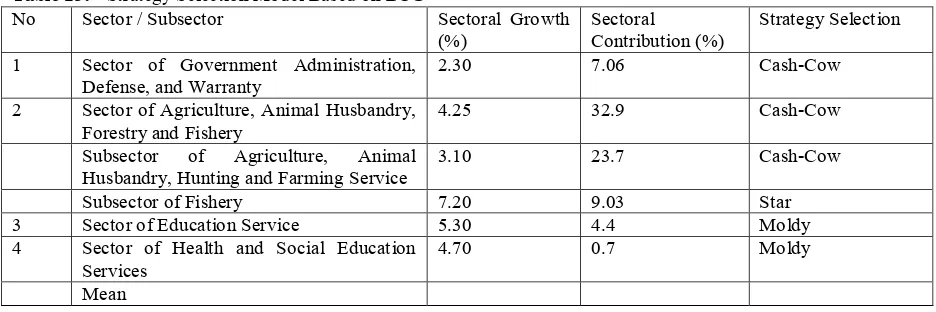
Table 15:- Strategy Selection Model Based on BCG
No Sector / Subsector Sectoral Growth
(%)
Sectoral
Contribution (%)
Strategy Selection
1 Sector of Government Administration, Defense, and Warranty
2.30 7.06 Cash-Cow
2 Sector of Agriculture, Animal Husbandry, Forestry and Fishery
4.25 32.9 Cash-Cow
Subsector of Agriculture, Animal Husbandry, Hunting and Farming Service
Of basis category existing in Pamekasan Regency, it seems that only Subsector of Fishery is given a status of Star. This subsector implements strategy of enlisting supports by collecting new investment fund, and therefore, this
subsector is considered as “improvident” in capital necessity. Despite such unfavorable characteristic, it is the
expected business in Pamekasan Regency in the future.
Both Sector of Education Service and Sector of Health and Social Education Services are assigned into moldy sectors. Both shall not be adequately promising to produce good expectancy either at now or in the future. They are
“negligible” and thus, do not need great amount of investment fund. They are also incapable of giving maximum
result either in present days or in the future.
Review on Economic in Sumenep Regency:-
The economic of Sumenep Regency has been subjeted to a review. Macroeconomic indicators of this economic involve economic growth; the contribution of sectoral economic to PDRB of East Java Province; and the analysis on sectoral basis and sectoral non-basis potentials.
Added-value derived from Sumenep Regency economic growth, based on 2010 constant price basis, has attained as IDR 21,476.8 billions in 2014 and IDR 21,750.5 billions in 2015. These numbers are equivalent with 1.56% of East Java economic in 2014 and to 1.59% in 2015, and these signify an increase of 0.03%.
Table 16:- Economic Sectors with Above-Average Growth
No Economic Sector Growth (%)
2014 2015
1 Information and Communication 12.5 7.6
2 Accommodation and Consumption 9.8 9.6
3 Transportation and Warehousing 9.6 9.1
4 Financial and Insurance Services 9.3 8.4
5 Health and Social Education Services 8.7 8.9
6 Education Service 8.7 8.5
PDRB Growth 6.2 1.3
Source : BPS data are processed.
Sumenep Regency economic growth in both 2014 and 2015 is attaining for 6.2% and 1.3% with mean rate of 3.75%. This mean rate seems lower if compared to that of East Java which stands for 5.7%. Unfortunately, economic sectors in Sumenep Regency have a trend of decline. The growth of Sector of Information and Communication declines from 12.5% in 2014 to 7.6% in 2015. Sector of Accommodation and Consumption has its growth declining from 9.8% in 2014 to 9.6% in 2015. Economic growth of Sector of Transportation and Warehousing decreases from 9.6% in 2014 and 9.1% in 2015. Sector of Financial and Insurance Services grows at 9.3% in 2014 but it goes down at 8.4% in 2015. Sector of Health and Social Education Services indicates an increasing growth from 8.7% in 2014 and 8.9% in 2015. Sector of Education Service experiences a decrease from 8.7% in 2014 and 8.5% in 2015.
Economic Structure of Sumenep Regency:-
The economic structure of Sumenep Regency has been measured from the contribution of economic sectors to Sumenep Regency PDRB. The following table displays some sectors with great contribution to PDRB of Sumenep Regency.
Table 17:- Sectoral Contribution in Sumenep Regency
No Economic Sector Contribution (%)
2013 2014 2015
1 Sector of Agriculture, Animal Husbandry, Forestry and Fishery 33.0 32.1 33.0 Subsector of Agriculture, Animal Husbandry, Hunting and
Farming Service
20.0 19.4 19.6
Subsector of Fishery 12.8 12.4 13.1
2 Sector of Mining and Excavation 31.5 32.0 29.3
Subsector of Mining for Oil, Gas and Native Heat 29.0 29.7 26.9
3 Sector of Wholesale & Retail, and Reparation 10.3 10.4 10.9
Subsector of Wholesale & Retail for Automobile/ Motorcycle Wheels
8.1 8.2 8.7
4 Sector of Construction 5.9 5.9 6.0
Source : BPS data are processed.
Reparation with 10.5%; and Sector of Construction with 5.9%. Some subsectors have dominant contribution, such as: Subsector of Agriculture, Animal Husbandry, Hunting, and Farming Service with contribution of 19.6%; Subsector of Fishery with contribution of 12.7%; Subsector of Mining for Oil, Gas and Native Heat with contribution of 28.5%; and Subsector of Wholesale & Retail, and Reparation with contribution of 8.3%.
In general, Sumenep Regency economic structure in the last three years from 2013 to 2015 does not indicate a great change. The most dominant sector in the economic structure of Sumenep Regency is Sector of Agriculture, Animal Husbandry, Forestry and Fishery.
Analysis on Economic Potentials:-
Economic potentials of Sumenep Regency are analyzed using parameters of Location Quotient and Klasen Typology.
Location Quotient (LQ) of Sumenep Regency
The leading sectors in Sumenep Regency are subjected to analysis with Location Quotient (LQ). The result is indicated in the following table.
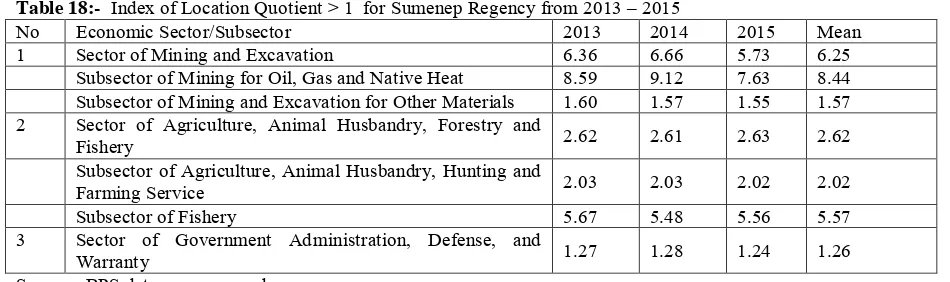
Table 18:- Index of Location Quotient > 1 for Sumenep Regency from 2013 – 2015
No Economic Sector/Subsector 2013 2014 2015 Mean
1 Sector of Mining and Excavation 6.36 6.66 5.73 6.25
Subsector of Mining for Oil, Gas and Native Heat 8.59 9.12 7.63 8.44 Subsector of Mining and Excavation for Other Materials 1.60 1.57 1.55 1.57 2 Sector of Agriculture, Animal Husbandry, Forestry and
Fishery 2.62 2.61 2.63 2.62
Subsector of Agriculture, Animal Husbandry, Hunting and
Farming Service 2.03 2.03 2.02 2.02
Subsector of Fishery 5.67 5.48 5.56 5.57
3 Sector of Government Administration, Defense, and
Warranty 1.27 1.28 1.24 1.26
Source : BPS data are processed.
Within Sumenep Regency in the last three years from 2013 to 2015, there are four (4) sectors and three (3) subsectors in the category of basis sector. Sectors with LQ more than 1 (one) involve: Sector of Mining and Excavation; Sector of Agriculture, Animal Husbandry, Forestry and Fishery; and Sector of Government Administration, Defense, and Warranty. Subsectors in basis sector category include: Subsector of Mining for Oil, Gas and Native Heat; Subsector of Subsector of Mining and Excavation for Other Materials; Subsector of Agriculture, Animal Husbandry, Hunting and Farming Service; and Subsector of Fishery.
Klasen Typology Analysis
Klasen Typology Analysis for Sumenep Regency in 2014 and 2015 is described in the following table.
Table 19:- Klasen Typology Analysis for Sumenep Regency in 2014 – 2015
Indikator Indicator Rate
2014 2015
PDRB Growth Rate for Regency/City 6.2 1.3
PDRB Growth Rate for Province 5.8 5.2
Income per Capita in Regency 20,124 20,288
Income per Capita in Regency 32,704 34,273
Conclusion of Local Typology Fast Developing Area Relatively Undeveloped Area
Source : BPS data are processed.
2015 which all of them are lower than that of East Java Province standing at IDR 32.704 millions in 2014 and IDR 34.273 millions in 2015.
Strategy Selection Model:-
This current research adopts model proposed by Boston Consulting Group (BCG). By this model, the selection of strategies for accelerating Sumenep Regency economic growth based on economic sectors and subsectors are described as following.
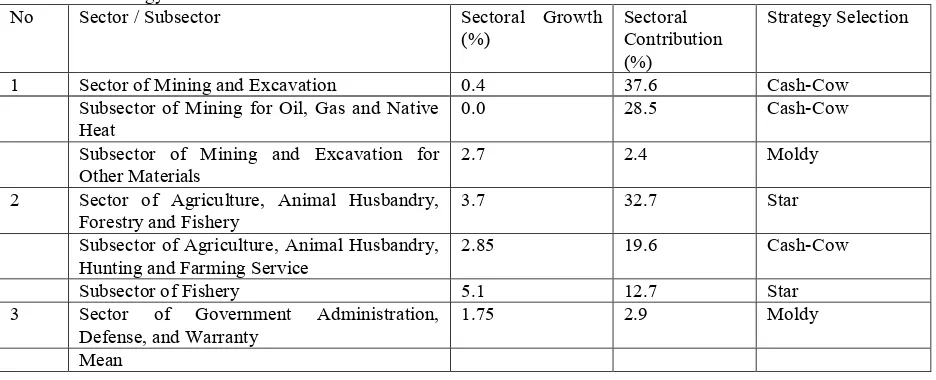
Table 20:- Strategy Selection Model Based on BCG
No Sector / Subsector Sectoral Growth
(%)
3 Sector of Government Administration, Defense, and Warranty
1.75 2.9 Moldy
Mean
In Sumenep Regency, the post of Star Sector is occupied by Sector of Agriculture, Animal Husbandry, Forestry and Fishery. The strategy implemented by this sector is by compiling huge supports of new investment fund, and this
sector then becomes “improvident” in capital necessity. Although improvidence is presented, this Star Sector is the
expected sector with bright future in Sumenep Regency. Only one subsector remains in star category of Sumenep Regency, and this is Subsector of Fishery.
Sector of Government Administration, Defense, and Warranty represents Moldy Sector. This sector does not have
adequate capacity to produce the expected result either now or then. It is also “negligible”. Moreover, it would not
require large amount of new investment fund because it cannot give maximum result either in current days or future. In Sumenep Regency, only one subsector has a moldy characteristic, and this is Subsector of Mining and Excavation for Other Materials.
Furthermore, Sector of Mining and Excavation is one with cash-cow characteristic. It is surely not powerful enough to meet the future expectation. Although it is less powerful, but it represents a relatively good source of growth in Sumenep Regency. This sector would not draw large amount of new investment fund. There are two subsectors in Sumenep Regency that are included into cash-cow category, respectively Subsector of Mining for Oil, Gas and Native Heat and Subsector of Agriculture, Animal Husbandry, Hunting and Farming Service.
Conclusion And Suggestion:-
Pursuant to the results of analysis, some conclusions have been made.
1. Economic structure in Sampang Regency is dominated by four (4) main sectors, such as: Sector of Agriculture, Animal Husbandry, Forestry and Fishery; Sector of Mining and Excavation; and Sector of Wholesale & Retail, and Reparation.
2. Bangkalan Regency economic structure is dominated by four (4) leading sectors, including: Sector of Mining and Excavation; Sector of Agriculture, Animal Husbandry, Forestry, and Fishery; Sector of Mining and Excavation; Sector of Wholesale & Retail, and Reparation; and Sector of Construction.
& Retail, and Reparation; Sector of Construction; and Sector of Government Administration, Defense, and
Based on the result of regional potential mapping from Sampang, Bangkalan, Pamekasan, and Sumenep Regencies, then some recommendations for the next policy-making are given as follows.
1. Policies concerning with development and investment for agriculture sector must be improved, and it prevails to all research locations including Sampang, Bangkalan, Pamekasan, and Sumenep Regencies. Such policies would be important for regencies with leading capacity in agriculture because it may facilitate them to export their commodity products to other regions. These policies can also maintain and develop leading capacity of the regions over the others.
2. Investment into Sector of Mining and Excavation in Sampang, Bangkalan, Pamekasan, and Sumenep Regencies is considered as having good prospect. These regencies have been able to export their mining and excavation materials to other regions. To maintain and develop such capacity, then the development in this sector should be put into agenda as the main priority. Relevant policies and laws could be made to regulate excessive exploitation, to prevent the transgression of threshold and also to enforce conservation-based excavation activity.
3. More prospective investment can be done in Sector of Electricity, Gas and Drink Water. All regencies, including Sampang, Bangkalan, Pamekasan, and Sumenep Regencies, are already open for such investment. The government should take the following policies:
a. Water exploitation must be regulated by which potential limit of conservation water would be set at possible degree of exploitation to prevent water crisis. Recalling a fact that water resource in all research regencies is not renewable, and the necessity of water is irreplaceable, such water regulation would give important effect.
b. Industrial region consisting of a lot of companies often needs large quantity of water resource. Number of AMDK companies are also mushrooming. The effect of these companies can be softened through the enforcement of protection initiative for the conservation forestry and also the immediate area to preserve any water resources that are possibly managed by the region for community interest.
References:-
1. Anonim, 1999, Undang-Undang Otonomi Daerah 1999, Penerbit Kuraiko Pratama, Bandung.
a. ,2013, Statistik Keuangan Pemerintah Daerah Kabupaten/Kota di Indonesia, Badan Pusat Statistik Daerah Tingkat I Jawa Timur,Surabaya.
b. ,2014, Statistik Keuangan Pemerintah Daerah Kabupaten/Kota di Indonesia, Badan Pusat Statistik Daerah Tingkat I Jawa Timur, Surabaya.
2. Basri, 1995, Perekonomian Indonesia Menjelang Abad XXI (Distorsing, Peluang dan Kendala), Penerbit Erlangga, Jakarta.
3. Dasril, Henry & Hessel, 2004, Kebijakan & Manajemen Keuangan Daerah, Penerbit YPAPI, Yogyakarta. 4. Elmi, Bchrul, 2002, Keuangan Pemerintah Daerah Otonom di Indonesia. Penerbit Universitas Indonesia (UI
Press), Jakarta.
5. Ibnu Syamsi, 1993, Dasar-Dasar Kebijaksanaan Keuangan Negara, cetakan kedua, Penerbit PT.Bina Aksara, Jakarta.
6. Khusaini, 2006, Ekonomi Publik, Desentralisasi Fiskal dan Pembangunan Daerah, Penerbit BPFE UNIBRAW, Malang.
7. Kuncoro, Mudrajad, 2004, Otonomi & Pembangunan Daerah Reformasi, Perencanaan, Strategi, dan Peluang, Jakarta : Penerbit Erlangga.
8. Mahmudi, 2010, Manajemen Keuangan Daerah, Penerbit Erlangga, Jakarta.
9. Permendagri, No 27 Tahun 2014 tentang Pedoman Penyusunan, Pengendalian dan Evaluasi Rencana Kerja Pembangunan Daerah Tahun 2015.
10. Permendagri, No 54 Tahun 2010 Tentang Pelaksanaan PP No. 8 Tahun 2008 tentang Tahapan, Tatacara Penyusunan, Pengendalian, dan Evaluasi Pelaksanaan Rencana Pembangunan Daerah.
12. Stat. Daniel dan Inge Hovlan, 2012, http://Subliyanto, Wordpress, com /2012/12/13 /analisis-swot/.
13. Syafrizal, 1997. Pertumbuhan Ekonomi dan Ketimpangan Regional Wilayah Wilayah Indonesia Bagian Barat. Prisma LP3ES, 3,27-38.
14. Syafrizal, 2008. Ekonomi Regional: Teori dan Aplikasi. Baduose Media.