Contents lists available atScienceDirect
Journal of the Taiwan Institute of Chemical Engineers
journal homepage:www.elsevier.com/locate/jtice
Synthesis, characterisation and application of TiO
2
–zeolite
nanocomposites for the advanced treatment of industrial dye
wastewater
Meng Nan Chong
a,b,∗, Zhen Yang Tneu
a, Phaik Eong Poh
a,b, Bo Jin
c, Rupak Aryal
daSchool of Engineering, Chemical Engineering Discipline, Monash University Malaysia, Jalan Lagoon Selatan, Bandar Sunway, Selangor Darul Ehsan 46150, Malaysia
bSustainable Water Alliance, Advanced Engineering Platform, Monash University Malaysia, Jalan Lagoon Selatan, Bandar Sunway, Selangor Darul Ehsan 46150, Malaysia
cSchool of Chemical Engineering, The University of Adelaide, North Terrace Campus, Adelaide 5005, South Australia, Australia
dSchool of Natural and Built Environments, University of South Australia, Mawson Lakes Campus, Mawson Lakes 5095, South Australia, Australia
a r t i c l e
i n f o
Article history: Received 7 August 2014 Revised 9 December 2014 Accepted 14 December 2014 Available online 5 January 2015
Keywords: Titanium dioxide Zeolite Nanocomposite Industrial dye wastewater Reactive Black 5 dye
a b s t r a c t
Photocatalysis usually involves the utilisation of nano-sized semiconductor photocatalysts owing to their higher specific surface area and surface reaction rate. However, the key challenges in the utilisation of nano-sized photocatalysts for advanced treatment of industrial dye wastewater are to enhance the post-separation and recovery of spent photocatalysts to prevent them from diffusing into the environment. Thus, the main aim of this study was to synthesize a functional-form of titanium dioxide (TiO2)–zeolite nanocomposite through the modified two-step sol–gel method for enhanced application and separation after advanced industrial dye wastewater treatment. The synthesized TiO2–zeolite nanocomposite was characterised using field-emission scanning electron microscopy (FE-SEM), energy dispersive X-ray (EDX) analysis, Fourier-transformed in-frared spectroscopy (FTIR), particle size distribution analysis and Brunauer–Emmett–Teller (BET) specific surface area and porosity analysis. Subsequently, the photoactivity of synthesized TiO2–zeolite nanocompos-ite was measured and compared against the commercial TiO2particles. It was found that the TiO2–zeolite nanocomposite shows a high apparent pseudo-first order reaction rate constant of 0.0419 min−1at lower dye concentration. This showed that the synthesized TiO2–zeolite nanocomposite follows a more adsorption-oriented photocatalytic degradation of water pollutants, which is useful for removing trace and untreated dye compounds in the advanced industrial dye wastewater treatment stage.
© 2015 Taiwan Institute of Chemical Engineers. Published by Elsevier B.V. All rights reserved.
1. Introduction
In recent years, rapid industrialisation has extended the use of synthetic dyes in various industrial applications in order to meet the escalating demands on consumer products to sustain the national economic growth. While this is a favourable and positive shift in an endeavour to shape the short-term or long-term economic outlook of a country; the environmental dimension of effective handling and management of produced industrial dye wastewater was often be-ing neglected. Industrial dye wastewater is highly refractory, as it is usually made up of high salt and organic contents that render its low biodegradability in the natural environment[1,2]. In order to
∗
Corresponding author at: School of Engineering, Chemical Engineering Discipline, Monash University Malaysia, Jalan Lagoon Selatan, Bandar Sunway, Selangor Darul Ehsan 46150, Malaysia. Tel.: +60 3 5516 1840; fax: +60 3 5514 6207.
E-mail address: [email protected], [email protected] (M.N. Chong).
safeguard and prevent the bioaccumulation of synthetic dye com-pounds in the natural environment, direct discharge of industrial dye wastewater effluent to environmental waterways or even local wastewater treatment plants (WWTPs) should be made illicit[3]. In-stead, the industrial dye wastewater should be retained on-site for further purification before discharging to the local WWTPs[3]. This is to ensure that most of the toxic and hazardous parent azo-aromatic synthetic dyes and their intermediate compounds are being treated to avoid this point source pollution from diffusing into the natural ecosystem.
To date, various concerted efforts have been made to retain the industrial dye wastewater for on-site treatments such as by using the natural pond and lagoon treatments; physico-chemical treat-ments such as sedimentation, flocculation, coagulation and adsorp-tion; biological treatments such as aerobic and anaerobic digestion or even high-rate algal metabolism and chemical treatments such as Fenton, photo-Fenton and ozonation[4,5]. However, the treat-ment of industrial dye wastewater is not straightforward as synthetic
http://dx.doi.org/10.1016/j.jtice.2014.12.013
M.N. Chong et al. / Journal of the Taiwan Institute of Chemical Engineers 50 (2015) 288–296 289
dye compounds are usually having very good water solubility. To-gether with the highly stable azo-aromatic structures of synthetic dyes, these made the industrial dye wastewater even more difficult to be degraded naturally or via bio-assisted degradation processes. In addition, the breakdown of synthetic dye compounds would release by-products such as benzidine, naphthalene and other aromatic com-pounds that are toxic, carcinogenic and mutagenic not only to marine living organisms but also affecting human beings through the food chain. For instance, Lupica[6]reported the toxicological effects of synthetic dyes could have on the shape and size of red blood cells of fishes. In addition, it was also reported that the untreated synthetic dyes can cause the reduction of reproductive organs of rat up to 44%, decrease in total protein concentration by 70% and cholesterol was depleted up to 91%[6].
Photocatalysis is an emerging branch of advanced oxidation tech-nologies used for water and wastewater treatment that has been widely documented for its ability to degrade indiscriminately almost all water pollutants [4]. Nano-sized semiconductor photocatalysts are usually being used owing to their higher specific surface area and thus, giving yields to a higher surface reaction rate during the degradation of water pollutants. The utilisation of nano-sized pho-tocatalysts in the advanced treatment of industrial dye wastewater is, however, remained highly challengeable owing to the problems associated with post-separation and recovery of spent photocatalysts
[7]. Even with the additional post-separation and recovery stage; the photo-efficiency of catalysts, recovery efficiency of photocatalysts and unit treatment cost of photocatalysis are the major factors that inhibit the large scale application of photocatalytic water treatment technol-ogy[8]. Thus, the key challenge in the utilisation of nano-sized pho-tocatalysts for advanced treatment of industrial dye wastewater is to provide a bespoke solution by immobilising the nano-sized semicon-ductor photocatalysts on larger immobiliser substrates to alleviate the post-separation and recovery efficiency. Different immobiliser substrates such as magnetite core[9], activated carbon[10]and clays
[7,11]have been used to enhance their post-separation and recovery from bulk water.
In comparison, natural zeolites are abundant, easily available and inexpensive as the immobiliser substrate to synthesize functional nanocomposites with semiconductor metal oxides[12]. More inter-estingly, zeolites are having crystalline aluminosilicates with differ-ent cavity structures and high ion exchange capacity, tectosilicates with microporous channels, pore spaces, molecular sieving, adsorp-tion and catalysis capacity [13,14]. Recently, the titanium dioxide (TiO2)–zeolite nanocomposite has been studied for the removal of
hu-mic acid from drinking water source[12]. Thus, the main aim of this study was to design a functional-form of TiO2–zeolite
nanocompos-ite by varying the acid concentrations, zeolnanocompos-ite loadings and annealing temperatures used in the modified two-step sol–gel synthesis pro-cess for subsequent application in the advanced treatment of indus-trial dye wastewater. In this instance, nano-sized TiO2crystals were
synthesized and immobilised on submicron sized zeolite particles to enable the functionality of “nanoparticles” while presenting a mi-crostructure for ease of post-separation and recovery after industrial dye wastewater treatment. Following this, further characterisations on the physicochemical properties and photoactivity of TiO2–zeolite
nanocomposite were carried out using field-emission scanning elec-tron microscopy (FE-SEM), energy dispersive X-ray (EDX) analysis, Fourier-transformed infrared spectroscopy (FTIR), particle size distri-bution analysis and Brunauer–Emmett–Teller (BET) specific surface area and porosity analysis. Finally, the effects of catalysts loading, an-nealing temperature and initial dye concentration on the photodegra-dation kinetics of surrogate model Reactive Black 5 dye compound were investigated. The UV–vis absorbance scans from 400 to 700 nm were also being carried out to monitor the cleavage and disappear-ance of characteristic
π
–π
system linked to the azo bonds and thepossible appearance of other reaction by-products. With this study,
it is anticipated that photocatalytic water treatment technology utilising TiO2–zeolite nanocomposite can provide a technically
feasi-ble and cost effective solution for advanced industrial dye wastewater treatment.
2. Materials and methods
2.1. Materials
Titanium (IV) butoxide (97% gravimetric, Sigma–Aldrich) and ab-solute ethanol (Kollin Chemicals) and zeolites (particle size<45
µ
m,Sigma–Aldrich, Product code: 96096) were used as received. Nitric acid (Kollin Chemicals), sodium hydroxide (Kollin Chemicals) and Re-active Black 5 dye (C26H21N5Na4O19S6, 55% Sigma–Aldrich) were
pre-pared to the final desired concentration via the addition of deionised water.
2.2. Preparation of TiO2–zeolite nanocomposites
The modified two-step sol–gel synthesis method for TiO2–zeolite
nanocomposites was in accordance to Chong et al.[7]in exception that kaolinite was replaced by zeolite particles. Briefly, 25 mL of tita-nium (IV) butoxide was mixed with 30 mL of absolute ethanol under vigorous magnetic stirring. The mixture was denoted as mixture A. Then 60 mL of diluted nitric acid was added drop wise into mixture A. During the mixing process, the mixture A was stirred continu-ously until the dispersion first became milky white and eventually transparent homogeneous sol with no visible precipitation. The stir-ring was continued for another 30 min to ensure the homogeneity in transparent homogenous sol formed. Following this, the zeolite parti-cles were made into suspension via the addition of 100 mL deionised water and the zeolite suspension was set in flask immersed in wa-ter bath with temperature set at 37°C. The prepared transparent sol was added drop wise into the zeolite suspension and the mixture was continuously stirred for 4 h. Subsequently, the final mixture was cooled to room temperature and aged for 13–16 h. After the aging pro-cess, the mixture was filtered and washed repeatedly for three times with deionised water and then the filtrate was dried at 65–70°C for 2–4 h. Finally, the filtrate containing TiO2–zeolite nanocomposites
was annealed at different temperatures before it was used as the pho-tocatalysts for the treatment of synthetic industrial dye wastewater.
2.3. Characterisation of TiO2–zeolite nanocomposites
Field-emission scanning electron microscopy images were ob-tained using the Hitachi SU8010 electron microscope at an acceler-ating voltage of 5 kV. Similarly, the energy dispersive X-ray analysis was carried out using the same electron unit after the samples were coated with platinum for ease of analysis of percentages of atomic element and element weight, respectively.
Brunauer–Emmett–Teller specific surface area of the TiO2–zeolite
nanocomposites was determined by using adsorption isotherms ob-tained from the Micromeritics BET ASAP 2020 (surface area and poros-ity analyser) at 77±0.5 K in liquid nitrogen and by using the BET equa-tion. Sample vessels were degassed at high temperatures overnight before being analysed for SSA, pore volume and pore size of the TiO2–
zeolite nanocomposites.
The functional groups on TiO2–zeolite nanocomposites were
anal-ysed using Thermo Scientific FTIR Nicolet iS10 while particle size dis-tribution were determined using Malvern Mastersizer 3000.
2.4. Photocatalytic experiments on aqueous Reactive Black 5 solution
The photoactivity of synthesized TiO2–zeolite nanocomposites
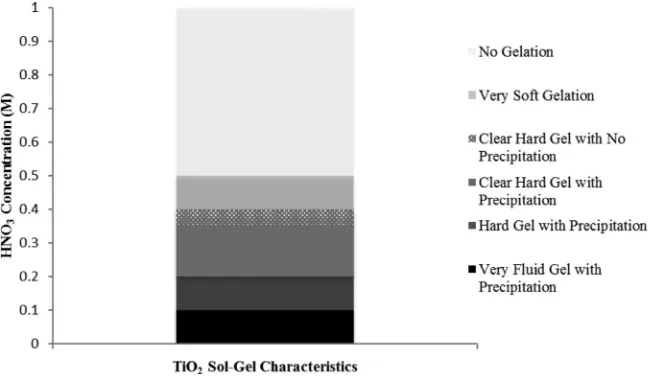
Fig. 1.Effects of different HNO3concentration on the textural and gelation characteristics of TiO2sol–gel formed.
reaction solution was placed in a beaker on a magnetic stirrer under a UV illumination of approximately 300
µ
W/cm2. Air ventilation in thereactor box was controlled using a vacuum pump with the ventilation rate set at 2 L/min. Sampling was done during the reaction using a micropipette.
During the initiation of photocatalytic experiment, 100 mL of the reaction solution was placed in the beaker with certain photocat-alysts loading. The reaction solution was then magnetically stirred for 30 min to ensure homogeneous mixing before the UV illumina-tion was turned on. Subsequently, the samples were collected every 30 min up until 180 min of reaction time. The collected samples were centrifuged (ScanSpeed Mini, Labogene, Denmark) at 12,000 rpm for 15 min before the supernatants were being separated and filtered for analysis. A triplicate of the reaction solution was sampled where the absorption spectra were scanned using a UV–vis spectrophotometer (Genesys 10uv, Thermo Electron Corporation). The monochromatic maximum wavelength of 597 nm from the UV–vis scanning was used, to determine the concentration of Reactive Black 5 dye in the samples. In order to evaluate for the photoactivity of TiO2–zeolite
nanocom-posites, the raw data on concentration–time was fitted with the Langmuir–Hinshelwood model as given inEq. (1). The reason for se-lecting this kinetic model to represent the heterogeneous photocatal-ysis reaction was due to that the model dye compound is thought to adsorb on the catalysts surface before being degraded and finally, the products will be desorbed from the catalysts surface[4]. Depending on the dye concentration, Chong et al.[15]found that the Langmuir– Hinshelwood model could be further simplified when theKC-value is less than 1 to the simplified pseudo-first order kinetic model as given inEq. (2).
whereris the reaction rate,kis the reaction rate constant,Kis the dynamic Langmuir adsorption constant,Cis the dye concentration andkappis the apparent pseudo-first order reaction rate constant.
3. Results and discussion
3.1. Effects of nitric acid concentration
The synthesis of TiO2sol–gel constitutes the first step in the
mod-ified two-step sol–gel synthesis method as previously reported by
Chong et al.[7]. The Ti-precursor solution was first hydrolysed in a hydrolysis reaction followed by condensation. Through this synthesis method, it is possible to control the homogeneity of TiO2sol–gel as
well as tune the microstructures of eventual TiO2crystallites formed.
In order to yield nanosized TiO2crystallites, the control on the
ex-tent of hydrolysis reaction is essential. In this study, the hydrolysis of Ti-precursor was carried out in two stages, where a partially hy-drolysed state was first targeted by adding absolute ethanol to the Ti-precursor. Chong and Jin[8]explained that this partially hydrol-ysed state is to provide non-hydrolysable ligands of Ti for better TiO2
cluster-to-cluster growth during condensation, as well as to provide better molecular homogeneity. Due to the low functionality range of ethanol in the hydrolysis of Ti-precursor, the true extent of hy-drolysis reaction was controlled by the second HNO3acid-catalysed
hydrolysis reaction.
Fig. 1shows the effects of varying HNO3concentration during the
acid-catalysed hydrolysis reaction step on the textural and gelation characteristics of TiO2 sol–gel formed. The range of studied HNO3
concentration was between 0.05 M and 1 M. In this instance, the vari-ation in the HNO3concentration resulted in TiO2sol–gel of different
fluidity and precipitation. Previously, Chong et al.[7]reported that the optimum HNO3 concentration lies in the range of 0.25–0.30 M
without any temperature and humidity controls during the synthe-sis experiments. FromFig. 1, however, it was observed that there are some precipitations in lumps still occur at HNO3concentration below
0.35 M. Precipitation was observed at low acid concentration due to a very high gelation rate that resulted in precipitates in the TiO2
poly-meric gel network. For the synthesis of TiO2–zeolite nanocomposites,
precipitates are not favourable for the immobilisation of TiO2
crys-tallites onto the external surface of zeolite due to its low degree of fluidity (i.e.non-flowing hardened TiO2sol–gel). When the acid
con-centration of 0.30–0.35 M was used, it was found the hardening of gel occurred almost instantaneously after the addition and stirring with HNO3. No precipitation was observed for HNO3concentration above
0.35 M where instead, a clear hard gel was formed at acid concen-tration range of 0.35–0.40 M. As for high HNO3concentration above
0.5 M, no gelation occurred even after long ageing time and Ti-sol presented a very high fluidity characteristic. It was understood that high acid concentration would slow down the condensation rate and thus, affecting the formation of TiO2polymeric gel.
When the acid concentration of 0.38 M was used, the gel formed hardened at a lower rate allowing the Ti-sol to be added drop-wise into the zeolite suspension in later stage. Thus, the optimum HNO3
M.N. Chong et al. / Journal of the Taiwan Institute of Chemical Engineers 50 (2015) 288–296 291
at 0.38 M. This was not in agreement with the previous finding re-ported by Chong et al.[7]and this was deduced to be owing to higher temperature and local humidity level in the present experiment set-tings. A systematic study should be carried out in order to understand the effects of temperature and humidity on the eventual textural and gelation characteristics of TiO2sol–gel formed. Apart from getting the
right textural and gelation characteristics of TiO2sol–gel, it was also
known that the optimum condition will also affect the TiO2
crystal-lites size formed. In this study, since the volume of acid used was kept constant while the molarities were varied, the predominant synthesis parameter was related to the pH. Su et al.[16]also reported that the TiO2crystallite particles in aqueous solution possess surface charges
that are highly dependent on pH. When the surface charges of TiO2
particles are high, strong repulsive forces exert among the particles making them less likely to form aggregates and thus, resulting in more stable Ti-sol with smaller particle sizes. It was also reported that large TiO2particles sizes are formed between pH 5 and pH 8 where white
precipitates were formed. Clear Ti-sol formed at low pH was reported to form nano-sized TiO2particles at pH less than pH 3. This is
consis-tent with the results obtained in this study where, the optimum TiO2
sol–gel condition chosen was clear and contained no precipitates.
3.2. Effects of zeolite loading
In the modified two-step sol–gel synthesis method for TiO2–zeolite nanocomposites, the latter part was to coat TiO2sol–gel
onto the external surfaces of zeolite before subjected to controlled an-nealing treatment. During the optimisation of TiO2sol–gel condition,
the acid-catalysed hydrolysis reaction was manipulated to produce sol–gel with optimal fluidity to enable drop wise addition into the zeolite suspension. This was done to enable the proper and more uni-form coating of positively-charged TiO2sol–gel dispersed onto the
negatively-charged aluminosilicate framework of zeolite. It is theo-rised that the TiO2sol–gel will only be immobilised on the external
surfaces of zeolite without being dispersed into its pores or cavities.
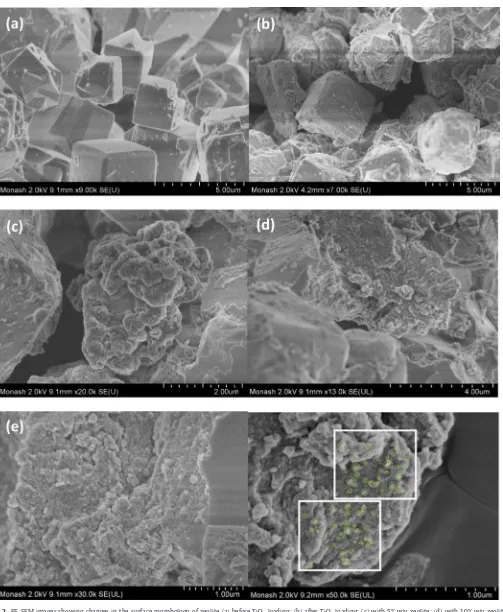
Fig. 2(a) and (b) shows the FE-SEM images showing the changes in surface morphology of zeolite, both before and after TiO2loading.
FromFig. 2(a) and (b), it can be observed that a distinct change in surface morphology occurred when TiO2 was heterogeneously
im-mobilised on the zeolite surface. In order to further investigate the effects of zeolite loadings on TiO2dispersion, different mass loadings
of zeolite in suspensions of 5%, 10% and 15% w/v was mixed with a constant volume of Ti-sol prepared from the first synthesis procedure.
Fig. 2(c)–(e) shows the FE-SEM images of TiO2–zeolite
nanocompos-ites synthesized under three different mass loadings of zeolite at 5% (w/v), 10% (w/v) and 15% (w/v), respectively. FromFig. 2(c)–(e), the analysis of three different mass loadings of zeolite used revealed that the TiO2particles were not evenly distributed over the zeolite
sur-face and many sections of the zeolite sursur-face still remained bare and uncovered by TiO2particles. When a low zeolite loading of 5% (w/v)
was mixed with constant volume of Ti-sol, the TiO2layer on zeolite
surface was found to be thick and layered coating (Fig. 2(c)). This was possibly due to the aggregation of TiO2particles during the
immobil-isation process and is believed to cause a reduction in the effective surface area of TiO2 particles that had immobilised on the zeolite
surface. It was however, at higher mass loadings of zeolite, the TiO2
layer on the zeolite surface showed a consistent and layered coating and this coating appeared to become thinner when the zeolite load-ing was increased (i.e.15% w/v). This was attributed to the higher amount of crystal nucleation sites available for TiO2binding when
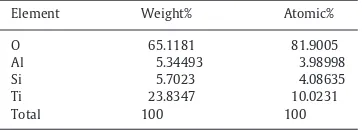
higher zeolite loading was used. Finally, an energy dispersive X-ray analysis was carried out to validate the presence and composition of Ti in the prepared TiO2–zeolite nanocomposites.Table 1shows the
quantified elemental composition of prepared TiO2–zeolite
nanocom-posites from EDX analysis and this confirmed that the layered coating formed on the zeolite surface was indeed due to the immobilisation
of TiO2particles. Since the amount of Ti added remains unchanged
throughout the synthesis experiments, both the weight and atomic percentages of Ti in the TiO2–zeolite nanocomposites are measured
(using EDX) to be approximately 23.83% and 10.02%, respectively.
3.3. Characterisation of TiO2–zeolite nanocomposites
3.3.1. BET adsorption isotherm analysis
By analysing the adsorption isotherms of nitrogen on the meso-porous zeolite surface at an increasing relative pressure, the BET sur-face area, pore size and volume were determined.Fig. 3shows the adsorption and desorption isotherms of TiO2–zeolite
nanocompos-ites for zeolite loading of 5% w/v and annealing treatment at 400°C. FromFig. 3, it can be observed that the adsorption and desorption isotherms are not the same for a specified region of relative pressures. This phenomenon is known as a hysteresis loop and is commonly ex-hibited in mesoporous adsorbents such as zeolite particles used in this study. With the adsorption and desorption isotherm characteris-tics, the observed isotherms can be classified as the Type IV isotherm in accordance to the IUPAC isotherm classifications[17].
Table 2shows the effects of zeolite loading and annealing tempera-ture on the BET surface area, pore size and pore volume distribution. It was observed that an increase in zeolite loading from 5% to 10% (w/v) in suspension is accompanied by an increase in BET surface area, as the mesoporous zeolite structure is porous. At the zeolite loading of 5% (w/v), it was found through FE-SEM imaging (Fig. 2(f)) that TiO2
crystallites were dispersed more frequently on the zeolite surface due to lesser nucleation sites. When the pore volume was examined for mass loadings of zeolite at 5% and 10% (w/v), two potential hypothe-ses can be portrayed. Firstly, the immobilisation of TiO2crystallites
on the external surface of zeolite is causing blockage of zeolite pores and resulted in an attenuation of pore volume from 0.223379 cm3/g
to 0.201215 cm3/g. Secondly, the immobilised TiO
2layer on zeolite
could form a microporous structure that could increase the pore vol-ume of TiO2–zeolite nanocomposites. It was however, from the BET
analysis that the zeolite pore sizes were ranged between 2 and 3 nm while the TiO2crystallites were measured from 10 to 100 nm. Thus,
the difference in zeolites pore size and TiO2crystallites size confirmed
that the second hypothesis is valid whereas a microporous TiO2layer
was formed on the external zeolite surface.
When the effect of annealing temperatures was studied between 300°C and 600°C, the TiO2–zeolite nanocomposites were found to
ex-hibit a wide rangeability of behaviour in terms of the BET surface area, pore size and volume. By ensuring the mass loading of zeolite was con-stant at 5% (w/v), the increase in annealing temperature from 300°C to 400°C was observed to have negligible effect on the BET surface area but a slight increase in both the pore size and volume. However, when the annealing temperature was increased to 600°C, an abrupt reduction in the BET surface area from 279.5122±1.1593 m2/g to
38.1123±1.2562 m2/g was observed. Vimonses et al.[18]reported
that there exists a small endothermic peak at 600°C in zeolite that cor-responds to the dehydroxylation process in zeolite. This endothermic peak was the potential reason for the abrupt reduction in BET sur-face area as observed when the annealing temperature was increased from 400°C to 600°C. Simultaneously, an increase in both the pore size and volume was observed and this is in close agreement with the observed endothermic peak in zeolite at 600°C.
3.3.2. Fourier-transformed infrared spectroscopy (FTIR)
The functional groups that present in TiO2–zeolite
nanocompos-ites were studied using the FTIR spectroscopy.Fig. 4shows the com-parison of FTIR spectra of pure zeolite and TiO2–zeolite
nanocompos-ites. FromFig. 4, it can be observed that the samples of pure zeolite and TiO2–zeolite nanocomposites annealed at 500°C and 600°C
Fig. 2. FE-SEM images showing changes in the surface morphology of zeolite (a) before TiO2loading; (b) after TiO2loading; (c) with 5% w/v zeolite; (d) with 10% w/v zeolite; (e) with 15% w/v zeolite and (f) measured TiO2crystallites size on zeolite.
that zeolite is high suitable to act as TiO2immobiliser, as the structure
is not affected by the high annealing temperatures used.
The broad band occurring at 3286 cm−1in both annealed TiO 2–
zeolite nanocomposites samples was linked to the –OH stretching and bending vibrations of silanol groups (Si–OH), which was formed due to the interaction between –Si groups in zeolite and water molecules.
While the small band at 1619 cm−1is a characteristic of the bending
vibrations of H–O–H bonds in water molecules associated with ze-olite particles. Following these, the sharp intense peak observed at 958 cm−1was due to the Si–O–Si or Al–O–Al non-symmetric
stretch-ing vibrations in the tetrahedral SiO4and AlO4structures that form
M.N. Chong et al. / Journal of the Taiwan Institute of Chemical Engineers 50 (2015) 288–296 293
Fig. 3. Adsorption and desorption isotherms of TiO2–zeolite nanocomposites for zeo-lite loading of 5% w/v and annealing treatment at 400°C.
Table 1
Elemental composition of prepared TiO2–zeolite nanocom-posites from EDX analysis.
Element Weight% Atomic%
O 65.1181 81.9005
Al 5.34493 3.98998
Si 5.7023 4.08635
Ti 23.8347 10.0231
Total 100 100
the highest. Previous study by Smirnov and Graaf[19]and Damin et al.
[20]reported that the insertion of Ti into the zeolite structure would result in the Ti–O–Si bonds at the infrared band of 960 cm−1. It was
also reported that the band intensity is proportional to the amount of Ti present in the zeolite framework. However, the FTIR spectra at the intense band of 958 cm−1that represents the Si and Al tetrahedral
bonding was found to overshadow the potential Ti band formed. This observation indicated that the amount of Ti that presents in the TiO2–
zeolite nanocomposites could be minimal and again proven that the microporous TiO2crystallites layer is surface-bounded without any
interstitial binding into the zeolite structure.
3.3.3. Particle size distribution
Previously, the TiO2 crystallites on nanocomposites were
mea-sured as shown inFig. 2(f). From the average TiO2crystallites size
estimation over sampling through FE-SEM image, the size range was found between 10 nm and 80 nm. WhileFig. 5shows the particle size distribution of TiO2–zeolite nanocomposites measured using the
laser light diffraction method. FromFig. 5, it was observed that the size rangeability of TiO2–zeolite nanocomposites varied from 0.4 to
200
µ
m with the majority of the nanocomposites particles in the sizerange of 5–10
µ
m. The larger particle sizes measured were due tothe aggregation of zeolite particles and this is shown in the FE-SEM imaging inFig. 6. InFig. 6, it was observed that the zeolite aggregates formed were composed of cubes arranged in a random and disorgan-ised manner. As for the particle size distribution below 5
µ
m, thiswas found to be owing to the non-aggregated single cubes of zeolite. It was also observed that when the zeolite cubes aggregate, they will form cavities and channels in between the cubes. In this instance, the TiO2crystallites were seen to bind more frequently to the cavities and
Fig. 4. Comparison of the FTIR spectra of pure zeolite and TiO2–zeolite nanocompos-ites.
channels, as compared to the flat surfaces of zeolite particles. With such a nanocomposites structure of TiO2and zeolite, it is anticipated
that they could be exhibiting the “nano-scale” effects while a sub-micron sized microstructure for ease of separation after wastewater treatment.
3.4. Photoactivity evaluation of TiO2-zeolite nanocomposites
3.4.1. Effect of catalyst loading
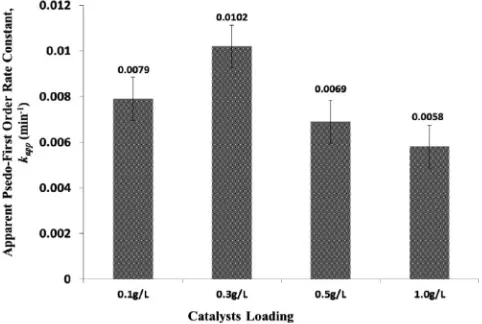
Catalyst loading is an important parameter in photocatalytic water treatment processes[21]. The optimum catalyst loading enables the maximum photoactivity while preventing the unnecessary excess use of applied catalysts.Fig. 7shows the plot of pseudo-first order rate constant of model Reactive Black 5 dye against TiO2–zeolite
nanocom-posites loadings used. Control experiment showed that in the absence of UV irradiation, the photocatalytic degradation of Reactive Black 5 dye was very low to negligible. In the other control experiment with the absence of TiO2–zeolite nanocomposites photocatalyst, the direct
UV photolysis of Reactive Black 5 was still evident with a measured pseudo first-order rate constant of 0.0035 min−1(data not shown).
FromFig. 7, it was found that the optimum TiO2–zeolite
nanocom-posites loading required is 0.3 g/L that yields the pseudo-first order rate constant of 0.0102 min−1. Primarily the increase in photoactivity
when the TiO2–zeolite nanocomposites loading was increased from
0.1 g/L to 0.3 g/L was attributed to the higher number of active sites and more reactive radicals available for surface reaction. However, the reduction in photoactivity of TiO2–zeolite nanocomposites was
ob-served at higher catalysts loadings owing to the increasing cloudiness in the reaction solution that prevents penetration from UV illumina-tion. Mahadwad et al.[22]also explained that the increase in catalysts concentration will result in the deactivation of activated molecules due to collisions with ground state molecules. Thus, the optimum TiO2–zeolite nanocomposites for the photocatalytic degradation of
10 ppm model Reactive Black 5 dye in aqueous solution were 0.3 g/L.
3.4.2. Effect of annealing temperature
Fig. 8shows the effects of annealing temperature on TiO2–zeolite
nanocomposites on its photoactivity in degrading the model Reac-tive Black 5 dye in aqueous solution. It was interesting to note that
Table 2
Effects of different zeolite loading and annealing temperature on the BET surface area, pore size and pore volume.
Zeolite loading Annealing temperature (°C) BET surface area (m²/g) Pore size (nm) Pore volume (cm³/g)
5% zeolite 400 279.4826±1.6744 2.87983 0.201215
10% zeolite 400 324.0927±1.7259 2.75698 0.223379
5% zeolite 300 279.5122±1.1593 2.79353 0.195206
Fig. 5. Particle size distribution of TiO2–zeolite nanocomposites.
Fig. 6. FE-SEM images showing (a) large aggregates of zeolite and/or TiO2–zeolite nanocomposites; (b) non-aggregated single cube of zeolite and/or TiO2–zeolite nanocomposites.
Fig. 7.Plot of pseudo-first order rate constants of model Reactive Black 5 dye against TiO2–zeolite nanocomposites loadings used.
the TiO2–zeolite nanocomposites sample annealed at 600°C showed
higher photoactivity than those annealed at 300°C, albeit lower BET specific surface area for sample annealed at 600°C. The apparent pseudo-first order rate constants at both 300°C and 600°C were 0.0056 min−1and 0.0102 min−1, respectively. The higher
photoactiv-Fig. 8. Effects of annealing temperature on the photocatalytic degradation of model Reactive Black 5 dye in aqueous solution. Initial dye concentration: 10 ppm; pH 5 and TiO2–zeolite nanocomposites loading: 0.3 g/L.
ity in TiO2–zeolite nanocomposites sample annealed at 600°C could
M.N. Chong et al. / Journal of the Taiwan Institute of Chemical Engineers 50 (2015) 288–296 295
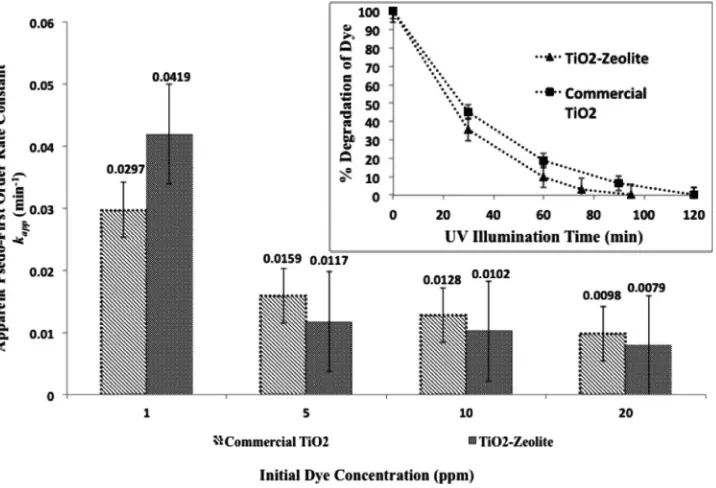
Fig. 9. Comparison plot between TiO2–zeolite nanocomposites and commercial TiO2particles in apparent pseudo-first order rate constants against initial dye concentration. Inset: Percentage degradation of dye against UV illumination time at initial dye concentration: 1 ppm; pH 5 and catalyst loading of 0.3 g/L.
mixture of the two photoactive phases. From our previous study, we found that the pure anatase TiO2 photoactive phase dominates
where the mixed anatase/rutile phase only appears when annealed at 650°C[7].
3.4.3. Effect of initial dye concentration
Fig. 9shows the comparison plot of apparent pseudo-first order rate constants between TiO2–zeolite nanocomposites and
commer-cial TiO2particles on photocatalytic degradation of different initial
dye concentrations. FromFig. 9, it was found that the TiO2–zeolite
nanocomposites exhibited a higher apparent pseudo-first order rate constant of 0.0419 min−1 than the commercial TiO
2 particles
(i.e.0.0297 min−1) at a low dye concentration of 1 ppm. This was
comparatively higher than the apparent pseudo-first order rate con-stants obtained at higher dye concentrations for both TiO2–zeolite
nanocomposites and commercial TiO2particles. At low dye
concen-tration, dye molecules are dynamically adsorbed, reacted and des-orbed from the external surface of TiO2–zeolite nanocomposites. As
the dye concentration increases, cumulative amount of dye molecules are adsorbed onto the TiO2–zeolite nanocomposites that reduces
the penetration of UV illumination and rate of surface reaction, re-spectively. Simultaneously, the absorption of UV illumination by the surface-adsorbed dye molecules also attenuates the photon trans-missivity to the catalyst surface. The inset inFig. 9shows the com-parison plot in photocatalytic degradation kinetics of Reactive Black 5 dye at 1 ppm for both TiO2–zeolite nanocomposites and
commer-cial TiO2particles. From the kinetics plot, it was observed that a
com-plete degradation of Reactive Black 5 dye was achieved in 95 min and 120 min using the TiO2–zeolite nanocomposites and commercial
TiO2 particles, respectively. While at higher initial dye
concentra-tion of 10 ppm, it was observed that the commercial TiO2particles
(i.e.0.0128 min−1) performed better than the TiO
2–zeolite
nanocom-posites (i.e.0.0102 min−1).Fig. 10shows the attenuation in UV–vis
absorbance peak at
λ
maxvalue of 597 nm at 30 min interval, as a resultof the cleavage and disappearance of characteristic
π
system linkedby the azo bonds (–N≡N–). Based on these findings, it can be con-cluded the TiO2–zeolite nanocomposites exhibited more adsorption
oriented photocatalytic degradation that could be useful to remove
Fig. 10.Absorbance of Reactive Black 5 reaction solution samples taken at 30 min intervals from 400 to 700 nm (10 ppm initial dye concentration, pH 5, 25°C, 0.3 g/L catalyst).
trace water pollutants in the advanced water/wastewater treatment stages.
4. Conclusion
In conclusion, the modified two-step sol–gel method was success-fully adopted to synthesize TiO2–zeolite nanocomposite with surface
covered TiO2 crystallites size of 10–100 nm and zeolite
immobilis-ers size of 5–10
µ
m. This enables the functionality of “nano-sizedeffect” for TiO2while presenting sub-micron zeolite microstructure
platforms to allow for the ease of post-separation and recovery af-ter advanced industrial dye wastewaaf-ter treatment. During the first sol–gel synthesis step, the optimum acid concentration was found to be 0.35–0.40 M HNO3that yielded a homogeneous, clear and hard
TiO2sol–gel with no precipitation formed. Subsequently, the TiO2
sol–gel was coated onto different mass loadings of zeolite and the physical structural existence of TiO2–zeolite nanocomposite was
suc-cessfully characterised and proven using FE-SEM and EDX analysis. FE-SEM images showed that a consistent layer of TiO2crystallites was
Ti composition in the synthesized TiO2–zeolite nanocomposite. The
different zeolite loadings were seen to increase the BET surface area by providing more surface nucleation sites for the growth of TiO2
crystallites. Surface characterisation using BET analysis showed that the TiO2–zeolite nanocomposite exhibited the adsorption isotherm
characteristic similar to mesoporous zeolite, which indicates that the high specific surface area and adsorption capacity characteristics were preserved. FTIR analysis conducted showed that the amount of Ti that presents in the TiO2–zeolite nanocomposite was minimal
and also proved that the microporous TiO2crystallites layer formed
was surface-bounded without any interstitial binding into the ze-olite structure. Photocatalytic degradation of model Reactive Black 5 dye showed that the highest apparent pseudo-first order reaction rate constant of 0.0419 min−1was achieved at the optimum TiO
2–
zeolite nanocomposite loading of 0.3 g/L and initial dye concentra-tion of 1 ppm. More interestingly, it was found that the TiO2–zeolite
nanocomposite annealed at 600°C showed higher photoactivity than those annealed at 300°C, albeit lower BET specific surface area for sample annealed at 600°C. In this instance, the higher photoactiv-ity in TiO2–zeolite nanocomposites sample annealed at 600°C could
be attributed to the formation of higher pore size and volume in the TiO2–zeolite nanocomposite. Finally, a comparison in photoactivity
between the TiO2–zeolite nanocomposite and commercial TiO2
par-ticles revealed that synthesized nanocomposite exhibited a higher apparent pseudo-first order rate constant and degradation kinetics at lower dye concentration. This could be an important implication that the TiO2–zeolite nanocomposite followed more adsorption-oriented
photocatalytic degradation that could be useful to remove trace water pollutants in the advanced water/wastewater treatment stage.
Acknowledgements
The authors are grateful to the financial support from the Chemi-cal Engineering Discipline, School of Engineering,Monash University
Malaysia. The authors are also indebted to the provision of relevant chemicals by Dr. Wu Ta Yeong and Dr. Babak Salamatinia from the School of Engineering, Monash University Malaysia.
References
[1] Alinsafi A, Khemis M, Pons MN, Leclerc JP, Yaacoubi A, Benhammou A, et al. Electro-coagulation of reactive textile dyes and textile wastewater. Chem Eng Process 2005;44:461–70.
[2]Vimonses V, Lei S, Jin B, Chow CWK, Saint C. Adsorption of congo red by three Australian kaolins. Appl Clay Sci 2009;43:465–72.
[3]Chong MN, Jin B. Photocatalytic treatment of high concentration of carbamazepine in synthetic hospital wastewater. J Hazard Mater 2012;199-200:135–42. [4]Chong MN, Jin B, Chow CWK, Saint C. Recent developments in photocatalytic
water treatment technology: a review. Water Res 2010;44:2997–3027. [5]Gupta VK, Gupta B, Rastogi A, Argawal S, Nayak A. A comparative investigation on
adsorption performances of mesoporous activated carbon prepared from waste rubber tire and activated carbon for a hazardous azo dye—Acid Blue 113. J Hazard Mater 2011;186:891–901.
[6] Lupica S. Effects of textile dyes in wastewater. eHow Contributor, Available online: www.ehow.com/info_8379849_effects-textile-dyes-wastewater.html[Accessed 27th May 2013].
[7]Chong MN, Vimonses V, Lei S, Jin B, Chow C, Saint C. Synthesis and characterisation of novel titania impregnated kaolinite nano-photocatalyst. Micro Meso Mater 2009;117:233–42.
[8]Chong MN, Jin B. Sol-gel synthesis of inorganic mesostructured composite pho-tocatalyst for water purification: an insight into the synthesis fundamentals, re-action, and binding mechanisms. Synth React Inorg Met-Org Nano-Met Chem 2012;42:68–75.
[9]Beydoun D, Amal R. Implications of heat treatment on the properties of a magnetic iron oxide-titanium dioxide photocatalyst. Mater Sci Eng B 2002;94:71–81. [10]Shi JW, Zheng JT, Ji XJ. TiO2-SiO2/Activated carbon fibers photocatalyst:
prepara-tion, characterizaprepara-tion, and photocatalytic activity. Environ Eng Sci 2010;27:923– 30.
[11]Paul B, Martens WN, Frost RL. Immobilised anatase on clay mineral particles as a photocatalyst for herbicides degradation. Appl Clay Sci 2012;57:49–54. [12]Liu S, Lim M, Amal R. TiO2-coated natural zeolite: rapid humic acid adsorption
and effective photocatalytic regeneration. Chem Eng Sci 2014;105:46–52. [13]Vimonses V, Lei S, Jin B, Chow CWK, Saint C. Kinetic study and equilibrium
isotherm analysis of Congo Red adsorption by clay materials. Chem Eng J 2009;148:354–64.
[14]Wang S, Peng Y. Natural zeolites as effective adsorbents in water and wastewater treatment. Chem Eng J 2010;156:11–24.
[15]Chong MN, Jin B, Zhu HY, Chow CWK, Saint C. Application of H-titanate nanofibers for degradation of Congo Red in an annular photoreactor. Chem Eng J 2009;150:49–54.
[16]Su C, Hong BY, Tseng CM. Sol-gel preparation and photocatalysis of titanium dioxide. Catal Today 2004;96:119–26.
[17]Sing KSW, Everett DH, Haul RAQ, Moscau L, Pierotti RA, Rouquerol J, et al. Reporting physic-sorption data for gas/solid systems with special reference to the determi-nation of surface area and porosity. Pure Appl Chem 1984;57:603–19. [18]Vimonses V, Jin B, Chow CWK, Saint C. Enhancing removal efficiency of anionic
dye by combination and calcinations of clay materials and calcium hydroxide. J Hazard Mater 2009;171:941–7.
[19]Smirnov KS, van de Graaf B. On the origin of the band at 960 cm−1in the vibrational
spectra of Ti-substituted zeolites. Micro Meso Mater 1996;7:133–8.
[20]Damin A, Ricchiardi G, Bordiga S, Zecchina A, Ricci F, Spano G, et al. Effect of Ti insertion in the silicalite framework on the vibrational modes of the structure: an ab initio, and vibrational study. Stud Surf Sci Catal 2001;140:195–208. [21] Chong MN, Cho YJ, Poh PE, Jin B.Evaluation of TiO2photocatalytic technology for
the treatment of reactive black 5 dye in synthetic and real greywater effluents. J Cleaner Prod 2014. doi:10.1016/j.jclepro.2014.11.014.