Analysis of Main Morphometry Characteristic
of Watershed and It’s Effect to The Hydrograph
Parameters
I Gede Tunas
1, Nadjadji Anwar
2, Umboro Lasminto
3AbstractUntil today, the development of synthetic unit hydrograph model is still based on morphometry characteristic of watershed or combine with other parameters. According to Sri Harto (1985), There are at least four main characteristic morphometry of watershed which highly influenced to the hydrograph and can be easily quantified namely watershed area (A), main river length (L), main river slope (S) and form factor (FB). This research aim is to analyze and verify these four
factors and it’s effect to the three of hydrograph parameters i.e. peak time (TP), peak flow (QP) and base time (TB). This
research was carried out in eight watersheds in Central Sulawesi Province Indonesia as the base of variable preparation to develop synthetic unit hydrograph model. Main morphometry analysis of watershed was conducted by using geographical information system (GIS) software, referring to Indonesia Topographic Map (RBI) data combined with Digital Elevation Model-Shuttle Radar Topographic Mission (DEM-SRTM) data, to determine the area (A), main river length (L), main river slope (S) and form factor (FB) of every analyzed watershed. The research showed that eight observed watersheds had an area (A) of 23.88 km2 to 144.73 km2, main river length (L) of 10.31 km to 28.69 km, main river slope (S) of 0.03422 to 0.10812 and form factor (FB) of 0.21 to 0.49. From correlation analysis, It seen that the watershed area affected very well to peak flow (QP) with correlation coefficient of 0.98. The main river length also affected very well to the peak time (TP) with correlation coefficient of 0.99. Two others morphometry parameters namely main river slope (S) and form factor (FB) did not show the effect which could be concluded. These two parameters showed low correlation coefficient.
Keywordsmorphometry characteristic, watershed and hydrograph parameters.
AbstrakSampai saat ini, pengembangan model hidrograf unit sintetis masih berdasarkan karakteristik morfometri daerah aliran sungai atau dikombinasikan dengan parameter lainnya. Menurut Sri Harto (1985), setidaknya ada empat morfometri karakteristik utama DAS yang sangat mempengaruhi hidrograf dan dapat dengan mudah dihitung yaitu daerah aliran sungai (A), panjang sungai utama (L), kemiringan sungai utama (S) dan Faktor bentuk (FB). Tujuan penelitian ini adalah untuk menganalisis dan memverifikasi keempat faktor tersebut dan berpengaruh terhadap tiga parameter hidrograf yaitu peak time (TP), peak flow (QP) dan base time (TB). Penelitian ini dilakukan di delapan daerah aliran sungai di Propinsi Sulawesi Tengah
Indonesia sebagai basis persiapan variabel untuk mengembangkan model hidrograf unit sintetis. Analisis morfometri utama DAS dilakukan dengan menggunakan perangkat lunak Sistem Informasi Geografis (SIG), mengacu pada data Peta Topografi Indonesia (RBI) yang digabungkan dengan data Digital Elevation Model Shuttle Shuttle Radar Topografi (DEM-SRTM), untuk menentukan area (A) , Panjang sungai utama (L), kemiringan sungai utama (S) dan faktor bentuk (FB) setiap DAS yang dianalisis. Hasil penelitian menunjukkan bahwa delapan DAS yang teramati memiliki luas wilayah (A) sebesar 23,88 km2 sampai 144,73 km2, panjang sungai utama (L) 10,31 km sampai 28,69 km, lereng sungai utama (S) 0,03422 sampai 0,10812 dan faktor bentuk (FB) dari 0,21-0,49. Dari analisis korelasi, terlihat bahwa daerah aliran sungai sangat terpengaruh arus puncak (QP) dengan koefisien korelasi sebesar 0,98. Panjang sungai utama juga berpengaruh sangat baik terhadap peak time (TP) dengan koefisien korelasi sebesar 0,99. Dua parameter morfometri lainnya yaitu kemiringan sungai utama (S) dan form factor (FB) tidak menunjukkan efek yang dapat disimpulkan. Kedua parameter ini menunjukkan koefisien korelasi yang rendah.
Kata KunciKarakteristik morfometri, parameter DAS dan hidrograf.
I.INTRODUCTION1
ynthetic unit hydrograph (SUH) model is a rainfallrunoff model which developed based on unit hydrograph theory using characteristics of measured watershed to apply in unmeasured watershed [1]. Generally, the used watershed characteristic is based on the four main morphometry parameters namely watershed area (A), main river length (L), main river slope (S) and form factor (FB). Generally, many synthetic unit hydrograph models have been developed around the world included in Indonesia using morphometry parameters of watershed or combine with
1I Gede Tunas, Nadjadji Anwar, Umboro Lasminto are with
Department of Civil Engineering, Institut Teknologi Sepuluh Nopember, Surabaya, 60111, Indonesia. E-mail: [email protected]; [email protected]; [email protected].
other parameters such Snyder (1938), Nakayasu (1945), GAMA I (1985), Limantara (2008) and ITB (2011). All of these SUH models are mainly developed based on large watersheds and low main river slope of watersheds. Basically, SUH has three main parameters such as time to peak (TP), peak discharge (QP) and base time (TB), which is generally developed based on morphometry characteristic of watersheds. Based on relationship between morphometry characteristic of watersheds and hydrograph parameters, it is probably developed a SUH for the watershed.
Related to the development of SUH, first step that should be performed is analyzing watershed morphometry and deciding parameters which become model variable based on watershed morphometry characteristic. The analysis can be carried out based on geographical information system as one of most popular software in recent day. The objective of this research is to analyze and verify the relationship of the
morphometry characteristic of watershed and hydrograph parameters, as variable that will be used to develop synthetic unit hydrograph model using 8 meso scale watersheds in Central Sulawesi Indonesia with different characteristics to the watersheds which observed by Snyder (1938), Nakayasu (1945), GAMA I (1985), Limantara (2008) and ITB (2011). Generally watersheds in Central Sulawesi have high slope of main river with low river path.
Morphometry of Watershed A.
Morphometry is stated as the size and configuration of mathematical analysis, the shape and dimensions of the earth's surface [2, 3]. Morphometry of watershed is a quantitative measure of watershed characteristics associated with aspects of geomorphology of the area. These watershed characteristics may include watershed area, watershed shape, river network, drainage patterns and density, and slope of main river bed [3, 4]. The characteristics are related to drainage process of rainfall in the watershed and affect to discharge at watershed outlet. Analysis of watershed morphometry has an important role in understanding the relationship between watershed parameters [5].
Quantitative measure of the watershed characteristics are expressed by morphometric parameters, covering linear morphometry, areal morphometry and relief morphometry [6, 7]. Linear morphometry includes the number of segments per order (No), total number of river segments throughout the (N), river length (L), river branching ratio (RB), river length ratio (RL) and length of stream path (Lo). Arial morphometry involves
catchment area per order (Ao), long-area relationship,
watershed shape, drainage density (D), flow frequency and constant channel management. The last category, relief morphometry is consists of relief ratio (Rh),
relative relief (Rhp), relative basin height (y), relative
basin area (x) and ruggedness number (R). According to Sri Harto [8], There are at least four main characteristic morphometry of watershed which highly influenced to the hydrograph and can be easily quantified namely
watershed area (A), main river length (L), main river slope (S) and form factor (FB).
The size of watershed is one of the important factors in the formation of flow hydrograph. The larger the watershed area, there is a tendency the greater the amount of rainfall received [9]. As a consequence, a large watershed will generate peak discharge (QP) and time base (TB) which is greater than small watershed and takes a longer time to reach the peak hydrograph (TP) as illustrated in Figure 1.
The length of the river is defined as the length of main river from the upstream to the outlet point. Generally, the river typology from upstream to downstream has a meander pattern depending on the shape and slope of topography. The more bends of river for the same watershed, then the length of the river will be increasing. This means that the slope of the river is decreasing and the implications for the average flow rate in the river is also declining. If flow velocity in the river decreases, the peak time of flow hydrograph will become longer.
The slope of watershed and river directly related to topography, slope length and length of river. As mentioned previously that slope of river (applies also to watershed slope) directly impact the flow velocity of river. The higher the slope of the river, the flow velocity is also higher and opportunity flow to infiltrate into the ground is getting smaller, so most of them will be part direct run-off. This means that the slope of the river greatly affect the peak time and peak discharge.
Watershed shape generally is varied, depending on topography and geomorphology of the area where the watershed is located. But in general, watershed shape can be expressed by shape parameters, namely elongation ratio, circularity ratio, basin shape and form factor. Watershed shape can affect the flow travel time from the upstream of the watershed to the point outlets [10], which implicate to hydrograph shape especially peak time hydrograph (TP) and peak discharge (QP) as illustrated in Figure 2.
Figure 2. The effect of watershed form to the hydrograph [10]
Hydrograph Parameters B.
Hydrograph parameters represented hydrograph shape includes peak time (TP), base time (TB), peak discharge (QP), rising and recession side. The fifth parameter describes watershed characteristics in response rain input [12]. The process of rain-discharge transformation became a very complex system in watershed and presented in the form of hydrograph.
II.METHOD
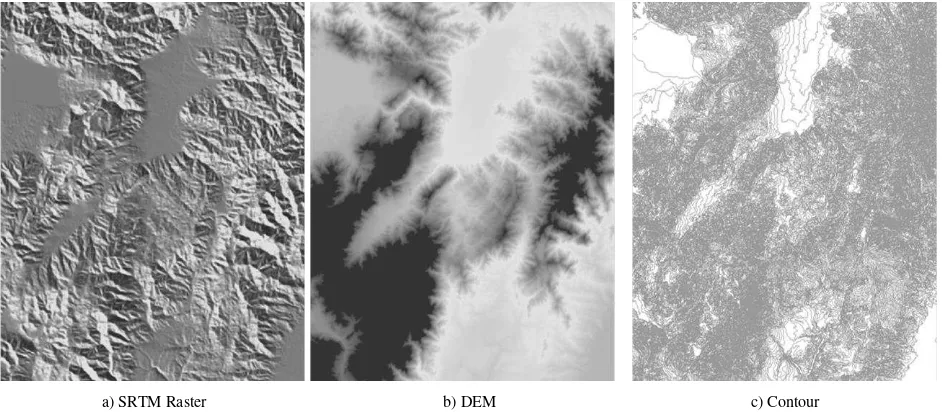
This research is carried out in eight watersheds in Central Sulawesi Province, Indonesia. Analysis of watershed morphometry characteristic is based on topographic data, taken from Indonesia Topographic Map (RBI) or from Digital Elevation Model (DEM) data with proper resolution. DEM data is converted from
Shuttle Radar Topographic Mission (SRTM) data to complete many objects (contour line, river network and other objects) on RBI map which is unrecorded or covered by cloud (Figure 3). Each variable is counted or measured based on watershed feature which is analyzed using Geographic Information System (GIS), in this case is Arc GIS 10 from ESRI, covers points, line and polygon
Hydrograph parameters are analyzed based on the couple rainfall and flood data in eight researched watershed and shall be transformed to average measured unit hydrograph for each watersheds. This analysis resulted three main hydrograph parameters i.e. peak time (TP), peak flow (QP) and base time (TB) for each watersheds. Finally, correlation analysis between parameters is carried out to investigate the effect each of morphometry parameters to hydrograph parameters.
a) SRTM Raster b) DEM c) Contour
Figure 3. Contour data which generated from DEM and and SRTM Topographic
III.RESULTS AND DISCUSSION
Morphometry Characteristic of Watershed A.
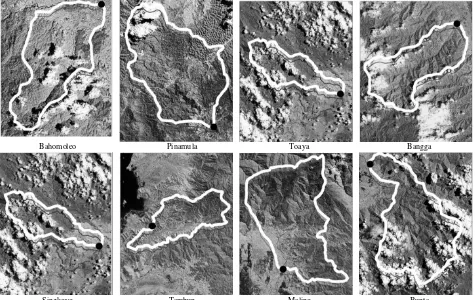
There are 8 watersheds in research area which used as parameter to develop synthetic unit hydrograph (SUH) as shown in Figure 4. These watersheds are Bahomoleo, Pinamula, Toaya, Bangga, Singkoyo, Tambun, Malino and Bunta, geographically situated in 6 watershed units (WS) in Central Sulawesi Province. Base on topography, these watershed are located on elevation ranged between 50 m to 1700 m above sea level. In general, watershed topography is formed by convex hilly surface start from
surging, hilly and mountain, with the dominant bevel inclination categorize steep (45%-65%) until very steep (>65%) [13]. Surging topography with the inclination until 15%, generally can be found in downstream around watershed outlet, hilly topography with the inclination until 45% in the bottom of mountain which border the paths of river of tributary, and mount topography (inclination more than 45 %) taking position of almost upstream of watershed.
such as straight and meander. In upstream area, river pattern tend to meandering form with large radius bends and varied cross section and tend to change.
If evaluated from land cover which published by Google Earth (2015), as seen in Figure 4, the land cover of watershed in study area is still well categorization, especially in upstream and middle area, consist of primary forest with moderate until high density. In downstream area around outlet of watershed, the land cover has been changed to farming and settlement area
The eight watersheds used as samples in this research had an area of 23.88 km2 to 144.73 km2 as shown in Table 1, and all of them belonged to meso scale watershed category which area range 10 km2<Area<1000 km2 [14, 15]. In general these watersheds had average
gradient of river above 3% including steep gradient of river category compared to river gradient in Java and Borneo islands in general, which represented rivers of typical mountain in Sulawesi Island. However, if they were further observed, river gradients varied according to their segments. In upstream, generally river gradient tended to be very steep, in middle segment it had moderate gradient whereas in downstream segment it had low gradient. Therefore, the influence of tide up and tide down to the river was hardly found because downstream had a positive gradient. As shown in Table 1, the eight watersheds also had various watershed form factor (FB). The highest watershed form factor was possessed by Tambun Watershed 0.50 which depicted similarity of watershed form with circular form with form factor of 0.754 for complete circular [4].
Bahomoleo Pinamula Toaya Bangga
Singkoyo Tambun Malino Bunta
Figure 4. The relationship between morphometry parameter and hydrograph parameter
TABLE 1.
MORPHOMETRY CHARACTERISTICS OF EIGHT (8) WATERSHEDS WHICH BE OBSERVED
Watershed Area of watershed (A,
km2) Main river length (L, m) Main river slope (S)
Form factor of
watershed (FB)
Bahomoleo 23,88 10315,36 0,07639 0,30
Pinamula 49,35 15636,28 0,03422 0,39
Toaya 65,51 21817,08 0,06532 0,21
Bangga 68,19 16484,77 0,08948 0,37
Singkoyo 116,05 26810,29 0,04569 0,22
Tambun 118,19 19990,61 0,09755 0,50
Malino 128,75 19192,51 0,10812 0,49
Bunta 144,73 28699,57 0,06359 0,36
Unit Hydrograph Parameters B.
Unit hydrograph parameters are obtained from measured unit hydrograph for each watershed derived
flow separation using this method has been widely used by researchers hydrology as Sri Harto [8], Limantara [16] and other researchers with various arguments such as ease in identifying the end of base flow at recession of hydrograph. The following (Table 2) are presented parameter unit hydrograph of eight were observed DAS.
The Effect of Morphometry Characteristics of C.
Watershed to the Hydrograph
Basically, the relationship between the variables in this case the independent variable (morphometric parameters) and the dependent variable (parameter
hydrograph) individually can be analyzed if there are several identical watersheds (morphometric parameters are uniform or similar but they have one of the different parameters to be tested), and is observed the response of hydrograph parameters. For example, there are 10 watersheds which have the same watershed parameters except the main river slope, therefore it can be analyzed the variation of main river slope (S) to hydrograph parameter changes (TP, QP and TB), and so on for the other parameters.
TABLE 2.
UNIT HYDROGRAPH PARAMETERS OF EIGHT WATERSHED
Watershed
The Effect of Morphometry Characteristics of D.
Watershed to the Hydrograph
Basically, the relationship between the variables in this case the independent variable (morphometric parameters) and the dependent variable (parameter hydrograph) individually can be analyzed if there are several identical watersheds (morphometric parameters are uniform or similar but they have one of the different
d) L - TP e) L - QP f) L - TB
g) S - TP h) S - QP i) S - TB
j) FB - TP k) FB - QP l) FB - TB
Figure 5. The relationship between morphometry parameter and hydrograph parameter
TABLE 3.
THE CORRELATION BETWEEN MORPHOMETRY PARAMETER AND HYDROGRAPH PARAMETER.
Watershed Parameters variable. In addition, watershed parameter will work simultaneously and together in order to influence the response of hydrograph parameters, so in fact it is very
difficult to determine the relationship between these variables individually(Sri Harto, 1985) [8].
watershed parameters that will be used to model each hydrograph parameters, although the relationship between the variables were tested simultaneously on the regression equation. Following is presented the relationship between watershed parameters (morphometry) with hydrograph parameters in the form of correlation and graph (Table 3 and Figure 5)
III.CONCLUSION
Based on analysis that have been done, It can be evaluated that eight (8) observed watersheds had an area (A) of 23.88 km2 to 144.73 km2, main river length (L) of 10.31 km to 28.69 km, main river slope (S) of 0.03422 to 0.10812 and form factor (FB) of 0.21 to 0.49. From correlation analysis, It seen that the watershed area affected very well to peak flow (QP) with correlation coefficient of 0.98. The main river length also affected very well to the peak time (TP) with correlation coefficient of 0.99. Two other morphometry parameters namely main river slope (S) and form factor (FB) did not show the effect which could be concluded. These two parameters showed low correlation coefficient.
It should be noted that some parameters have not shown clear effect, It is needed further research with advanced testing in other watersheds using more watershed data
ACKNOWLEDGEMENT
This article is part of doctoral research in Civil Engineering Department, Institut Teknologi Sepuluh Nopember (ITS) Surabaya. Author thanks to Ministry of Research, Technology and Higher Education which support with BPPDN Scholarship.
REFERENCES
[1] J. L. Wilkerson, “Regional regression equations to estimate synthetic unit hydrograph parameters for Indiana,” no. May, pp. 1–112, 2009. [2] V. B. Rekha, a V George, and M. Rita, “Morphometric Analysis and
Micro-watershed Prioritization of Peruvanthanam Sub-watershed, the Manimala River Basin, Kerala, South India,” Environ. Res. Eng. Manag., vol. 57, no. 3, pp. 6–14, 2011.
[3] T. Wagener, D. P. Boyle, M. J. Lees, H. S. Wheater, H. V. Gupta, and S.
Sorooshian, “A framework for development and application of
hydrological models,” Hydrol. Earth Syst. Sci., vol. 5, no. 1, pp. 13–26, 2001.
[4] K. Pareta and U. Pareta, “Quantitative Geomorphological Analysis of a Watershed of Ravi River Basin, H.P. India,” Int. J. Remote Sens. GIS,
vol. 1, no. 1, pp. 41–56, 2012.
[5] V. A. Rama, “Drainage basin analysis for characterization of 3 rd order watersheds using Geographic Information System (GIS) and ASTER data,” J. Geomatics, vol. 8, no. 2, pp. 200–210, 2014.
[6] H. Chandrashekar, K. V. Lokesh, M. Sameena, J. roopa, and G.
Ranganna, “GIS –Based Morphometric Analysis of Two Reservoir Catchments of Arkavati River, Ramanagaram District, Karnataka,”
Aquat. Procedia, vol. 4, pp. 1345–1353, 2015.
[7] B. S. D. Sagar, C. Omoregie, and B. S. P. Rao, “Morphometric relations
of fractal-skeletal based channel network model,” Discret. Dyn. Nat.
Soc., vol. 2, no. 2, pp. 77–92, 1998.
[8] Sri Harto, Synthetic Unit Hydrograph of GAMMA I. 1985.
[9] C. Asdak, Hydrology and Watershed Management. Yogyakarta: Gadjah
Mada University Press, 2007.
[10] K. Subramanya, “Engineering Hydrology,” 1995.
[11] U. Ratnayake, “Watershed Charateristic,” 2004.
[12] B. Triatmodjo, Applied Hydrology. 2008.
[13] I. Gede Tunas, N. Anwar, and U. Lasminto, “Fractal characteristic
analysis of watershed as variable of synthetic unit hydrograph model,”
Open Civ. Eng. J., vol. 10, pp. 706–718, 2016.
[14] A. B. Safarina, H. T. Salim, I. K. Hadihardaja, and M. S. Bk, “Clusterization of Synthetic Unit Hydrograph Methods Based on Watershed Characteristics,” Int. J. Civ. Environ. Eng. IJCEE-IJENS,
vol. 11, no. 6, pp. 76–85, 2011.
[15] A. B. Safarina, “Modified Nakayasu Synthetic Unit Hydrograph Method
For Meso Scale Ungauge Watersheds,” Int. J. Eng. Res. Appl., vol. 2,
no. 4, pp. 649–654, 2012.
[16] L. Montarcih, “Synthetic Unit Hydrograph of GAMA of Limantara,” J.
![Figure 1. The effect of watershed area to the hydrograph [11]](https://thumb-ap.123doks.com/thumbv2/123dok/1636965.1558339/2.595.129.503.536.663/figure-effect-watershed-area-hydrograph.webp)