Avalaible online at http://journals.ums.ac.id
IDENTIFYING THE PURCHASING POWER PARITY OF
INDONESIA RUPIAH (IDR) BASED ON BIG MAC INDEX
Tongam Sihol Nababan
Faculty of Economics, University of HKBP Nommensen, Jln. Sutomo No. 4A Medan, Indonesia, Phone : 061-4522922.
Corresponding E-mail : [email protected]
Recieved: November 2016; Accepted: December 2016
Abstract
The aim of this study is to identify : (1) profile of exchange rate and purchasing power parity of IDR against US $ based on Big Mac Index compared to the exchange rate of other countries, and (2) the position of the Big Mac Affordability of Indonesia compared to other ASEAN countries. The results showed that based on Big Mac index during the period April 1998 up to January 2015, IDR exchange rate tends to be undervalued against the USA dollar. The cause of the currency tends to be in a position of undervalued due to the components of nontradables have not been included in Big Mac index. The index of Big Mac Affordability indicates that there is a great disparity of income between Singapore and five other ASEAN countries. The purchasing power of the real income of the people in Singapore is nearly five times the real income of the people in Indonesia.
Keywords: Big Mac Index, Affordability, exchange rate, purchasing power parity, undervalued and overvalued, tradables and nontradables.
JEL Classification: E43 F41 G15
1. Introduction
As a country with an open economy, Indonesia has done a lot of economic cooperation with other countries, especially in the field of international trade. To get the optimum benefit from economic transactions, the role of the exchange rate system with foreign exchange is very important. According to Kuncoro (2015) the importance of foreign exchange rates, due to it deals directly with the sectors of international trade, investment, and even directly related to the foreign debt as a source of development funding. Determining foreign exchange rates have a great influence on the costs and benefitsto be obtained in international trade. There are many things that can affect changes in exchange rates, such as inflation, interest rates, national income, government restrictions, and predictions of market exchange rate in the future (Madura, 2006).
two currencies, and give a test of the extent to which market exchange rate result in goods with the same cost in different countries. This index is trying to make exchange rate theory a bit easier to digest (Wikipedia, 2016).
In this context, the term of “goods” is defined simply as a kind of the hamburger type, named Big Mac, produced by McDonald franchise company. According to Ong (2003) the Big Mac Index is a more palatable solution to the index-number problem, given that this hamburger is produced locally in more than 100 countries around the world, with only minor changes in recipe, and thus has the flavour of ‘the perfect universal commodity’. Up to now, a type of Big Mac is believed to be a universal perfect product because it has been produced locally in more than 120 countries, including Indonesia. It means, that Big Mac PPP is the exchange rate showing that Big Mac hamburger have the same price in all countries. The main objective to compare a country’s currency with the Big Mac PPP is to determine whether the currency is considered undervalued or overvalued against the other currency, such as US dollar (Olivon, 2013).
Indeed, the Big Mac index is not a perfect measure of PPP. Price differences may be distorted by trade barriers on beef, sales taxes, local competition and changes in the cost of non-traded inputs such as rents. But despite its flaws, the Big Mac index produces PPP estimates close to those derived by more sophisticated methods. A currency can deviate from PPP for long periods, but several studies accomplished by Alfheim (2015), Portes and Atal (2014), Chen et al (2007) have found that the Big Mac PPP is a useful predictor of future movements. So, the significance of this study lies on the widespread use of the index and thus perpetuation of perceptions on the relative value of currencies in the areas of corporate finance, international trade and finance, and international business. It should appeal not only to economic researchers and policy-makers but also to those who must deal with exchange rate issues in day-to-day business decisions.
Until now, Indonesia still applies the system of free floating exchange rate. The implementation of this exchange rate has caused the IDR to be weak and has slowed the economic growth. Simorangkir and Suseno (2004) said that the fall of IDR was mainly due to higher capital outflows and increase of speculative activities against the IDR, and also the condition of social and political stability. The strong influence of social and political instability on the development of the exchange rate is reflected in the movement of the exchange rate in line with the development of economic, social, and political in the country. The IDR exchange rate still continues to depreciate against the US dollar as the benchmark currency in the world. Therefore, to observe movements or fluctuations of the IDR, the PPP model with the Big Mac index is more relevant when applied. To find out if the exchange rate trading at the right level, then simply index Big Mac can be used to determine whether a currency is in line with the true value or overvalued (higher than the actual value) or even undervalued (lower than the actual value)
Therefore, this study analyzed how the position of the Indonesia Rupiah (IDR) exchange rate compared with other countries based on the index Big Mac. This study also analyzed how the development of IDR based on the Big Mac index from 1998 to 2015 according to the availability of data from The Economist. Atal (2014) states that Big Mac index model (Burgernomics) have been widely used to measure other indicators as was done by Hoefert and Hofer (2006). They discovered how many hours the average that worker had to work to get enough money to buy a Big Mac burger in a country. It provides an information about the differences of wage level in some countries.
Avalaible online at http://journals.ums.ac.id
2004). In this study, Big Mac daily affordability is analyzed in some ASEAN countries, such as Indonesia, Malaysia, Singapore, Thailand, Philippine, and Vietnam. Therefore, the purpose of the study is also to analyze the profile of purchasing power parity of IDR compared with other countries based on Big Mac index, as well as to determine the position of Big Mac Affordability of Indonesia compared to other ASEAN countries.
2. Literature Review
2.1. Theory of Purchasing Power Parity (PPP)
A Swedish economist, Gustav Cassel, in the early of 20th century has popularized the purchasing power parity (PPP) as the essence of exchange rate theory. Theory of PPP assumes that in some circumstances (for example, as a long-run tendency) it would cost exactly the same number of, for example, US dollars to buy euros and then to use the proceeds to buy a market basket of goods as it would cost to use those dollars directly in purchasing the market basket of goods. Explanation of PPP theory is closely related to “The Law of One Price”. The law of one price is an economic concept which posits that “a good must sell for the same price in all locations”. This law is derived from the assumption of the inevitable elimination of all arbitrage. (Wikipedia, 2016 ; Cheung, 2009).
Lee (2009), Pakko and Pollard (2003), express that PPP is a measure of the relative purchasing power of different currencies. This is measured by the price of the same goods in different countries, converted to the currency exchange rate of the country against the “base currency”, usually in US dollar, as the currency most accepted in the world. For example, ideally, a car which almost has the same size and quality price will cost same all over the world. Despite the different prices in different currencies unit, but once converted to the exchange rate, the price will be same. That is, the difference in domestic prices will be offset by the difference in the values of currencies. Furthermore, Levanoni & Darnell (1999) notifies
that the main difficulties associated with the implementation of the PPP theory are : (1) the problem of identifying the items which should be subject to the law of one price, (2) how to weight the relevance of the items in each market, and (3) how the relative weights of these goods in the market. Complicating this issue indicates that the goods being compared will continue to change. For example, such as computers and other electronic gadgets.
PPP theory is divided into two versions : absolute version and relative version. Absolute version of PPP theory is often associated with the theory of the Law of One Price despite the fact that there is a difference between the two. The theory of the Law of One Price is applied only to one type of goods while the PPP theory is applied to the overall price level by using a basket of goods and services.
According to Alfheim (2015) the historical PPP hypothesis is based on the well known law of one price concept. Simplistically speaking it relates to that absent restrictions such as transportation costs, taxes and tariffs a good foreign currency compared to the home country’s currency. The market force that the law of one price concept relies on is that of arbitrage.
rising in the cheaper country while prices would decline in the more expensive country until parity is restored once again. Furthermore it is also assumed within this framework that for each country, amount n of goods produced are homogeneous equivalent to each other and thus by adding n goods together one can obtain a measure of the overall price level of each country, illustrated here by formula (2) and (3).
= (2)
= (3)
α here represents the weights that used in order to add up the individual prices and the assumption here is that the weights are identical across countries.
Using the price levels mentioned above we can now derive the condition of Absolute PPP as follows:
(4)
Equation (4) above states that for Absolute PPP, a country’s nominal exchange rate is determined from a ratio of the price levels in both countries. As with the law of one price, Absolute PPP is driven by the same market mechanism of arbitrage. Absolute PPP is generally considered as a long-run relationship meaning that when the price levels have reached equilibrium after some time, the process of arbitrage has been completed. Alternatively equation (4) can also be expressed in logarithms as shown below.Where the lower case letters shows that a natural logarithm transformation has been used.
(5)
Another alternative way of showing Absolute PPP is by adapting it in terms of the real exchange rate, here Q. Here Absolute PPP holds and is in parity when q is equal to one as shown in equation (6) below.
(6)
whereas transformed to logarithm, it should equal zero as shown below.
(7)
However, a close correlation between nominal and real rates manifests as a violation of PPP. This is because if PPP were to hold true for a specific currency, the logarithm of the real exchange rate would not differ from the nominal exchange rate, it would be independent from it (MacDonald 2007).
Another version of PPP is known as Relative PPP, which is relatively uncontroversial compared to its counterpart Absolute PPP. Relative PPP is obtained by expressing equation (5) in terms of changes ∆ and denotes a first difference operator which is a special case of lag polynomial.
(8)
Relative PPP demonstrates that countries with a high inflation rate will encounter a depreciating currency, and the opposite is expected to occur to countries with low inflation rates. It is also implicated that the price ratio is proportional to the exchange, while this does not necessarily mean that it is equal to parity. This is contrary to Absolute PPP where the condition is that the exchange rate equals the price ratio. However there is still a dependent relationship between the two theories since if Absoulute PPP holds up then the same applies to Relative PPP. But if Relative PPP holds then it does not necessarily hold for Absolute PPP since it can occur that changes in nominal exchange rates happens at different levels of purchasing power for the two currencies (Taylor and Taylor, 2004).
The calculation method of Big Mac Index is that the exchange rate between two countries can be compared by dividing the price of a Big Mac in one country (in its currency) by the price of a Big Mac in another country (in its currency : for example US $). This value is then compared with
the actual exchange rate. If the rate is lower, then the first currency is undervalued (according to PPP theory) compared with the second currency. Conversely, if the rate is higher, then the first currency is overvalued (He, 2013 ; Wikipedia, 2016 ; O’Brien and Vargas, 2016a). In formula it can be specified :
(9)
(10)
If IVOC > 0 currency is overvalue, and if IVOC < 0 currency is undervalue.
Despite some economists have extensively cited the Big Mac index as a measure of the real world to the PPP, MacConnel & Brue (2004) notices that there are limitations to the methodology of this burger in estimating the PPP. In many countries, eating at international fast food restaurants (at McDonald’s restaurants) is relatively more expensive when compared to Jurnal Ekonomi Pembangunan, 17 (2), December 2016, 210-231
Avalaible online at http://journals.ums.ac.id
version, i.e the unrealistic assumptions such as the lack of transportation costs and free of trade barriers. In reality, the cost of transportation and trade barriers can not be ignored. In the relative version, PPP theory changes the price level and equilibrium exchange rate to be “price change” and “equilibrium exchange rate change” (Agustin, 2009 ; Marpaung, 2011).
An example of the use of PPP theory
is closely related to theory of “The Law of One
Price“ is a hamburger standard, named Big
Mac type. For example, the price of a Big Mac in
Thailand is Bath 50 and the price of the same Big
Mac in the United States is USD 2.5. This
condition indicates the PPP exchange rate is
quite large : Bath 50/2.5 = Bath 20/USD. If the
exchange rate of Bath against US dollar
pre-vailing in the market is Bath 25/USD (greater
than the PPP exchange rate), then Bath Thailand
have been undervalued against USD. For example, using the data in July 2008 : price of
a Big Mac is US $ 3.57 in the United States of America. Price of a Big Mac is £ 2.29 in the United Kingdom (although there are differences across regions). It means that implication of PPP is $ 1.56 to £ 1, which is $ 3.57/£ 2.29 = 1.56. This is then compared with the actual exchange rate at the time, US $ 2.00 to £ 1 [(1.56 to 2.00)/2.00] * 100 = -22%. Thus, the pound was considered to be overvalued against the US $ by 22%. So, this index is trying to make the exchange rate theory to be easier to digest. Ong (2003) said that Big Mac index is popular to outline a novel and potentially useful enhancement to PPP for use in understanding the likely trends in exchange rates.
takes its name from the Big Mac, a product hamburger sold at McDonald’s restaurants. It compares the purchasing power of two currencies. It looks at how expensive a Big Mac is in different countries. Index Big Mac was first introduced in The Economist in September 1986 by Pam Woodall as a form of semi-humorous illustrations, and regularly updated and published by the magazine each year since then. The McDonald’sBig Mac was chosen because it is made in a similar way with similar ingredients in many countries around the world. This index also gives birth to the term of burgernomics (Pakko and Pollard, 1996 ; Pakko and Pollard, 2003 ; Daely, 2008 ; Clements et al, 2014).
The Big Mac Index is an economic index. Index 2.2. Burgernomics : Big Mac Index
The question that arises is :“Why is the value of currency to be undervalued or overvalued ?” Or “why is the price of Big Mac pegged too expensive or too cheap?” In the Big Mac index, the important thing to understand is that relatively expensive or relatively cheap always deals directly with the owner of US $ currency, not the local buyers with local currency.
It can be argued that the result of the the Big Mac index calculation is still a rough estimate due to the accuracy of data is highly dependent on the correctness of financial statements of McDonald published by The Economist. Until now, the calculation of Big Mac index still adher the theory of PPP with the absolute version, often associated with the theory of Law of One Price. This theory assumes that the identical goods (the same type) in many countries should be sold with the same price. Besides, many components
of Big Mac expenses that are not be traded (nontradables), such as rent expense of building, salary of workers, and other expenses that are not taken into account. For this reason, the exchange rate of currency in a country that not incorporate the components of those expenses will tend to be undervalued.
Furthermore, Peter (2013) says that the Big Mac Index has some limitations because it only uses a single product. But the most important problem is how nontradables (i.e, goods and services that can be sold only locally but can not be traded internationally) are treated in the calculation of the Big Mac Index. Theoretically, the local price of a Big Mac should include the price of tradables and nontradables. In international trade, it is expected that the prices of tradables are the same in all countries, even if the price of non-tradables are different. Generally, it is acknowledged that the price of nontradables will increase in accordance with increasing of income per capita. Therefore, the greater the difference of income per capita in a certain country compared with other countries, the greater the difference of the price of nontradables. The difference of Big Gie (2009) explains that the theory of purchasing power parity can only be applied in the long term. According to him, the hamburger is a measuring instrument that is very misleading. Price of hamburger in each country could be affected by import duties, sale taxes, or a large difference in the expense of rent store that sells hamburgers. However, Gie (2009) also states that several studies on the Big Mac Index show that speculating on the currency whose value “undervalued” is a profitable strategy if used in foreign currency business. Hsu (2012) also expressed that the formula of Big Mac Index has not fully consider the costs of production and transportation, employee salaries, demand factors, regional taxes and other factors that vary widely in each country. Meanwhile, Rooney (2015) and Olivon (2013) stress that the price of Big Mac burger is usually cheaper in poor or developing countries where labor costs are lower.
He (2013) explains that key factors of the exchange rate are still very complex. For example, a country’s level of economic development, international status, labor costs will have an effect on the exchange rate. The price of commodities in developing countries are generally lower than developed countries, because developing countries have lower labor costs. In addition, changes in the real exchange rate in the international market also depend on changes in currency supply and the adjustment of macroeconomic and financial policies of a country. According to him, due to the exchange rate of a country is always experiencing dynamic change, it should not only use the Big Mac index to assess the level of PPP.
Avalaible online at http://journals.ums.ac.id
Mac price could also reflect not only the difference of income per capita between the countries concerned, but also the share of nontradables which is part of the Big Mac index. Finally, it can be said that the BigMac index has a value as a measurement, but it would be wrong when people start using this index for a more serious purpose.
Many people assume that the Big Mac Index is is still premature because it only uses one product as an indexer of purchasing power parity. Eventhough Gie (2009) refers to it as a measuring tool that misleading because of the human need is not just hamburger. It should be determined on the basis of a basket of goods and services which representative for the necessities of life for the representative group of people anyway. However, because of the difficulty of determining a group of goods and services, then it take one item only.
Therefore, the Big Mac Index is used as a simple guidance, because there are important factors that establish the value of a country’s currency strengthened or weakened against the US $. For example, the condition of the balance of payment, balance of trade, the confidence of investors, as well as government policies. These factors will continue to make the value of a currency keep moving. But in reality, many parties who publish and use this index as a measure of purchasing power parity, for example magazines of Forbes, CNN Money, the Los Angeles Times. The articles that discuss Big Mac Index have also been widely found and be viewed in such an international repository SSRN (Social Science Research Network) and Google Scholar.
2.3. Big Mag Affordability Index
Atal (2014) has performed an analysis index Big Mac Index and the disparity of real income for 54 countries and compared with the Gross Domestic Product (GDP) per capita during the period of year 2000-2012. This study gives a rough estimate of the affordability index of a country to find how many the average of Big Mac burger can be produced by a person per day in a country. Affordability index is obtained by dividing the
GDP per capita and the price of a Big Mac burger. In formula it can be written :
(11)
The results showed that people in Hong Kong were able to produce the number of Big Mac burger is more than 47 burgers per day (its currency was undervalued by 50% in 2012). People in the United States were able to produce more than 32 burgers every day and in the UK were able to produce 25 burgers (the British pound was undervalued by 4%). The people of Singapore, Australia, Norway, andthe countries of the Euro zone were capable of producing more than 25 Big Mac burgers per capita per day.
However, when seen in the BRIC countries (Brazil, Russia, India, China) together were capable of producing 17 burgers per capita daily with undervelued to its currency by 47%. Individually, Brazil and China were capable of producing 6 burger per capita per day, while the Brazilian real currency was overvalued by 14% and the Chinese yuan was undervalued by 43%. Among the BRIC countries, India was only able to produce burger 2.59 per capita per day (undervealued to Rupee currency by 63%). Of all the 54 countries, the Philippines and Pakistan were only able to produce 2.5 and 1.1 burgers per capita per day. The results also showed that although the price of a Big Mac burger was very cheap (in US $) in some countries, people can hardly afford tu buy it. This indicates a large disparity in real income among countries.
3. Data and Analysis Method 3.1. Data
been just issued since 1998. To investigate the Big Mac Affordability index between Indonesia and ASEAN countries, this study used GDP per capita. The GDP per capita sourced from publication of the IMF World Economic Outlook in period of year 2013 up to 2015.
3.2. Analysis Method
In this study, descriptive analysis is used to describe a situation or problems associated with the data. The Big Mac Index is used to compare the purchasing power parity (PPP) of IDR to US $. Then the Big Mac Affordability Index is used to investigate the disparity of real income among ASEAN countries.
Based on formula (9) in section 2. 2 the Big Mac index can be derived by dividing the price of a Big Mac in Indonesia (in IDR) with the price of a Big Mac in United States (in US $). In formula, average price of Big Mac hamburger in the USA year i ($ USA). Then the price of Big Mac (in US $) based on exchange rate can be obtained by the formula :
Price US $ = PINDi / AERi (13)
where AERi is average of Actual Exchange Rate
of IDR to US $.
To determine whether the IDR be overvalued
or undervalued against US $ can be obtained by
using the Index of Value of Currency (IVOC) or Implied Dollar Valuation. Here, IVOC or Implied Dollar Valuation is real Big Mac Index. Based on formula (10) in section 2. 2, IVOC can be stated in percentage (%) and formulated as follows :
(14)
Then the index of Big Mac Affordability can be examined by inserting GDP per capita to determine the inequality of real income per capita. The index of Big Mac Affordability explains how many the average of Big Mac burger per day can be bought by a person with his or her income per capita in Indonesia compared to other countries (some ASEAN countries). Index of Big Mac Affordability can be calculated by the formula (11) in section 2. 2 :
(15)
Where BMAij is daily Big Mac Affordability index
of year i in country j, BMPijis price of Big Mac hamburger of year i in country j ( US $), and
GDPijis Gross Domestic Product per capita of year i in country j.
4. Results and Discussion
4.1. Price of Big Mac Burger in Indonesia and the United States, the Exchange Rate of IDR to US Dollar
Since 1986 The Economist magazine has published the price of Big Mac burger type in various countries. In 1986 The Economist just published the price of Big Mac burger from 15 countries, ten years later (1996) to be 33 countries, and ten years later (2006) to be 45 countries. Then, in 2015 has already been 57 countries. This shows that until now only about 48% of the 120 countries branch of McD published by The Economist. The price of Big Mac burger of Indonesia has recently published by The Economist from 1998.
Based on the data availability of The Economist, the complete price data of Big Mac burger in Indonesia published is only the data
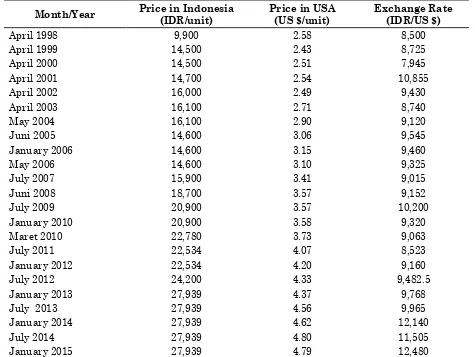
from 1998 to 2015. Table 1 below presents the price of Big Mac burger in IDR and in US $.
Table 1. The price of Big Mac burger in IDR and in US $, Exchange Rates of IDR to US $ (1998 – 2015)
Month/Year Price in Indonesia (IDR/unit)
Price in USA (US $/unit)
Exchange Rate (IDR/US $)
April 1998 9,900 2.58 8,500
April 1999 14,500 2.43 8,725
April 2000 14,500 2.51 7,945
April 2001 14,700 2.54 10,855
April 2002 16,000 2.49 9,430
April 2003 16,100 2.71 8,740
May 2004 16,100 2.90 9,120
Juni 2005 14,600 3.06 9,545
January 2006 14,600 3.15 9,460
May 2006 14,600 3.10 9,325
July 2007 15,900 3.41 9,015
Juni 2008 18,700 3.57 9,152
July 2009 20,900 3.57 10,200
January 2010 20,900 3.58 9,320
Maret 2010 22,780 3.73 9,063
July 2011 22,534 4.07 8,523
January 2012 22,534 4.20 9,160
July 2012 24,200 4.33 9,482.5
January 2013 27,939 4.37 9,768
July 2013 27,939 4.56 9,965
January 2014 27,939 4.62 12,140
July 2014 27,939 4.80 11,505
January 2015 27,939 4.79 12,480
Source : The Economist, 2015 (http://bigmacindex.org/2015-big-mac-index.html), data processed by author.
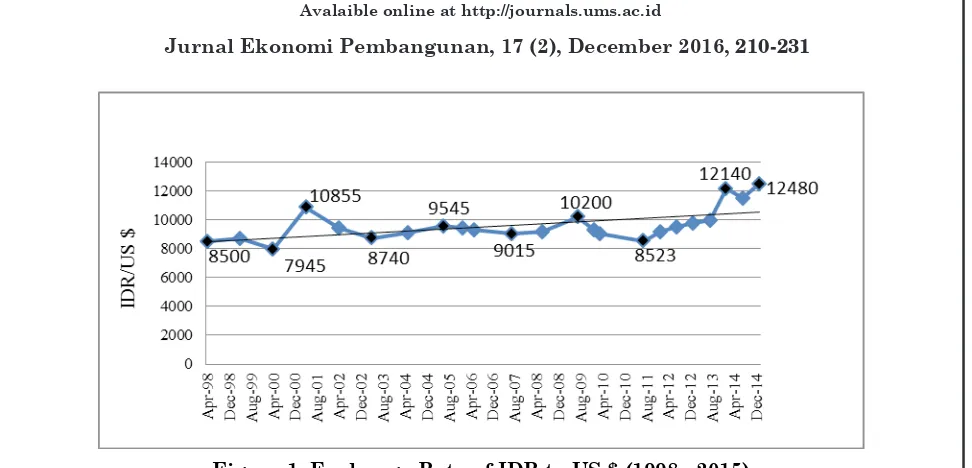
According to the data sourced from The Economist as shown in Table 1, the exchange rate development of IDR to US $ during the period 1998 - 2015 fluctuated as shown in Figure 3.In April 1998 the IDR to US $ on the position of IDR 8,500/US $, then in February 2000 strengthened to the position of IDR 7,945/ US $, and weakened again in January 2001 to IDR 10,855/US $.Furthermore, in October 2003
the position strengthened to IDR 8,740/US $, fell back in April 2009 on the position of IDR 10,200/ US $ and strengthened to the position of Rp 8523 / USA $ in July 2011.But from 2012 to 2015 the position was weakened. However, the trend line showed that during this period the position of the IDR to US $ tend to weaken, as shown in Figure 1.
Avalaible online at http://journals.ums.ac.id
Figure 1. Exchange Rate of IDR to US $ (1998 - 2015) From the above opinions it can be affirmed
that IDR currency is easy to fluctuate or depreciate, because the economy of Indonesia is relatively less established. The currencies of developing countries in general included in soft currency, because of its ability to influence the value of the currency is not strong. A special characteristic of soft currency is more sensitive to the conditions of international economic. In other side, the value of IDR is always dependent on foreign investors’ confidence in the outlook for business in Indonesia. The better the business climate of Indonesia, there will be more foreign investment in Indonesia, and thus the IDR value will be more intensified. Conversely, the negative outlook of investors to Indonesia, the IDR value will weaken. Then, in times of uncertainty before
the turn of the leadership of the state (president), some investors are wary and will wait until the elected new leaders to show more convincing economic sentiment. As a result, the season before the president election is generally characterized by a weakening of IDR.
4.2. Big Mac PPP of Indonesia
Big Mac Index of Indonesia can be calculated based on formulas in Section 2.2 with the steps : to determine the Big Mac PPP by using the formula (9), then to determine the Price Dollar and as for determining whether the value of the IDR is overvalued or undervalued to US $ using formula (10). Using the data in Table 1, the Big Mac Index of Indonesia can be obtained as follows:
Year 1998 : BMPPP1998 = 9900/2.58 = 3837 Price dollar1998 = 9900/8500 = $ 1,16
IVOC1998 = (3837 – 8500)/8500 = - 54,86 % (undervalued) Year 1999 : BMPPP1999 = 145000/2.43 = 5967
Price dollar1999 = 14500/8725 = $ 1,66
IVOC1999 = (5967 – 8725)/8725 = - 31,67 % (undervalued) Year 2000 : BMPPP2000 = 145000/2.51 = 5776,89
Price dollar2000 = 14500/7945 = $ 1,83
IVOC2000 = (5776,89 – 7945)/7945 = - 27,29 % (undervalued) With the same way, the complete calculation of
Big Mac PPP, Prices in Dollars (Price of Big Mac
Avalaible online at http://journals.ums.ac.id
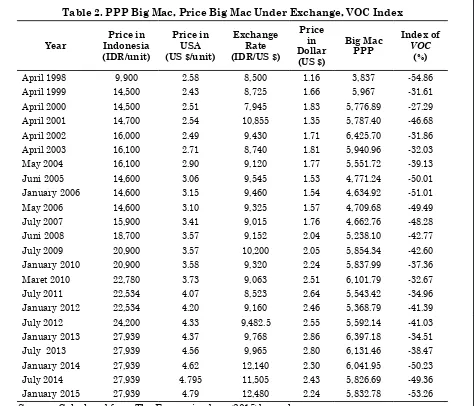
Table 2. PPP Big Mac, Price Big Mac Under Exchange, VOC Index
Year
Price in Indonesia (IDR/unit)
Price in USA (US $/unit)
Exchange Rate (IDR/US $)
Price in Dollar (US $)
Big Mac PPP
Index of VOC
(%)
April 1998 9,900 2.58 8,500 1.16 3,837 -54.86
April 1999 14,500 2.43 8,725 1.66 5,967 -31.61
April 2000 14,500 2.51 7,945 1.83 5,776.89 -27.29
April 2001 14,700 2.54 10,855 1.35 5,787.40 -46.68
April 2002 16,000 2.49 9,430 1.71 6,425.70 -31.86
April 2003 16,100 2.71 8,740 1.81 5,940.96 -32.03
May 2004 16,100 2.90 9,120 1.77 5,551.72 -39.13
Juni 2005 14,600 3.06 9,545 1.53 4,771.24 -50.01
January 2006 14,600 3.15 9,460 1.54 4,634.92 -51.01
May 2006 14,600 3.10 9,325 1.57 4,709.68 -49.49
July 2007 15,900 3.41 9,015 1.76 4,662.76 -48.28
Juni 2008 18,700 3.57 9,152 2.04 5,238.10 -42.77
July 2009 20,900 3.57 10,200 2.05 5,854.34 -42.60
January 2010 20,900 3.58 9,320 2.24 5,837.99 -37.36
Maret 2010 22,780 3.73 9,063 2.51 6,101.79 -32.67
July 2011 22,534 4.07 8,523 2.64 5,543.42 -34.96
January 2012 22,534 4.20 9,160 2.46 5,368.79 -41.39
July 2012 24,200 4.33 9,482.5 2.55 5,592.14 -41.03
January 2013 27,939 4.37 9,768 2.86 6,397.18 -34.51
July 2013 27,939 4.56 9,965 2.80 6,131.46 -38.47
January 2014 27,939 4.62 12,140 2.30 6,041.95 -50.23
July 2014 27,939 4.795 11,505 2.43 5,826.69 -49.36
January 2015 27,939 4.79 12,480 2.24 5,832.78 -53.26
Source : Calculated from The Economist data (2015)by author.
Furthermore, to see the clearer development of Big Mac PPP and Exchange Rate, IVOC, and the difference of Prices in Dollars (price of Big
Mac under exchange rate) and Price in USA can be figured as follows :
Figure 2. Big Mac PPP and Exchange Rate of IDR to US $ (Source : Table 2).
Figure 4 : The difference of Prices in Dollars (price of Big Mac under exchange rate) and Price in USA
(Source : Table 2)
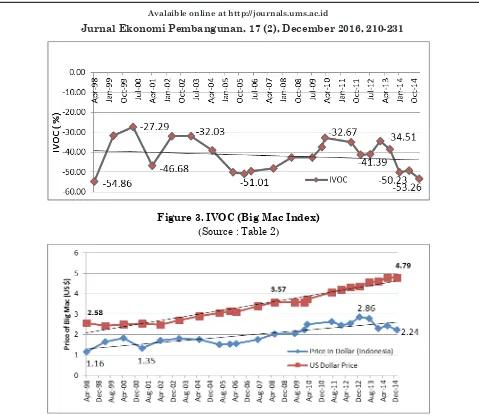
Figure 2 shows that the development of the Big Mac PPP in Indonesia during the period of April 1998 to January 2015 tends to increase. This indicates that the index of Big Mac PPP based on the purchasing power of IDR continued to decline during the period. This fact is also characterized by the value of IDR against US $ which tend to weaken during the period. How is the real profile of IDR when compared with US $ ? This can be viewed in the Index Valuation ofCurrency (IVOC) as calculated above and the details are presented in Table 2 and Figure 3.
In April 1998 the price of a Big Mac burger in Indonesia amounted to IDR 9,900 per unit, whereas in the USA amounted to $ 2.58 per unit.
The exchange rate of IDR to US $ is IDR 8,500 /US $. If it converted to US $ then the price of a Big Mac burger in Indonesia amounted to US $ 1.16 per unit. With the Big Mac PPP is IDR 3,837, the IVOC or Big Mac Index shows that the value of IDR is undervalued as 58.86%. It means that purchasing power parity of IDR against the US $ is considered too low by 58.86%. But in April 2000 the purchasing power parity is strengthened by 27.29% eventhough the value kept on undervalued.
Figure 4 indicates that during the period of April 1999 to January 2015, PPP of IDR against US $ fluctuated with undervalued by an average of 41.78%. Figure 4 also showed that during the Figure 3. IVOC (Big Mac Index)
Avalaible online at http://journals.ums.ac.id
period of April 1998 to January 2015 the price of a Big Mac burger in Indonesia is cheaper than the price of a Big Mac in the United States. During this period the average price of a Big Mac burger in Indonesia amounts to USA $ 2.04 per unit, whereas in the United States its price is average of US $ 3.52 per unit.
To know the profile of PPP of IDR based on Big Mac Index, it has to be compared with other countries in the world. Based on data derived from The Economist magazine for three years (January 2013 - January 2015), the profile of PPP of IDR is visualized in Appendix 1, Appendix 2, and Appendix 3. The three figures also shows the difference of big mac price and intensity of currencies in the world.
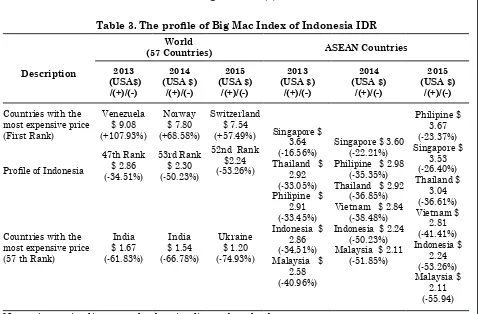
In Appendix 1 or Big Mac index in January 2013, it appears that of the 57 countries, the price of a Big Mac in burger Indonesia is US $ 2.86 per unit and occupied in the position of eleventh the countries with the lowest price. At this position, IDR is undervalued by 34.51% against the US $. The cheapest price of Big Mac is found in India for US $ 1.67 per unit and its currency Rupee is undervalued as 61.83% against the US $, while the most expensive BigMac contains in Venezuela for US $ 9.08 per unit and its currency Bolivar is overvalued as 107.93% against US $. When compared with some ASEAN countries, Indonesia occupied in the position of second for Big Mac with the lowest price for US $ 2.86 per unit. The first position is occupied by Malaysia for US $ 2.58 per unit and the value of its currency Ringgit is undervalued by 40.96%. The most expensive is occupied by Singapore for US $ 3.64 per unit and the value of its currency SIN $ is undervalued by 16.56%.
In 2014 (Appendix 2), Big Mac price in India is the cheapest as US $ 1.62 per unit and the currency is undervalued by 74.93%. IDR is undervalued by 50.23% with Big Mac price for US $ 2.30. The most expensive Big Mac contains in Norway for US $ 7.80 per unit and the currency
is overvalued by 68.58%. Other interpretation shows that in 2015 (Appendix 3), Big Mac price in Ukraine is the cheapest for US $ 1.20 per unit and the currency was undervalued by 74.93%. IDR was undervalued by 53.26% with Big Mac price for US $ 2.24. The most expensive Big Mac contains in Switzerland for USA $ 7.54 per unit and the currency was overvalued by 57.49%. Based on Appendix 1, Appendix 2 and Appendix 3, the profile of Big Mac price and Big Mac Index of Indonesia IDR when compared to the world (57 countries) and ASEAN can be concluded in Table 3.
What can we gain from the explanation of
above figures ? For an example, in January 2014,
it cost $ 4.62 to buy a Big Mac in the United States, $ 5.36 buy a Big Mac in Belgium, and $ 2.30 to buy a Big Mac in Indonesia. Thus a Big Mac devotee could buy nearly one and two-fifths of the sandwiches in the United States for every one he could purchase in Belgium. He could buy less than a half of a Big Mac in the United States for every one he could enjoy in Indonesia. However, one wouldn’t expect Japanese and U.S. consumers to import Big Macs from Indonesia to take advantage of the lower prices—a Big Mac sandwich shipped halfway across the globe would probably not arrive in a very appetizing form. Nevertheless, because the components of a Big Mac are traded on world markets, the law of one price suggests that prices of the components should be the same in all markets. If the Big Mac is no more than the sum of its ingredients, then trade should equalize the price of a Big Mac across borders ; or at the least, differences between prices should narrow over time. Instead, the dollar price of a Big Mac in the three countries diverged by even more in January 2015 than in January 2014. In January 2015 it cost $ 2.24 to buy a Big Mac in Indonesia, $ 4.79 to buy a Big Mac in the United States, and $ 4.29 to buy a Big Mac in Belgium.
Table 3. The profile of Big Mac Index of Indonesia IDR
Note : sign (+) implies overvalued, (-) implies undervalued.
How do we explain these deviations from PPP ? Here, the Big Mac can serve as a useful example of why there tend to be systematic departures from PPP. According to Pakko and Pollard (1996), there are four main considerations why this could happen, namely : the existence of barriers to trade, the inclusion of non-traded elements in the cost of a Big Mac, imperfect competition, and the existence of current account imbalances.
4.3. Gross Domestic Product (GDP),
GDP per Capita, Price of Big Mac Burger in The ASEAN Countries The price of Big Mac can also be used to compare the real income disparity in a country
with other countries. It is associated with GDP per capita and named as Big Mac Affordability Index. With this index can be known how many the average of Big Mac burger can be afford to be bought per day by a person in a country, so it may reflect real income disparities among countries.
The calculation of affordability index requires data of GDP per capita and the price of Big Mac burger of a country. In this study, the two data collected from some ASEAN countries, i.e : Indonesia, Malaysia, Singapore, Philipine, Vietnam, and Thailand. Table 4 and Table 5 below present the GDP per capita and the price of a Big Mac burger in some ASEAN countries.
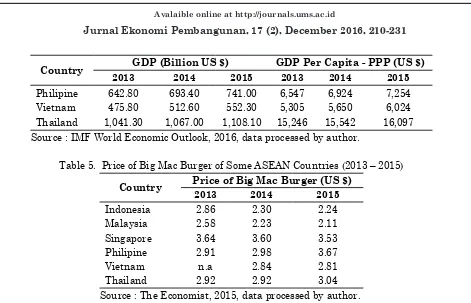
Table 4. GDP Per Capita of Some ASEAN Countries (2013-2015)
Country GDP (Billion US $) GDP Per Capita - PPP (US $)
2013 2014 2015 2013 2014 2015
Country GDP (Billion US $) GDP Per Capita - PPP (US $)
2013 2014 2015 2013 2014 2015
Philipine 642.80 693.40 741.00 6,547 6,924 7,254 Vietnam 475.80 512.60 552.30 5,305 5,650 6,024 Thailand 1,041.30 1,067.00 1,108.10 15,246 15,542 16,097 Source : IMF World Economic Outlook, 2016, data processed by author.
Table 5. Price of Big Mac Burger of Some ASEAN Countries (2013 – 2015)
Country Price of Big Mac Burger (US $)
2013 2014 2015
Indonesia 2.86 2.30 2.24
Malaysia 2.58 2.23 2.11
Singapore 3.64 3.60 3.53
Philipine 2.91 2.98 3.67
Vietnam n.a 2.84 2.81
Thailand 2.92 2.92 3.04
Source : The Economist, 2015, data processed by author.
4.3. Profile of Indonesia’s Index Big
Mac Affordability Among ASEAN Countries
The number of those who criticize the Big Mac Index (BMA) make it to be revised by making adjustments. For example, the study performed by Atal (2014) offers an estimate of the affordability index of a country to find how many the average of Big Mac burger can be produced or bought by one person per day in a country with his or her income. Likewise with O’Brien and Vargas (2016) have also been trying to insert the variable of GDP in predicting Big Mac Index to bring the exchange rate of a particular currency more realistic. That is why The Economist suggested that to connect between the price of a Big Mac and economic output may be a better guide to measure the fair value of the currency today (Rooney, 2015).
In this study, Big Mac Affordability Index is calculated for some ASEAN countries to view the profile of Indonesia. By using the formula (11) in Section 2.2 and using data in Table 4 and Table 5 in Section 4.2, Big Mac Affordability Index was obtained as follows:
BMA Indonesia (2013) = (10110 / 2.86) / 365 = 9.68
BMA Singapura (2013) = (80821 / 3.64) / 365 = 60.83
BMA Thailand (2013) = (15246 / 2.92) / 365 = 14.30
BMAMalaysia (2013) = (23874 / 2.58) / 365 = 25.35
BMAPhilipina (2013) = (6547 / 2.91) / 365 = 6.16
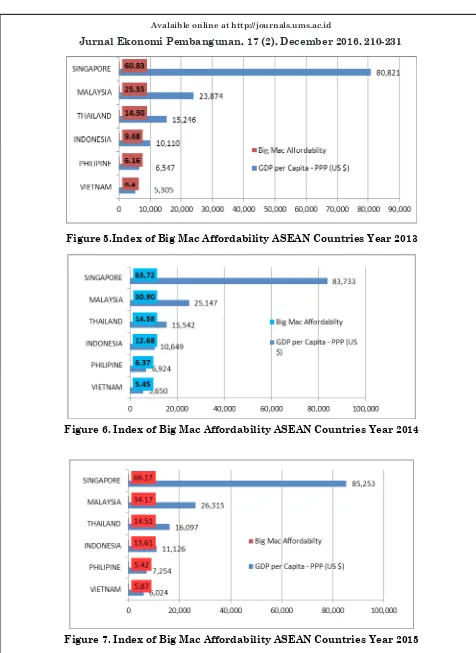
In the same way, it can be obtained BMA Index to some ASEAN countries as presented in Table 6 and Figure 5, Figure 6 and Figure 7.
Table 6 : Big Mac Index Affordability ASEAN Countries (2013 – 2015)
Country 2013 2014 2015
Indonesia 9.68 12.68 13.61 Malaysia 25.35 30.90 34.17 Singapore 60.83 63.72 66.17 Philipine 6.16 6.37 5.42
Vietnam n.a. 5.45 5.87
Thailand 14.30 14.58 14.51 Source : Data processed by author, 2016 Avalaible online at http://journals.ums.ac.id
Figure 6. Index of Big Mac Affordability ASEAN Countries Year 2014
Figure 7. Index of Big Mac Affordability ASEAN Countries Year 2015 The above figures show that during the years
of 2013 – 2015 Singapore occupied the highest position of Big Mac Affordability index. It meant
Avalaible online at http://journals.ums.ac.id
units per day. The second sequence is occupied by Malaysia where every people has been able to produce or to buy Big Mac burger on average of 30 units per day with average of GDP per capita for US $ 25,112. The third place is occupied by Thailand with average of GDP per capita for US $ 15,628 and they have been able to produce or buy Big Mac burger on average of 14 units per day. The fourth place is occupied by Indonesia in which everyone has been able to produce or buy Big Mac burger on average of 12 units per day with average of GDP per capita for US $ 10,628. The next is occupied by the Philippines and Vietnam in which everyone has been able to produce or buy Big Mac burger only on average of 6 units per day during the year 2013-2015 with each average of GDP per capita for US $ 6,908 and US $ 5,660.
The figures of Big Mac Affordability index above indicate that there is a great income disparity between Singapore and five other ASEAN countries. It can be said that the purchasing power of the real income of the people in Singapore is almost 11 times the real incomes of people in the Philippines and Vietnam, nearly five times the real incomes of the people in Thailand and Indonesia, and twice the realincome of the people in Malaysia. While the purchasing power of the real income of the people in Malaysia is almost twice the real income of people in Indonesia.
5. Conclusion and Recommendation During the period of April 1998 - January 2015 the exchange rate of IDR against the US $ continued tend to weaken. Based on Big Mac Index during the period of April 1998 - January 2015 the exchange rate of IDR Rupiah tends to be undervalued against the US $. The undervaluation of exchange rate of IDR to US $ was caused by not yet the inclusion of component of nontradables into the calculation of index. Big Mac Affordability index indicates that there is a great income disparity between Singapore and five other ASEAN countries. It can be showed by the purchasing power of the real income of the people in Singapore is almost eleven times
the real incomes of people in the Philippines and Vietnam, nearly five times the real incomes of the people in Thailand and Indonesia, and twicw the real incomes of the people in Malaysia. While the purchasing power of the real income of the people in Malaysia is almost twice the real incomes of people in Indonesia.
To get the better Big Mac index is advised to use the relative PPP approach, for example by including the inflation factor. The nontradables factor should be included in the calculation of Big Mac index factors to minimize the percentage of undervaluation of exchange rate. Recommendations for future research are to extend the use of Big Mac index to other fields and to make adjustments by inserting other economic factors.
6. References
Alfheim, Espen. 2015. How does the Big Mac Index Perform as an Investment Strategy for Constructing Currency Portfolios?, Master Thesis, Department of Economics and Business Administration, Aarhus University, Denmark. URL : http://pure. au.dk/portal-asb-student/files/86465619/ Master_thesis.pdf.
Agustin, G. 2009. Analisis Paritas Daya Beli Pada Kurs Rupiah terhadap Dolar Amerika Serikat Periode September 1997 – Desember 2007 dengan Menggunakan Metode Error Correction Model (Analysis of Purchasing Power Parity on Rupiah Exchange Rate Against US Dollar in Period of September 1997 – December 2007 By Using ECM Method), JESP 1 (1): 28 – 38.
Atal, V. 2014. The Big Mac Index And Real-Income Disparity, Journal of Business & Economics Research – Third Quarter 2014, 12 (3) : 231 – 236. URL : http://www. cluteinstitute.com/ojs/index.php/JBER/ article/viewFile/8726/8706
www.ufrgs.br/ppge/pcientifica/2004_07.pdf.
Chen, Chien-Fu, Chung-Hua Shen, and Chien-an Andy Wang, (2007) “Does PPP hold for Big Mac price or consumer price index? Evidence from panel cointegration.” Economics Bulletin,Vol. 6, No. 16 pp. 1-15. URL : http:// accessecon.com/pubs/EB/2007/Volume6/EB-07F30007A.pdf
Cheung, Y. W. 2009. Purchasing Power Parity. In Reinert, Kenneth A.; Rajan, Ramkishen S.; Glass, Amy Jocelyn; et al. The Princeton Encyclopedia of the World Economy I. Princeton: Princeton University Press.
Clements, K. W., Lan, Y., and Seah, S. P. 2014. The Big Mac Index Two Decades on an Evaluation of Burgernomics, Business School, The University of Western Australia. URL : http://www.web.uwa.edu.au/data/ assets/pdf_file/0003/1082586/10-14_
Daley, J. 2008.Burgernomics: Why the price of a Big Mac may hold the key to better investment returns, The Independent. URL : http://web. archive.org/web/20090124141541/ http:// www.independent.co.uk/money/invest-save/. Levanoni, D. and Darnell, M. 1999. Purchasing Power Parity: Even The Big Mac Can Predict FX Rates. FQ Perspective, October 1999 : 1 – 9 .URL : https://www.firstquadrant. com/system/files/9910_Purchasing_Power_ Parity_0.pdf
MacDonald, R. 2007. Exchange rate economics: Theories and evidence. Textbook, Routledge-Taylor & Francis Group. URL : https://www. routledge.com/Exchange-Rate-Economics-T h e o r i e s - a n d - E v i d e n c e - 2 n d - E d i t i o n / MacDonald/p/book/9780415125512.
Gie, K. K. 2009. Nilai Tukar Rupiah dan Sebuah “Big Mac”. URL : www. perpustakaan. bappenas.go.id/lontar/file?file=digital/ blob/F2346/.
Hoefert, A., and Hofer, S. 2006. Prices and Earnings: A Comparison of Purchasing
Power around the Globe.UBS AG, Wealth Management Research. URL : http://www. ubs.com/1/ShowMedia/ubs_ch/wealth_ mgmt_ch?contentId=103982&name=eng. pdf.
Hsu, T. 2012.Big Mac $6.81 in Switzerland, $1.62 in India, Economist says”, Los Angeles Times. URL : http://articles.latimes. com/2012/jan/18/business/la-fi-mo-big-mac-index-20120118.
He, J. 2013.A Research on RMB Exchange Rate Based on Big Mac Index Empirical Analysis. Journal of Computer Modelling & New Technologies, 17(5C) : 83 - 86.
IMF World Economic Outlook (WEO). 2016. URL : www.imf.org/external/pubs/ft/weo/2016/ update/01
Kuncoro, M. 2015. Indikator Ekonomi (Economics Indicators), Edisi Pertama, Yogyakarta : BPFE.
Lee, D.Y.2009. Big Mac and Purchasing Power Parity, URL : http://myphlip. p e a r s o n c m g . c o m / f a c u l t y / m p v i e w i e . cfm?vieid=1232&vbcid=1444
Madura, J. 2006. International Corporate Finance. Book 1. Jakarta : Salemba Empat.
Marpaung, M. 2011. Analisis Paritas Daya Beli (PPP) Kurs Rupiah Indonesia Terhadap Dollar Amerika Serikat, Tesis, Sekolah Pascasarjana, Universitas Sumatera Utara, Medan.
McConnell, C., and Brue, S. 2004. Microeconomics, 16th Ed.New York : McGraw Hill.
O’Brien, Thomas J. and Ruiz de Vargas. 2016. Big Mac Index and Effective Exchange Rates: The US Dollar, The Euro, and The Yuan,
EFMA%20ANNUAL%20MEETINGS/2016-Switzerland/papers/EFMA2016_0031_ fullpaper.pdf
Olivon, B. 2013. Big Mac Index Shows That The Real Continues To Be Over-valued. URL :http://exame.abril.com.br/english/brazil- now/big-mac-index-shows-that-the-real-continues-to-be-over-valued.shtml.
Ong, L. L. 2003. The Big Mac Index Applications of Purchasing Power Parity. New York : Palgrave Macmillan. URL : www. palgraveconnect.com
Pakko, M. R., and Pollar, P. S. 1996. For Here or To Go? Purchasing Power Parity and the Big Mac., Federal Reserve Bank of St. Louis. Review, January/February 1996.
Pakko, M. R., and Pollar, P. S. 2003. Burgernomics: A Big Mac Guide to Purchasing Power Parity. The Federal Reserve Bank of St. Louis. URL :https://research.stlouisfed.org/publications/ review/03/11/pakko.pdf
Peter.2013. Is the Big Mac Index flawed? URL : http://macroeconomicanalysis.com/is-the-big-mac-index-flawed/.
Portes, L. S.V., Atal, V., 2014. The Big Mac Index: A Shortcut To Inflation And Exchange Rate
Dynamics? Price Tracking And Predictive Properties, International Business & Economics Research Journal – July/August 2014 Volume 13, Number 4.
Rooney, B. 2015. $7.54 for a Big Mac? Only in Switzerland.CNN Money (New York). URL : http://money.cnn.com/2015/01/22/news/big-mac-index/
Simorangkir, Iskandar., and Suseno. 2004. Sistem dan Kebijakan Nilai Tukar, Seri Kebanksentralan No. 12, Pusat Pendidikan dan Studi Kebanksentralan (PPSK) Bank Indonesia. URL : www.bi.go.id/id/publikasi/ seri-kebanksentralan/Documents/12.
Taylor, A & Taylor, M. (2004). The Purchasing Power Parity debate. NBER Working paper no. 10607, June 2004. URL : http://www. nber.org/papers/w10607.pdf
The Economist. 2015. The Big Mac Index : Historical Data from the Economist’s Big Mac Index. URL : http://bigmacindex.org/ Wikipedia.2016. Indeks Big Mac. URL : https://
id.wikipedia.org/wiki/Indeks_Big_Mac). Jurnal Ekonomi Pembangunan, 17 (2), December 2016, 210-231
7. Appendix
Appendix 2. Index of VOC (%), Big Mac Price (US $) January 2014 Jurnal Ekonomi Pembangunan, 17 (2), December 2016, 210-231