THE JOURNAL OF TROPICAL LIFE SCIENCE OPEN ACCESS Freely available online
VOL. 7, NO. 1, pp. 48 – 52, January 2017 Submitted May 2016; Revised June 2016; Accepted January 2017
Anthropometry, Fatty Liver, Plasma Lipid, and Adipose Tissue on Rat Wistar
Induced Low-Protein Diet
Dian Handayani*, Inggita Kusumastuty, Kanthi Permaningtyas Tritisari, Laily Ekawati Candra, Glaveria Galuh Giriananda, Lailatul Muniro, Lega Satya Puspitasari, Ratih Indah, Anis Mahmudah
Department of Health and Nutrition, Faculty of Medicine, Brawijaya University, Malang, Indonesia
ABSTRACT
Protein energy malnutrition problem still exists in developing country. In fact, Indonesia has faced it as double burden of nutrition problems. This study aims to develop a standardized diet for developing protein energy malnutrition (PEM) on the rat to support nu -trition research. Low-protein modified AIM-93M diet (LP) has been given to rats for 12 weeks intervention compared to normal pro-tein diet (ND). Anthropometry, plasma lipid, fatty liver and the weight of adipose tissue have been analysed. The LP group showed a significantly lower body weight, body length and waist circumference (p < 0.05), a more fatty liver marker shown in LP compared to ND (p < 0.05). This study suggests that giving low protein modified AIN-M93 diet promotes protein energy malnutrition in the rat.
Keywords: Protein nergy malnutrition (PEM), low protein diet, anthropometry, fatty liver
Energy protein deficiency is a fundamental nutri-tion problem in developing country including Indone-sia. Some studies in the clinical setting have been con-ducted to identify the problem of energy protein defi-ciency [1, 2, 3, 4]. Nowadays, the functional food re-search for combating PEM is demanding. However, there are some limitations of clinical studies for prov-ing the effect of functional food combatprov-ing PEM. Sev-eral ethical and pragmatic constraints associated with using human subjects, while animal experiments are reproducible and robust. Therefore using the animal model as research sample for nutrition intervention is the main concern. For this purpose, the animal model needs a standardized diet to minimize variation during an experiment that resulted from the diet in an animal model [5]. Standardized diet for an animal model, es-pecially rat, is AIN-93M [5] using for the maintenance of growth of rat as an animal model. However, others researcher also use other standard diets such as PARS for maintaining animal model growth.
This project aims to develop low energy protein diet standard that is modified from AIN-93M. Thus this study will examine the effects of low protein diet
on the anthropometry, fatty liver, plasma lipid, and adipose tissue. As an effect of PEM is lowering anthro-pometry size, developing fatty liver, changing in plasma lipid level and the loss the adipose tissue fat mass in body weight.
Animals and housing condition
The Ethical committee for Conduction of Animal Studies at Faculty of Medicine, University of Brawijaya (UB) approved the experimental protocol (No. 416/EC/KEPK/07/2014). The animals in these experi-mental protocols were individually housed in cages.
Animals and diet
Thirty-two male Wistar rats, weighing 177-259 g at ± 3 months. All rats were fed in the Brawijaya Univer-sity laboratory non-purified diet (PARS) during the ac-climatization period. Then, thirty-two rats were divided into two groups (n = 16). The first group was continu-ously given PARS (Wonokoyo, Indonesia) as normal diet (ND) and the second group was given low-protein modified AIN-93M modified (LP). The dietary inter-vention was carried out addlibitum for twelve weeks.
JTLS | J. Trop. Life. Science 48 Volume 7 | Number 1 | January| 2017
MATERIALS AND METHODS INTRODUCTION
*Corresponding author: Dian Handayani
Department of Health and Nutrition, Faculty of Medicine, Brawijaya University
Jalan Veteran, Malang, Indonesia 65162 E-mail: [email protected]
How to cite:
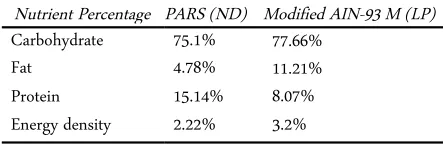
Table 1. Percentage of nutrient in PARS (ND) and AIN-93M diet (LP)
Nutrient Percentage PARS (ND) Modified AIN-93 M (LP) Carbohydrate 75.1% 77.66%
Nutrients composition of both diets are illustrated by Table 1.
Food intake
Food intake was measured every 24 hours by weighing the amount of total food (g) provided to the rats and subtracting the remaining food (g) in the cage after 24 hours.
Anthropometric, plasma lipid, white adipose tissue, and fatty liver analysis
Following the intervention period, Rat was anes-thetized and killed by ketamine and xylazine 0.005 mL/g body weight via intramuscular rats. The anthro-pometric measurement including body weight was weighed weekly throughout the twelve-week interven-tion period. Others anthropometric measurement are abdominal circumference (AC), thoracic circumference (TC), body length (nose to-anus or anus-to-nose length) were made in anesthetized rat
The white adipose tissue (WAT) comprised visceral fat (epididymal, perirenal, and omental fat) and subcu-taneous fat (inguinal fat) were then dissected out and weighed. Plasma samples were obtained by puncturing the right ventricle of heart after euthanasia and were collected in ethylenediaminetetraacetic acid- (EDTA-) coated tubes and centrifuged at 3000× rpm at 22°C for 25 minutes [6]. The whole liver was quickly removed, placed in formalin, and then stored at −20°C until it was analyzed. We examined the liver lipid accumula-tion using Hematoxylin-Eosin (HE)-stained as modi-fied from previous protocol described previously [7, 8]
Food intake, body weight, AC, TC and body length PARS (ND) was given to the rats as a control group (normal diet), and Low protein modified AIN-M93 diet had been given to rat with ad libitum or as desired. In adaptation phase, every rat had been given PARS diet, but slowly rat in LP was given low-protein modified AIN-93 M diet aiming to adjust the rat with treatment during research. After adaptation phase (2
Table 2. Anthropometry and nutrient intake
Treatment group ND LP p-value
Baseline body weight (g) 204.03 ± 16.65 210.18 ± 19.95 0.35 Final body weight (g) 362.71 ± 41.35 149.50 ± 18.17 0.00 Body weight gain (g) 165.31 ± 40.75 -60.69 ± 15.74 0.00 Body length (cm) 25.44 ± 0.78 21.31 ± 1.11 0.00
Note: Amount (n) = 16 samples, ND = PARS Normal Diet, LP = Low Protein modified AIN-93M Diet; TC (thoracic circumference); AC (abdominal circumference)
weeks), PARS normal diet was still given to ND rat, but LP was given low protein modified AIN-93M.
Table 2 showed that rat in PARS normal diet group (ND) encounters a weight gain (165.31 ± 40.75). Meanwhile, a rat in AIN-93 M normal diet standard encounters a weight loss (-60.69 ± 15.74). Similar result is shown in body length, AC, and TC; LP group was significantly lower than ND group, p = 0.00 (α = 0.05).
Rat intake was measured by reducing the given food amount with food leftover that was weighed every day. Then, rat intake was converted into energy value, carbohydrate, protein, and fat for each diet. Intake av-erage, energy total, carbohydrate, protein, and fat can be seen in Table 2.
The food intake in ND group (41.26 ± 5.51) g is higher than intake average in LP (11.34 ± 1.57) g with p-value 0.00 (α = 0.05). Thus, energy average in ND
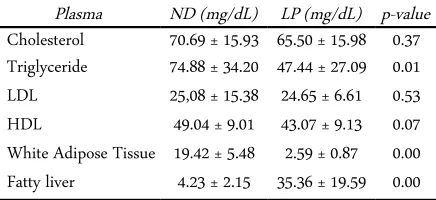
Table 3. Plasma lipid and body fat mass
Plasma ND (mg/dL) LP (mg/dL) p-value Cholesterol 70.69 ± 15.93 65.50 ± 15.98 0.37 Triglyceride 74.88 ± 34.20 47.44 ± 27.09 0.01 LDL 25,08 ± 15.38 24.65 ± 6.61 0.53 HDL 49.04 ± 9.01 43.07 ± 9.13 0.07 White Adipose Tissue 19.42 ± 5.48 2.59 ± 0.87 0.00 Fatty liver 4.23 ± 2.15 35.36 ± 19.59 0.00
(α = 0.05). It has been reported that high-fat-diet-induced satiety effect longer than normal fat content diet. Thus it decreases food intake.
Carbohydrate intake in ND contributes 75.11% of total energy. Meanwhile, carbohydrate intake in LP contributes 77.66% of total energy. There is a signific-ant difference in carbohydrate intake with p-value 0.00 (α = 0.05). It also becomes a reason that consumption in LP is lesser than ND. The higher carbohydrate con-tent in diet can make rat feel full faster, so food intake in LP is lower than ND. A high glucose can stimulate satiety center that is located in the ventromedial nuc-leus of the hypothalamus and otherwise, a lower gluc-ose, can stimulate neuron in feeding center that is loc-ated in the lateral nucleus of the hypothalamus. Stimu-lation in feeding center increases hunger. Satiety center affects the incidence of satiety after eating. This feeling of satiety due to the increase in blood glucose after we eat causes the increasing glucose that passes through satiety center and activates it [10].
Protein intake in ND contributes 15.13% of total energy. Meanwhile, protein intake in LP contributes 8.07% of total energy. There is a significant difference in protein intake with p-value 0.00 (α = 0.05). The recommendation of protein content on rat feed is 14.1%. It is to fulfill rat protein requirement for maintenance their health [5]. LP group contains 8.07% protein, and the other hand ND provides 15% protein from total energy. The difference of protein content affects on total daily food intake of the rat. ND group consumed more food than LP group. This shows that mice did not well accept LP diet.
Malta et al. and de Oliveira et al. [11, 12]reported that low protein diet (4% total energy) on rat decreased food intake compared to normal protein diet on a rat. The Impact of decreased intake in that research is similar to this research. In this research, the total protein is 8% from total energy, which still contains too low protein in rat food. Both studies showed the decreasing food intake affects weight gain during the administration of low protein diet. Study
from Malta et al. and de Oliveira et al. revealed, 30 days low protein diet on rat induces hyperleptinemia thus decreases food appetite on rat [11, 12].
Plasma lipidandbody fat mass
Rat plasma cholesterol, triglyceride, Low-Density Lipoprotein (LDL), High-Density Lipoprotein (HDL), and white adipose tissue (WAT)were analysed after 12 weeks treatment. Table 3 shows the result of those variables (plasma lipid, body fat mass, and foam cell).
Table 3 shows mean ± standard deviation for each variable. There is no significance different in choles-terol total, LDL, and HDL with a p-value in sequence 0.37, 0.53, and 0.07. For triglyceride there is a signific-ance different between ND (74.86 ± 34.20) and LP (47.44 ± 27.10) with p-value 0.01 (α = 0.05). This dif-ference caused by different intake in each group. Whereas, intake in ND diet is higher than low-protein modified AIN-93M.
PARS diet is made from comfeed PARS whose con-tains Distillers Dried Grains with Soluble (DDGS)and feed addictive that stimulate growth process in chicken so if it is given to animal model it can stimulate their appetite [13]. In this research, a higher intake possibly was caused by comfeed content, and it can cause trigly-ceride serum in an animal model.
WAT total amount was measured by weighing some part in rat such as perinatal, omental, epi-didymal, and inguinal. Table 4 shows that WAT in ND (19.42 ± 5.48 g)is higher than LP (2.60± 0.87 g)with p-value 0.00. It means that there is a significant differ-ence in WAT between ND and LP (α = 0.05).
Meanwhile, in ND group there was an excessive energy, so it was used to increase adipose tissue mass. Moreover, a fat source in LP comes from soy fat with high polyunsaturated fatty acids (PUFA). PUFA in diet can obstruct lipogenesis in the liver. Meanwhile, in ND one of the fat sources is Distiller’s Dried Grains with Soluble (DDGS) which have high saturated fatty acid.
In this research, food intake in ND is higher than LP. It was the reason why a total of WAT from four places (perirenal, omental, epididymal, and inguinal) in ND is greater than LP. The lower intake in LP causes fat that has been usedas energy source, meanwhile in ND, there is an excessive energy that used to increase e adipose tissue mass. This statement supported by Fan-tuzzi and Mazzone (2007), stating that the higher rat intake, the amount of excess energy will be higher, so it will bedepositedin TAG form in adipose tissuethat contributes in WAT enlargement. However, in energy deficiency TAG in adipose tissue will be broken down
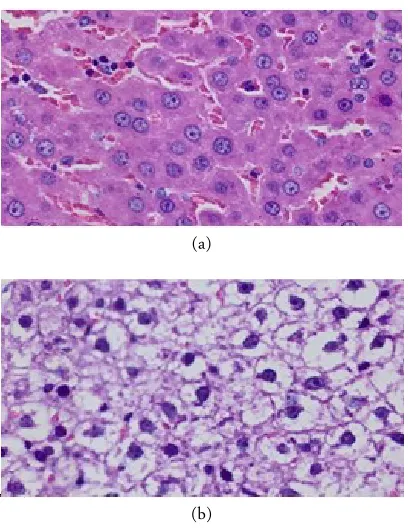
(a)
(b)
Figure 1. The effect of the different protein composition diet on lipid droplet deposition of hepatic tissue by HE stain-ing, observed by microscope Olympus photo slide BX51 with 400× magnification.
into fatty acid that will be usedas energy sourceby an-other organ [14]. It can be concluded that adipose cell enlargement results from imbalanced lipogenesis and lipolysis [15].
Fatty liver
ND and LP rat’s liver cell can be seen in Figure 1 and there is different in hepatic tissue ND (A) and LP (B). In picture A there are a lot of normal cell. Mean-while, in picture B liver cell has experienced intracyto-plasmic swelling that pressing nucleus position, caus-ing nucleus position in peripheral. As we seen in Table 3, the amount of fatty liver cell in LP is higher than ND with p-value 0.00 (α = 0.05).
Lower food intake and protein intake in the rat have an effect on weight loss. It makes rat in kwashi-orkor condition lead to fatty liver in rats. Rats in kwashiorkor condition will increase fatty acid serum level and low Very Low-Density Lipoprotein (VLDL) level [16]. The low VLDL levelwas resulted from low intake amino acid, so it makes Apoprotein B-100 and Apoprotein C synthesis decrease. The low VLDL causes the transport failure of triglyceride from the liver to tissue. This causes an excessive accumulation of fat in the liver, well known as fatty liver [17].
In conclusion, It has been shown that low-protein administration modified from AIN-93M standard diet develops protein energy malnutrition that mimics developing human PEM reflected from the changes of anthropometry parameters, fatty liver, plasma lipid and adipose tissue.
All student from nutrition department, medicine faculty, University of Brawijaya that part of this research group. This research was supported by Medicine Faculty research funding 2015.
1. Fouque D, Kalantar-Zadeh K, Kopple J et al (2008) A pro-posed nomenclature and diagnostic. Kidney International 73 (4): 391-398. doi: 10.1038/sj.ki.5002585.
2. Gurung G (2010) Social determinants of protein-energy malnutrition: need to attack the causes of the causes. Jour-nal of Health, Population, and Nutrition 28 (3): 308-309. 3. Purwestri RC, Scherbaum S, Inayati DA et al (2013)
Im-pact of daily versus weekly supply of locally produced ready-to-use food on growth of moderately wasted chil-dren on Nias island, Indonesia. ISRN Nutrition 2013 (2013): 1–10. doi: 10.5402/2013/412145.
4. Burchi F, Fanzo F, Frison E (2011) The role of food and nutrition system approaches in tackling hidden hunger. International Journal of Environmental Research and Pub-lic Health 8 (2): 358-373. doi: 10.3390/ijerph8020358. 5. Reeves PG (1993) AIN-93 purified diets for laboratory
ro-dents: final report of the American institute of nutrition ad hoc writing committee on the reformulation of the AIN-76A rodent diet. The Journal of Nutrition 123 (11): 1939-1951.
6. Riesanti D, Masiana C, Herawati (2012) Kadar HDL, kadar LDL dan gambaran histopatologi aorta pada hewan model tikus (Rattus novergicus) hiperkolsterolemia den-gan terapi ekstrak air benalu mangga (Dendrophthoe pen-tandra). Undergraduate Final Assignment. Brawijaya Uni-versity, Veterinary Department.
7. Kudo T, Tamagawa T, Kawashima M et al. (2007) Attenu-ating effect of clock mutation on tryglyceride contents in the ICR mouse liver under a high high-fat diet. Journal of Biological Rhythms 22: 312-323. doi: 10.1177/0748730407302625.
8. Perhimpunan Dokter Spesialis Patologi Indonesia(2008) Pedoman Penanganan Bahan Pemeriksaan untuk His-tologi. Jakarta, PT Roche Indonesia.
9. Rolls B (2000) The role of energy density in the over-con-sumption of fat. American Society for Nutritional Sciences ACKNOWLEDGMENT
130 (2S Suppl): 268S-271S.
10. Muhammad I (2011) Manajemen Pemeliharaan Ayam Pe-telur di CV. Sari Makmur Farm Kabupaten Sukoharjo. Surakarta, Universitas Sebelas Maret.
11. Malta A, de Oliveira JC, Ribeiro TA et al. (2014) Low-pro-tein diet in adult male rats has long-term effects on me-tabolism. Journal of Endocrinology 221: 285-295. doi: 10.1530/JOE-13-0473.
12. de Oliveira JC, Lisboa PC, de Moura EG et al. (2013) Poor pubertal protein nutrition disturbs glucose-induced insulin secretion process in pancreatic islets and programs rats in adulthood to increase fat accumulation. Journal of Endocrinology 216 (2): 195-206. doi: 10.1530/JOE-12-0408 13. Tangendjaja B (2008) Distiller`s Dried Grains With Sol-ubles (DDGS) untuk pakan. Wartazoa: Buletin Ilmu
Pe-ternakan Indonesia 18: 137–148.
14. Ahmadian M, Duncan RE, Sul SH (2008) Triacylglycerol metabolism in adipose tissue. Future Lipidol 2 (2): 229– 237. doi:10.2217/17460875.2.2.229.
15. MacKay H, Khazall R, Patterson ZR et al. (2013) Rats perinatally exposed to food restriction and high-fat diet show differences in adipose tissue gene expression under chronic caloric restriction. Adipocyte 2 (4): 237–245. doi: 10.4161/adip.24752.
16. Leon (1993) Disease of the liver volume 7. Philadelphia, B Lippincott Company.
17. Kneeman JM, Misdraji J, Corey KE (2012) Secondary causes of nonalcoholic fatty liver disease. Therapeutic Ad-vances in Gastroenterology 5 (3): 199–207. doi: 10.1177/1756283X11430859.