35 CHAPTER IV
FINDING OF THE RESEARCH
In this chapter, the writer presents and describes about the research finding of the data. Basically, the objective of the research is to find out whether there is a significant difference between the English vocabulary mastery of the Eighth grade students of MTs NU Raudlatus Shibyan, Peganjaran. Kudus in academic year 2015/2016 taught by using Concept Sort Strategy (CSS).
4.1 Research Finding
The data taken from pre-test and post-test of English vocabulary mastery of the Eighth Grade students of MTs NU Raudlatus Shibyan, Peganjaran, Kudus in academic year 2015/2016 before and after being taught by using Concept Sort Strategy (CSS) are analyzed further by applying the five steps model for hypothesis testing. Through testing the hypothesis by using five steps model, the hypothesis will be tested statistically.
4.1.1 The English Vocabulary Mastery of the Eighth Grade Students of MTs NU Raudlatus Shibyan, Peganjaran, Kudus in Academic Year 2015/2016 before being Taught by Using Concept Sort Strategy (CSS)
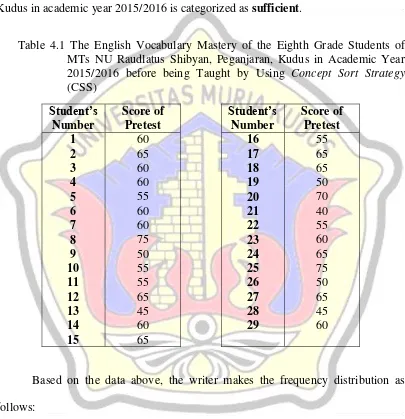
score of pre-test which can be seen in table 4.1 that the minimum score is 40, the maximum score is 75 and the mean of pretest is 60 from the total number of students 29. Besides, the standard deviation is 8.7. It indicates that the English vocabulary mastery of the eighth grade students of MTs NU Raudlatus Shibyan, Peganjaran, Kudus in academic year 2015/2016 is categorized as sufficient.
Table 4.1 The English Vocabulary Mastery of the Eighth Grade Students of MTs NU Raudlatus Shibyan, Peganjaran, Kudus in Academic Year 2015/2016 before being Taught by Using Concept Sort Strategy
0
70-75 64-69 58-63 52-57 46-51 40-45
Frequency (F)
Frequency (F)
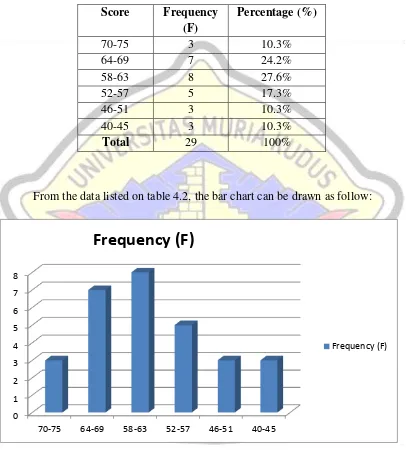
Table 4.2 The Frequency Distribution of the English Vocabulary Mastery of the Eighth Grade Students of MTs NU Raudlatus Shibyan, Peganjaran, Kudus in Academic Year 2015/2016 before being Taught by Using
Concept Sort Strategy (CSS)
Score Frequency
From the data listed on table 4.2, the bar chart can be drawn as follow:
4.1.2 The English Vocabulary Mastery of the Eighth Grade Students of MTs NU Raudlatus Shibyan, Peganjaran, Kudus in Academic Year 2015/2016 after being Taught by Using Concept Sort Strategy (CSS)
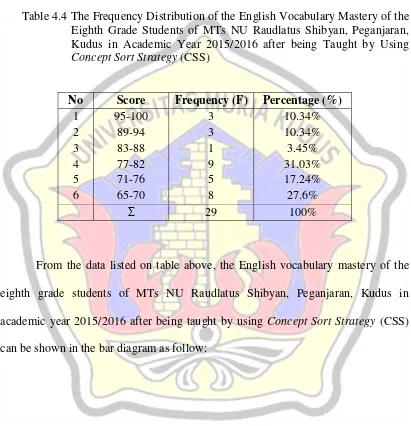
After giving treatment for 4 meetings to the eighth grade students of MTs NU Raudlatus Shibyan, Peganjaran, Kudus in academic year 2015/2016, the writer gave post-test to them to find out the English vocabulary mastery of the eighth grade students of MTs NU Raudlatus Shibyan, Peganjaran, Kudus in academic year 2015/2016 after being taught by using Concept Sort Strategy (CSS). The writer found the minimum score of post test is 65, the maximum score is 100, and the mean score is 78.2, meanwhile the standard deviation is 6. 072. It means that the English vocabulary mastery of of the eighth grade students of MTs NU Raudlatus Shibyan, Peganjaran, Kudus in academic year 2015/2016 after being taught by using Concept Sort Strategy (CSS) is categorized as good. The data of the post-test score of the students can be seen in table 4.3.
Continuation
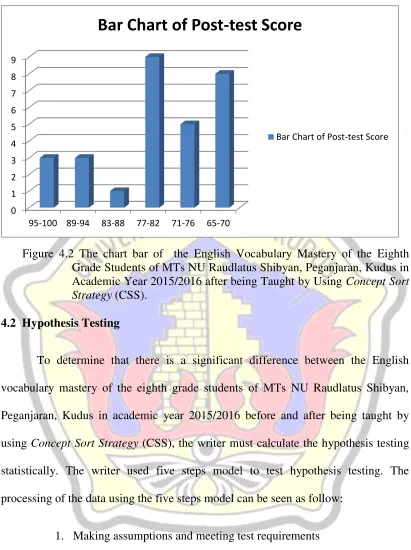
Table 4.4 The Frequency Distribution of the English Vocabulary Mastery of the Eighth Grade Students of MTs NU Raudlatus Shibyan, Peganjaran, Kudus in Academic Year 2015/2016 after being Taught by Using
Concept Sort Strategy (CSS)
0
95-100 89-94 83-88 77-82 71-76 65-70
Bar Chart of Post-test Score
Bar Chart of Post-test Score
Figure 4.2 The chart bar of the English Vocabulary Mastery of the Eighth Grade Students of MTs NU Raudlatus Shibyan, Peganjaran, Kudus in Academic Year 2015/2016 after being Taught by Using Concept Sort Strategy (CSS).
4.2 Hypothesis Testing
To determine that there is a significant difference between the English vocabulary mastery of the eighth grade students of MTs NU Raudlatus Shibyan, Peganjaran, Kudus in academic year 2015/2016 before and after being taught by using Concept Sort Strategy (CSS), the writer must calculate the hypothesis testing statistically. The writer used five steps model to test hypothesis testing. The processing of the data using the five steps model can be seen as follow:
1. Making assumptions and meeting test requirements Model : Cluster random sampling
2. Stating the null hypothesis.
H0 = µ1 = µ2
(H1= µ1≠ µ2) Notes :
Ho : Null hypothesis (there is no significant difference between the English vocabulary mastery of the eighth grade students of MTs Nu Raudlatus Shibyan, Peganjaran, Kudus in academic year 2015/2016 before and after being taught by using Concept Sort Strategy).
H1 : Alternative hypothesis (there is a significant difference between the English vocabulary mastery of the eighth grade students of MTs Nu Raudlatus Shibyan, Peganjaran, Kudus in academic year 2015/2016 before and after being taught by using Concept Sort Strategy).
3. Selecting the sampling distribution and establishing the critical region.
Sampling distribution = t distribution
α = .05, two tailed test
4. Computing the test statistic.
5. Making a decision and interpreting the result of the t-test.
2015/2016 before and after being taught by using Concept Sort Strategy (CSS). The figure can be seen as follow:
Figure 4.3 The Sampling Distribution with Critical Region and Test Statistic Display The writer rejected H0 (null hypothesis) and accepted Ha (alternative hypothesis) because t0 falls into critical region. From the calculation and figure above, the writer can make summary as follow:
Table 4.5 The Summary of t-test Result of the Eighth Grade Students of MTs NU Raudlatus Shibyan, Peganjaran, Kudus in Academic Year 2015/2016
Test N Mean SD Df T-table
T-observation Pre-test score
29
60 8,7
28 2.048 Post-test score 78,2 6. 072