43
A. The students’ ability in using relative pronouns in sentence.
Based on the test given to the sample was carried out on 11 July, 2012 at MA
Darul Ulum Palangka Raya, which was undertaken in allocated time of 90
minutes, the writer found that the students got variation score after they had done
the test which the writer given.
As stated in chapter III, the number of the students taken as the subject of the
study were 67 (sixty seven) students. The result of the students’ in using
appropriate relative pronouns in sentence can be seen in table below.
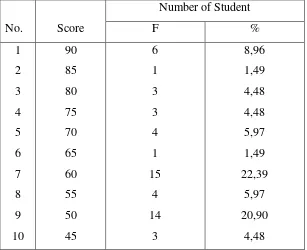
TABLE 4.1
The Distribution of Frequency and Percentage of Students’ Ability in Using Relative Pronouns in Sentence
No. Score
Number of Student
11
12
13
14
40
35
30
20
7
3
2
1
10,45
4,48
2,99
1,49
67 ∑=100
As what it has described from the table above, there were 10 students
or 14,93% of the total sum who got the score between 80-100 were classified
as excellent ability, 7 students or 10,45% of the total sum who got the score
between 70-79 were classified as good ability, 16 students or 23,88 % of the
total sum who got the score between 60-69 were classified as fair ability, 18
students or 26,87% of the total sum who got the score between 50-59 were
classified as poor ability, 16 students or 23,88 % of the total sum who got the
score between 0-49 were classified as very poor ability.
Figure 4.1 The Percentage of Students’ ability in Using
Relative Pronouns in Sentence 14,93%
26,87%
23,88% 23,88%
10,45%
Excellent ability
Poor ability
Fair ability
Very poor ability
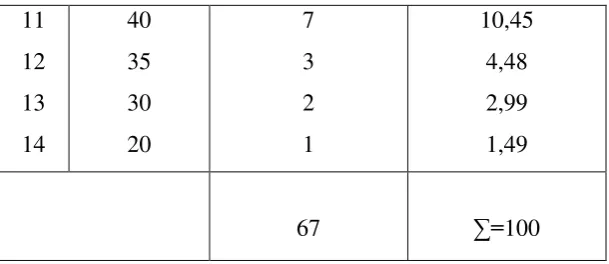
Then the writter presented the score that have been tabulated before.It was
important to know the value of mean score.
Table 4.2
The Frequency Distribution of The Total Scores on The Students Ability in Using Relative Pronouns in Sentences
Scores (x) Frequency (f) Fx
57,54 was classified as poor ability. As a consequency, the tenth grade students
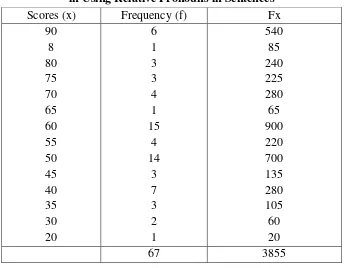
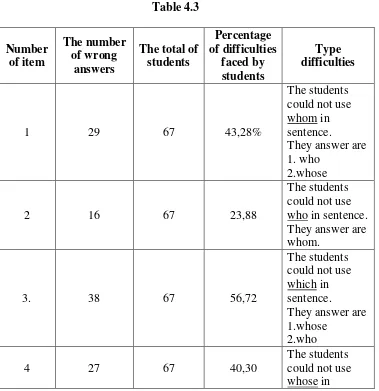
B. The students’ problem in using relative pronouns
In this part was presented description of the students’ problem relative
pronouns in sentence. These were to answer the problem of the study. These were
presented in the form of tables and explained based on the tables. Every item that
was presented could be known the type of difficulties made by students based on
the wrong answers made by them.
The students’ problem in using relative pronouns faced by the tenth grade
students of MA Darul Ulum Palangka Raya was presented in the form the table
as below: who in sentence. They answer are whom.
sentence.
They answer are 1.whom
2.which 3.who
5. 25 67 37,31
The students could not use whom in sentence.
Number who in sentence. They answer are 1.whom
They answer are whose. who in sentence. They answer are 1.whom
They answer are 1.whose
They answer are 1.who
Number
They answer are 1.who
They answer are 1.which
2.who
14. 8 67 11,94
The students could not use who in sentence. They answer are whom.
They answer are whose.
They answer are 1.who
They answer are 1.who
Number of item
The number of wrong
answers
The total of students
Percentage of difficulties
faced by styudents
Type difficulties
18. 26 67 38,80
The students could not use who in sentence. They answer are 1.whom
2.whose
19. 14 67 20,90
The students could not use which in sentence.
They answer are whose.
20. 42 67 62,69
The students could not use whom in sentence.
They are answer are
1.whose 2.who
The description of the students’ difficulties in using relative pronouns could
be explained as below:
1. There were 48 students or 71,64 % couldn’t answer item of number 16,
they could not use relative pronouns which function for person as object
that was whom.
2. There were 47 students or 70,15% could not answer item of number 12,
they could not use relative pronouns which function for possessive that
3. There were 42 students or 62,69 % could not answer item of number 20,
they could not use relative pronouns which function for person as object
that was whom.
4. There were 41 students or 61,19 % could not answer item of number 7,
they could not use relative pronouns which function for thing as subject
or object that was which.
5. There were 39 students or 58,21% could not answer item of number 8,
they could not use relative pronouns which function for possessive that
was whose.
6. There were 38 students or 56,72%could not answer item of number 3,
they could not use relative pronouns which function for thing as subject
or object that was which.
7. There were 36 students or 53,73% could not answer item of number 13,
they could not use relative pronouns which function for possessive that
was whose.
8. There were 36 students or 53,73% could not answer item of number 17,
they could not use relative pronouns which function for possessive that
was whose.
9. There were 29 students 43,28% could not answer item of number 1, they
could not use relative pronouns which function for person as object that
10. There were 27 students or 40,30% could not answer item of number 4,
they could not use relative pronouns which function for possessive that
was whose.
11. There were 26 students or 38,80% could not answer item of number 18,
they could not use relative pronouns which function for person as subject
that was who.
12. There were 25 students or 37,31 % could not answer item of number 5,
they could not use relative pronouns which function for person as object
that was whom.
13. There were 21 students or 31,34 % could not answer item of number 11,
they could not use relative pronouns which function for person as object
that was whom.
14. There were 20 students or 29,85 % could not answer item of number 9,
they could not use relative pronouns which function for person as subject
that was who.
15. There were 29 students or 28,36 %could not answer item of number 15,
they could not use relative pronoun swhich function for thing as subject
or object that was which.
16. There were 16 students or 23,88 %could not answer item of number 2,
they could not use relative pronouns which function for person as subject
17. There were 16 students or 23,88 %could not answer item of number 10,
they could not use relative pronouns which function for thing as subject
or object that was which.
18. There were 14 students or 20,90 %could not answer item of number 19,
they could not use relative pronouns which function for thing as subject
or object that was which.
19. There were 8 students or 11,94% could not answer item of number 4 ,
they could not use relative pronouns which function for person as subject
that was who.
20. There were 8 students or 11,94% could not answer item of number 16 ,
they could not use relative pronouns which function for person as subject
that was who.
From the result above, it can be explained that the result showed that the
student problem percentage in relative pronouns whose was 32.69%, in relative
pronouns whom was 29.15%, in relative pronouns which was 24.38%, and for
relative pronouns who was 13.78%.
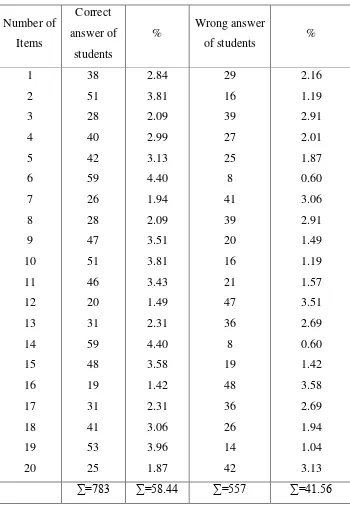
Based on the result of the test there were percentage of items in the form the
Table 4.4
The Percentage of Item in Using Relative Pronoun in Sentence
Number of
∑=783 ∑=58.44 ∑=557 ∑=41.56
Based on the table above, there were 38 students (2.84%) in item no 1 that
correct answers, 51 students (3.81%) in items no 2 that correct answers, there
(2.99%) in item no 4 that correct answers, there were 42 students (3.13%) in item
no 5 that correct answers, there were 59 students (4.40%) in item no 6 that correct
answers, there were 26 students (1.94%) in item no 7 that correct answers, there
were 28 students (2.09%) in item no 8 that coreect answers, there were 47
students (3.51%) in item no 9 that correct answers, there were 51 students (3.81%)
in item no 10 that correct answers, there were 46 students (3.43%) in item no 11
that correct answers, there were 20 students (1.49%) in item no 12 that correct
answers, there were 31 students (2.31%) in item no 13 that correct answers, there
were 59 students (4.40%) in item no 14 that correct answers, there were 48
students (3.58%) in item no 15 that correct answers, there were 19 students
(1.42%) in item no 16 that correct answers, there were 31 students (2.31%) in item
no 17 that correct answers, there were 41 students (3.06%) in item no 18 that
correct answers, there were 53 students (3.96%) in item no 19 that correct
answers, there were 25 students (1.87%) in item no 20 that correct answers.
Based on the table above, there were 29 students (2.16%) in item no 1 that
wrong answers, there were 16 students (1.19%) in item no 2 that wrong answers,
there were 39 students (2.91%) in item no 3 that wrong answers, there were 27
students (2.01%) in item no 4 that wrong answers, there were 25 students (1.87%)
that wrong answers, there were 8 students (0.60%) in item no 6 that wrong
answers, there were 41 ( 3.06%) in item no 7 that wrong answers, there were 39
students (2.91%) in item no 8 that wrong answers, there were 20 students (1.49%)
in item no 9 that wrong answers, there were 16 students (1.19%) in item no 10
answers, there were 47 students (3.51%) in item no 12 that wrong answers, there
were 36 students (2.69%) in item no 13 that wrong answers, there were 8 students
(0.60%) in item no 14 that wrong answers, there were 19 students (1.42%) in item
no 15 that wrong answers, there were 48 students (3.58%) in item no 16 that
wrong answers, there were 36 students (2.69%) in item no 17 that wrong answers,
there were 26 students (1.94%) in item no 18 that wrong answers, there were 14
students (1.04%) in item no 19 that wrong answers, there were 42 students
(3.13%) in item no 20 that wrong answers.
From the result above, it can be explained that the result showed that low
score was 58.44% of correct answers. The result showed that low score was