IMPACT OF REGION FINANCIAL INFORMATION
SYSTEM (SIKD) QUALITY, ROLE AMBIGUITY
AND TRAINING ON PRECISION OF FINANCIAL
STATEMENT OF LOCAL GOVERNMENT
PRESENTATION IN NORTH SUMATRA
Iskandar Muda
1and Abykusno Dharsuky
2Abstract: This study aims at identifying the quality of Region Financial Information System (SIKD) management result, Role Ambiguity, and Training on Precision of Financial Statement of Local Government Presentation in North Sumatera. Moreover, this
study aims at identifying the effectiveness of Region Financial Information System (SIKD)
management in North Sumatera.
The findings of this study are expected to be able to give suggestions and recommendation of improvement on SIKD managers in North Sumatera so that they can support good
government system. By identifying the management of SIKD, then at least it can obtain
unqualified opinion. The result of this study concludes that Quality significantly influences
at level of 5% on Precision of Financial Statement of Local Government Presentation. Role
Ambiguity significantly influences Precision of Financial Statement of Local Government Presentation and training significantly influences Precision of Financial Statement of
Local Government Presentation.
Keyword: Region Financial Information System (SIKD), Role Ambiguity, Training and Precision of Financial Statement of Local Government Presentation.
INTRODUCTION
In the period of New Order, Region Financial Information System (SIKD) throughout Indonesia was regulated in Law No. 5 of 1974, equipped with Governmental Regulation number 6 of 1975. According to this regulation, central government published Decree of Minister of Home Affairs No. 900-099 about Region Financial Administration Manual (MAKUDA) in 1981 which is now called as Region Financial Information System (SIKD). MAKUDA was eventually used as guidelines or manual serving as SIKD which must have been executed equally for all regions in Indonesia. Implementation of region financial information
system is expected to be able to satisfy the demand given by society concerning transporation and accountability from public sector institutions (Mardiasmo, 2002). A significant obstacle to achieve success of a new system implementation is lack of attention on behavior factor during the implementation. A study conducted by Grafton and Widener (2010) had examined the role of measurement and evaluation of organization performance. Grafton and Widener (2010) investigated and verified the process of relevan strategic decision in relation to performance and its impact on an organization thoroughly. The implementation of this new system is mediated by two behavior factors which are employees’ adaptation and their involvement to design a new system. The adaptation ability of employees will help the acceptance of a new system implementation, the employees’ ability to adapt will make them maximally attempt to adapt to the change occurred in their work place, so that the implementation process of the system can be accepted. The employees’ involvement in designing a new system will also help the implementation of a new system to be accepted. The employees who are directly involved in designing a system will tend to have the sense of responsibility on the system implementation, so that there will be more support of the system implementation to be accepted.
Petter and McLean (2008) examined a success model of an information system consisting of 6 categories which are: system quality, information quality, utility, user’s satisfaction, personal influence, and organizational influence. In this study, it will employ the relationship between information quality produced by user’s satisfaction. The information quality is related to information characteristics in such a way so that the output resulted from information system may be worthwhile for the users. This causes the quality of information product having direct impact on job satisfaction; indirect influence resulted from information product quality on job satisfaction is role ambiguity (RA) and role conflict (RC). Moreover, an organization encounters numerous problems and difficulties, wisdom to execute activities of training and development must still be taken. Since according to them the failure and deterioration of an organization is caused by a leader reduces or negates the budget for education, training and development of the employees, so they are capable of using system device. There are several problems of study, as follows:
1. How is the quality of Region Financial Information System (SIKD) Management Result, Role Ambiguity, and Training on Precision of Financial Statement of Local Government Presentation in North Sumatera?
2. Does the management of Region Financial Information System (SIKD) in North Sumatera run effectively?
LITERATURE REVIEWS
Theory of Reasoned Action (TRA)
This study aims at describing the relationship between attitudes and behaviors of an individu on the implementation of Region Financial Information System. In the Theory of Reasoned Action (TRA) mentioned by Park (2000) which is a theory in relation to the attitudes and behaviors of an individu in executing a reasoned activity/action. By implementing Region Financial Information System in each region will impact on attitudes and behaviors of employees in the environment. The Governmental Regulation demands all relevant local government agencies to be able to implement Region Financial Information Sytem in each region. Zeid (2012) mentioned that information quality has significant influence on success of a system (81,9%) followed by the doer’s intention (80,2%); system benefits (78,8%); whereas the user’s involvement (70%). The thorough result shows that the model proposed can be beneficial for the decisions made by organization.
Impact of Information System
According to Abugabah and Sanzogni (2010), each information system designer must make a concept of how the information system can be implemented in the relevant organization. It must be estimated carefully by a designer, in order to make the information system can be implemented effectively. Liviu (2015) states that there are other elements related to the supporter of information system infrastructure which are culture, hardware, software, brainware, and procedures which may influence the designing process of the information system. If technology change occurs in a company, it will give impact on the other three elements.
Characteristics of Information
To support the decision which will be taken by management, the management needs useful information. Each level of management with different activities, information with different characteristics is necessary. The characteristics of information which are necessary: (Romney and Steinbart, 2015)
1. Information solidity: For lower management, the characteristics of information are in detail and less solid, for it is particularly used to control operation. Meanwhile, for the higher management
2. Extent of information: For lower management, the characteristics of information is docues on certain problem, for they have specific tasks. For higher management, it needs information with increasingly wider characteristics, for the problem scope they get is also wider.
3. Frequency of information: For lower management, the frequency of information received is regular, for they have stuctured responsibility, and recurrent pattern. For higher management, the frequency of information is irregular or ad-hoc (sudden), for the top management related to non-structured decision-making which the pattern and time are not clear.
4. Schedule of information: For lower management, information received has schedule and periodic, for it has structured responsibility. Moreover, for higher management, it has unscheduled information.
5. Time of information: For lower management, information required is historical information, because it is used by lower manager in operational control examining regular responsibilities occured.
For higher management, the time of information is more for future in form of information of prediction, for it is used by top management for strategic decision-making related to future value.
6. Information access: For lower management, it needs the information which the period is clear and recurrent, so that it can be provided by information system given in form of periodic report. Therefore, lower management can access it offline. In contrast, for higher management information period required is unclear, so that online access needs to be provided for the top managers to take information at any time they need.
7. Source of information: Since the lower management more focuses on control of company interal operation, lower manager needs information with data derived from company internal. However, the top managers is more oriented to strategic planning in relation to outer company environment, so that beside needing company internal data derived from company external.
Decentralization of Decision-Making, Adaptation of Local Government Agency, Implementation of SIKD
Decentralization of decision-making results in condition change in an organization. In such condition the employees and managers are demanded to be able to respond to changes of local situation occured. They have to be able to adapt to the changes. Mitcheel and Newman (2002), stated that adaptation is a characteristic developing reliably which means that the ability to adapt with changing condition. According to Agbejule;s study (2005) it were found that the relationship between MAS (Management Accounting System) and the acceptance of uncertainty environment in managerial performance. If it is associated to local government, then the decentralization of local government has a broad opportunity to adapt in the existing environmental change, environment adaptation plays a role in decision-making and the implementation of SIKD. The adaptation performed by employees is expected to give contribution to managerial performance on the implementation of SIKD by the employees of local government agencies.
Role Ambiguity
Traning Intensity
Kiruja and Makuru (2013) stated that the success of an organization is located in the achievement of a strategic goal by employees. The function of employees’ performance is in the ability derived from training they underwent and they implemented in executing their responsibilities and functions. An organization encounters many problems and difficulties, wisdom to constantly execute training and development activities still have to be taken. Since according to them the failure and the deteriotation of an organization is caused by the manager reduces or even negates the budget for education, training, and development of employees.
Reviews of Previous Studies
Matrix of the previous studies which are nearly related to this study can be identified in Table 1:
Table 1
Reviews of Previous Studies
No. Year Researcher’s Name
Title Variable Employed Results of Study
1. 2014 Pujiswara, Ida Bagus
Influence of Region Financial Accounting and Information System Utilization & Monitoring of Regional Finance on Value of Financial Statement Information & Local Government Accountability monitoring on value of financial statement information and local government accountability.
The result of this study shows that there is influence of Region Financial Accounting and Information System Utilization and Monitoring on Regional Finance on Value of Financial Statement Information and Local Government Accountability
2. 2009 Nilawati, Ivon
A Study of Delay of Kajian Keterlambatan Expenditure
Accountability Report of Local Government Agencies (SKPD) in Central Lampung Regency of 2008
A study conducted descriptively employed neither dependent variables nor independent variables.
The activity of delivering expenditure accountability report in Central Lampung Regency was not really in accordance to the applicable provisions and punctuality frequently could not be reached.
3 2013 Wibowo, Reconciliation of Work Units (Study on Work Units in Working Region of KPPN Malang)
Capped budget, the amount of realization of expenditures, assets, education, experiences, training, the number of revision, application update of Accounting Unit Of Proxy of Budget User (SAKPA) and the use of e-reconciliation (e-recon.
Of the factors established, an analysis of panel data is conducted with the result that the factors influencing significantly on the accomplishment time of SAI data reconciliation is human resource capacity factor.
4. 2012 Rahman, Aulia et al
The Influence of Competence, Training and Accounting System of Institution on Quality of System of Institution and Quality og Financial Statement Accountability
Competence, training and accounting system of institution simultaneously influence quality of fiancial statement accountability of deconcentration in Aceh Government Agencies.
5 2014 Rasdianto dan Nurzaimah
Analysis on the Timeliness of the Accountability Report by the
Treasurer Spending in Task Force Units in Indonesia
the role of treasurer capacity on human resources and its tenure of services, facilities and infrastructures, the regulation, intensity of training administra tion and accountability of each of the task forces (SKPD)
The result of the study has revealed that simultaneously and partially the variables of treasurer’s human resources and tenure of service, facilities and infrastructure, the regulation and intensity of the training administration and the accountability. on The Effectiveness of The Administration and
Preparation of The Accountability Reporting System in North Sumatera as dependent variable and knowledge as independent variable.
Conceptual Framework
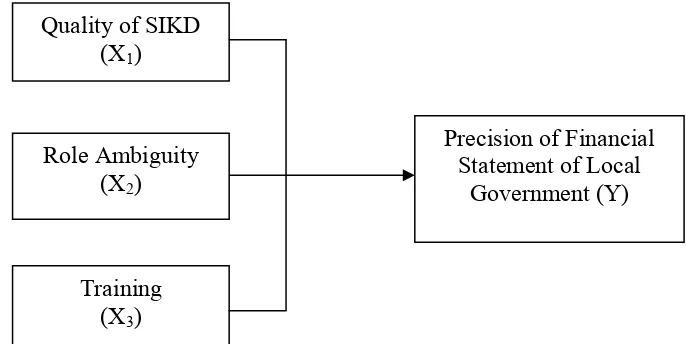
Figure 1: Conceptual Framework
Figure 1 : Conceptual Framework
Precision of Financial
Statement of Local
Government (Y)
Quality of SIKD
(X
1)
Role Ambiguity
(X
2)
Training
(X
3)
Research Hypotheses
1. Quality of Result of Region Financial Information System (SIKD) Management, Role Ambiguity and Training influence Precision of Financial Statement of Local Government Presentation in North Sumatera.
2. Management of Region Financial Information System (SIKD) in North Sumatera runs effectively.
RESEARCH METHOD
Research Type
The type of this study is survey explanatory which is a study decribing the relationship between several variables and other variables.
Population and Sampling Method
Population of this study is 7 Regencies in North Sumatera, especially in Accounting Department of Local Government Agencies (SKPD) of SIKD users. Research samples are 193 respondents, which the sampling process is conducted by purposive random sampling of 7 Regencies in North Sumatera which obtain unqualified, qualifird opinions of financial statement, and no opinion from Finance Auditor Body (BPK) Representatives of North Sumatera.
Definition of Operational and Variable Measurement of Study
Research variables comprise independent and dependent variables. The definition of operational and variable measurement can be seen in Table 2 as follows:
Table 2
Definition of Operational and Variable Measurement
Variable Definition of Operational Measurement Scale
Dependent
Precision of Financial Statement Presentation (Y)
Local Government Agencies which arrange statement of
finance is on time to financial
statement of Local Government Agencies made 2 (two) months at the latest after the budget ends.
Financial Statement of Local Government Agencies made consisting of Reports of Budget Realization, Balance, and Records of Financial Statement.
Interval
Independent Variabel
Quality of Result (X1) A level where information produced by the information system has been accordant with
the defined criteria such as
relevant, punctual, and etc. To identify the level of information product quality.
Level of information product quality, respondents
Interval
Role Ambiguity (X2)
An action which a person is
influenced by the discepancy in
a work or workplace or there is
conflict of values or interest with
other individu.
To identify the level of this
conflict to role, respondents
are instructed to answer 8 (eight) questions taken from questionnaire.
Interval
Training (X3)
Intensity of a Set of knowledge and skill assesment of
respondents aiming at improving good professionalism and working productivity in the
ability of preparation of financial
statement of local government.
a. working experience of liker employees in local
financial management
b. employees who have joined training about accounting.
Interval
Data Collection Technique
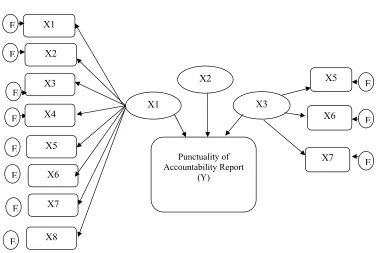
Figure 2: Research Method
Data Collection Technique
Gambar 3.1 :
Figure 2 : Research Method
Y = 1.X1+2.X2 + 3.X3+ ç
Y : Precision of Financial Statement of Local Government Presentation X1 : Quality
X18=λ14 X1 + Ɛ4 X19=λ14 X1 + Ɛ4 AP (X2)
X21=λ21 X2 + Ɛ1 X22=λ22 X2 + Ɛ2 X23=λ23X2 + Ɛ3 X24=λ23X2 + Ɛ3 X25=λ23X2 + Ɛ X26=λ23X2 + Ɛ P (X3)
X21=λ21 X3 + Ɛ1 X22=λ22 X3 + Ɛ X23=λ23 X3 + Ɛ X24=λ23 X3 + Ɛ4
Endogenous Construct KPLKPD (Y)
Y1= λx1 X1+ Ɛ1 Y2= λx1 X2+ Ɛ1 Y3= λx1 X3+ Ɛ Y4= λx1 X4+ Ɛ Y5= λx1 X5+ Ɛ1 Descriptions: λ = Standar Loading Ɛ = Error term
Compliance Testing and Model Statistical Testing
In addition to Normality test, Validity test and Reliability test of other analysis by using SEM require several fit index to measure the truth of the model proposed. There are several compliance indices and the cut-off value for model fit and proper test.
RESEARCH RESULTS AND DISCUSSION
Research Results
Descriptive Statistics
Table 3 Respondents of Study
GENDER Asahan Batubara T.Balai Labusel Labura Medan Padang
Sidempuan Serdang Bedagai Total
MALE 14 15 15 18 12 2 18 14 108
FEMALE 8 9 11 8 14 14 13 8 85
TOTAL 22 24 26 26 26 16 31 22 193
RANGE OF AGE
20 - 30 YEAR 7 11 6 13 13 0 8 6 64
31 - 40 YEAR 9 8 7 9 10 11 17 10 81
41 - 50 YEAR 6 3 12 4 2 3 6 3 39
51 - 55 YEAR 0 2 1 0 1 2 0 2 8
TOTAL 22 24 26 26 26 16 31 21 192
EDUCATION LEVEL
SENIOR HIGH SCHOOL 2 1 1 3 6 5 6 2 26
D3 2 1 2 0 1 2 3 8 19
S1 18 22 22 23 18 8 19 10 140
S2 0 0 1 0 1 1 3 1 7
TOTAL 22 24 26 26 26 16 31 21 192
POSITION
GOL II 3 2 3 3 10 8 9 10 48
GOL III 17 21 22 21 15 8 22 11 137
GOL IV 2 1 1 2 1 0 0 0 7
TOTAL 22 24 26 26 26 16 31 21 192
WORKING LENGTH
< 5 YEAR 4 5 12 14 17 3 0 18 73
5 - 10 YEAR 1 5 6 5 4 6 7 3 37
10 - 20 YEAR 5 13 6 6 6 6 20 0 62
> 20 YEAR 12 1 2 - - 1 4 0 20
TOTAL 22 24 26 26 26 16 31 21 192
Source: Tabulation Result (2015).
Description of Research Data
Statement of Local Government Presentation (Y). This is presented in Table 4 as follows:
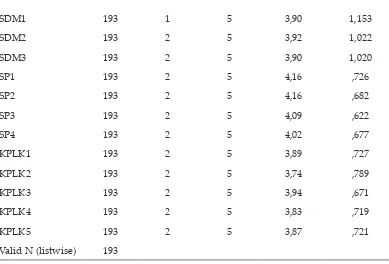
Table 4 Descriptive statistics
Descriptive Statistics
N Minimum Maximum Mean Std. Deviation
KHP1 193 1 5 3,38 ,660
KHP2 193 2 5 3,41 ,746
KHP3 193 2 5 3,43 ,618
KHP4 193 2 5 3,54 ,645
KHP5 193 2 5 3,58 ,641
KHP6 193 2 5 3,55 ,653
KHP7 193 2 5 3,52 ,700
KHP8 193 2 5 3,59 ,702
KHP 9 193 2 5 3,65 ,676
AP1 193 2 5 3,92 ,580
AP2 193 3 5 3,81 ,603
AP3 193 2 5 3,94 ,565
AP4 193 2 5 3,94 ,639
AP5 193 2 5 3,89 ,680
AP6 193 2 5 3,82 ,656
P1 193 2 5 4,17 ,659
P2 193 1 5 3,89 ,821
P3 193 1 5 3,91 ,808
P4 193 1 5 3,94 ,805
PK1 193 3 5 4,20 ,526
PK2 193 2 5 3,81 ,788
SDM1 193 1 5 3,90 1,153
SDM2 193 2 5 3,92 1,022
SDM3 193 2 5 3,90 1,020
SP1 193 2 5 4,16 ,726
SP2 193 2 5 4,16 ,682
SP3 193 2 5 4,09 ,622
SP4 193 2 5 4,02 ,677
KPLK1 193 2 5 3,89 ,727
KPLK2 193 2 5 3,74 ,789
KPLK3 193 2 5 3,94 ,671
KPLK4 193 2 5 3,83 ,719
KPLK5 193 2 5 3,87 ,721
Valid N (listwise) 193
Source: Output of SPSS (Appendix)
Result of Normality Test
The summary of multivariate normality test result can be seen in the following table.
Table 5
Summary of Multivariate Normality Test Result on Initial Model
Variable min max skew c.r. kurtosis c.r.
KPLK5 2,000 5,000 -,137 -,776 -,366 -1,038
KPLK4 2,000 5,000 -,239 -1,358 -,112 -,317
KPLK3 2,000 5,000 -,453 -2,571 ,605 1,715
KPLK2 2,000 5,000 -,071 -,403 -,529 -1,500
KPLK1 2,000 5,000 -,231 -1,311 -,221 -,628
P1 2,000 5,000 -,415 -2,353 ,160 ,453
P2 1,000 5,000 -,523 -2,964 ,460 1,304
Variable min max skew c.r. kurtosis c.r.
P3 1,000 5,000 -,432 -2,449 ,060 ,171
P4 1,000 5,000 -,738 -4,186 1,015 2,877
AP1 2,000 5,000 -,155 -,879 ,387 1,097
AP2 3,000 5,000 ,109 ,615 -,440 -1,247
AP3 2,000 5,000 -,189 -1,073 ,650 1,842
AP4 2,000 5,000 -,191 -1,086 ,120 ,340
AP5 2,000 5,000 ,037 ,208 -,606 -1,718
AP6 2,000 5,000 ,095 ,537 -,508 -1,442
KHP9 2,000 5,000 ,143 ,810 -,380 -1,079
KHP8 2,000 5,000 ,037 ,212 -,276 -,783
KHP7 2,000 5,000 ,236 1,340 -,271 -,770
KHP6 2,000 5,000 ,099 ,562 -,263 -,747
KHP5 2,000 5,000 ,054 ,307 -,275 -,781
KHP4 2,000 5,000 ,069 ,392 -,262 -,743
KHP3 2,000 5,000 ,201 1,139 -,219 -,620
KHP2 2,000 5,000 -,083 -,471 -,377 -1,070
KHP1 1,000 5,000 ,053 ,302 ,465 1,320
Multivariate 146,427 28,791
Result of AMOS.(2015).
According to the result of normality tets can be seen that critical ratio (c.r) value of curtosis value is 146,427 showing that the research variables which are normally distributed multivariate. As mentioned by Ghozali (2005) that the score of critical ratio > 5.00 indicating that the data was normally distributed multivariate.
The Result of Model Compatibility Test
Table 6
Summary of Model Compatibility Test Result
Compliance Index Estimation Score Criteria of GOF Test Test Result
CFI 0.846 >0.96 Good
RMR 0.000 < 0.05 (fit) Good
RMSEA Close 0.000 < 0.08 (fit) Model is Fit
CMIN/DF 0.000 < 2 (marginal fit) Model is Fit
p-value 0.000 p>0.05 (fit) Good
CMIN 12.276 (DF=249) Good
According to Table 6, it can be seen that the overall result of model compatibility test can be concluded that the model of estimation result model can be accepted, meaning that empirical model obtained is still consistent with the theoretical model.
Measurement Models
Measurement model is model associating latent variable and manifest variable as follows:
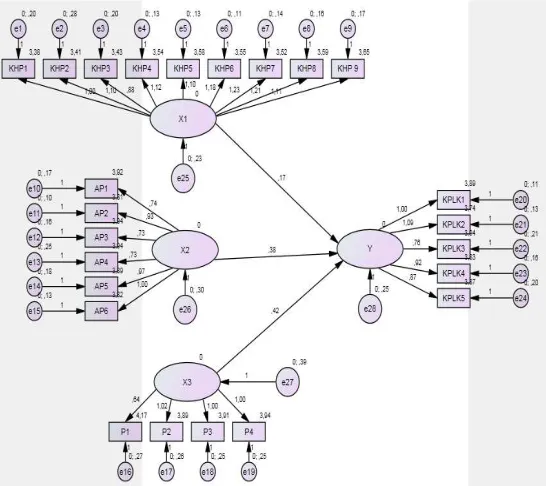
Figure 3: Coefficient of Standardization of Research Full Model
Measurement models of latent variable are as follows:
1. Measurement of latent variable of Quality (X1) is obtained that the worth of indicator is greater than the score of critical ratio < 1.96, implying that all indicators are valid as the measuring instrument for latent variables. 2. Measurement of latent variable of Role Ambiguity (X2) is obtained that the
worth of indicator is 0,301 smaller than the score of critical ratio < 1.96, implying that from all indicators, some are valid as measuring instrument. 3. Measurement of latent variable of Training (X3) is obtained that the worth of indicator is 0,42 smaller than the score of critical ratio < 1.96, imploying that from all indicators, some are valid as measuring instrument.
4. Measurement of latent variable of Precision of Financial Statement of Local Government Presentation (Y) is obtained that the wirth of indicator is, 25 smaller than the score of critical ratio < 1.96, implying that from all indicators, some are valid as measuring instrument.
Evaluation on Regression Weight for Causality Test
Data processing by Structural Equation Model (SEM) analysis uses AMOS, then it is obtained that the analysis result of the relationship between variables as stated in the following Table:
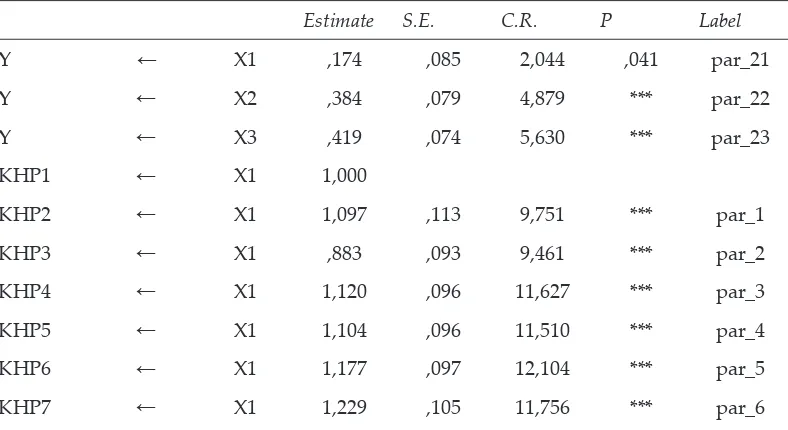
Table 7
Regression Weights: (Group number 1 - Default model)
Estimate S.E. C.R. P Label
Y ← X1 ,174 ,085 2,044 ,041 par_21
Y ← X2 ,384 ,079 4,879 *** par_22
Y ← X3 ,419 ,074 5,630 *** par_23
KHP1 ← X1 1,000
KHP2 ← X1 1,097 ,113 9,751 *** par_1
KHP3 ← X1 ,883 ,093 9,461 *** par_2
KHP4 ← X1 1,120 ,096 11,627 *** par_3
KHP5 ← X1 1,104 ,096 11,510 *** par_4
KHP6 ← X1 1,177 ,097 12,104 *** par_5
Estimate S.E. C.R. P Label
KHP8 ← X1 1,205 ,105 11,482 *** par_7
KHP9 ← X1 1,110 ,101 10,952 *** par_8
AP6 ← X2 1,000
AP5 ← X2 ,969 ,078 12,428 *** par_9
AP4 ← X2 ,729 ,079 9,257 *** par_10
AP3 ← X2 ,732 ,067 10,900 *** par_11
AP2 ← X2 ,926 ,067 13,777 *** par_12
AP1 ← X2 ,737 ,069 10,609 *** par_13
P4 ← X3 1,000
P3 ← X3 1,004 ,097 10,333 *** par_14
P2 ← X3 1,020 ,099 10,338 *** par_15
P1 ← X3 ,641 ,079 8,087 *** par_16
KPLK1 ← Y 1,000
KPLK2 ← Y 1,092 ,068 16,133 *** par_17
KPLK3 ← Y ,756 ,067 11,316 *** par_18
KPLK4 ← Y ,924 ,066 14,093 *** par_19
KPLK5 ← Y ,872 ,069 12,686 *** par_20
Source: Output of AMOS. (2015).
Equation which can be formulated is as follows: Y = 0,174 X1 + 0,384 X2 + 0,419 X3 + e
The test result shows that:
1. Quality (X1) significantly influences at level of 5% on Precision of Financial Statement of Local Government Presentation (Y) of 0,174.
2. Role Ambiguity (X2) significantly influences on Precision of Financial Statement of Local Government Presentation (Y) of 0,384.
3. Training (X3) significantly influences Precision of Financial Statement of Local Government Presentation (Y) of 0,419.
Discussion
The result of the hypothesis stating that Quality of Region Financial Information System Management Result (SIKD), Role Ambiguity and Training influence Precision of Financial Statement of Local Government Presentation in North Sumatera is accepted. The cause is all existing independent variables significantly influence dependent variables. Local government should begin to consider investment for the development of accounting and information system in regard to strengthen region autonomy and decentralization. Therefore, a new system and procedure of region financial management is necessary to replace the old system which is previously used by Local Government.
Role Ambiguity and Training influence Precision of Financial Statement of Local Government in North Sumatera is accepted. This is caused by all existing independent variables significantly influence dependent variables. Local government should have begun considering investment for the development of accounting and information system in regard to strengthen regional autonomy and decentralization. Therefore, a new system and procedure of region financial management is needed to replace the old system which is previously used by Local Government. In relation to the development of a system and in order to make the system can satisfy the expectation of the user, system made should be qualified so that the expectation to improve performance can be achieved. Thus, that is why each development of a system must be qualified, that is based on the following rationales (Steinbert and Romney, 2005: 5): 1) consistency, 2) efficiency, 3) popularity, and 5) Ability to adapt.
CONCLUSIONS AND SUGGESTIONS
Conclusions
1. Quality significantly influences at level of 5% on Precision of Financial Statement of Local Government Presentation.
2. Role Ambiguity significantly influences on Precision of Financial Statement of Local Government Presentation.
3. Training significantly influences Precision of Financial Statement of Local Government Presentation.
Research Contribution
2. For government in order to be able to perform improvement in Region Financial Information System (SIKD) management.
3. For academicians, the result of this study can be used as reference and material for further study in science of Public Sector Accounting.
4. For further study, the result of this study can used as the further base to examine the effectiveness of Region Financial Information System (SIKD).
5. Moreover, it also can be used to support and accelerate the achievement of unqualified opinion from Finance Auditor Body of Republic of Indonesia.
Limitations
1. It is still necessary to conduct a study in the same aspect to identify the consistency of the result if this study.
2. The samples employed in this study derived from 7 Regencies so that it limits the generalization ability of the result of this study.
Suggestions
1. The findings of this study can be considered by practitioners or academicians as an important input in relation to SIA infrastructure supporting statement of finance integrally in North Sumatera.
2. For further period, especially for the second year, then this study will be extended in other Regencies exist in North Sumatera so that it creates a broder model.
3. A study with similar topic in the future can be reconduct by using technology acceptance model (TAM) by adding the same variables or other variables such as culture, education level, and the characteristics of responsibility. Moreover, it extends the population to several Local Government Agencies.
References
Abugabah, A., & Sanzogni, L. (2010, June). Information systems models: A synthesized validated model for measuring information systems impacts on end user performance. In Information Society (i-Society), 2010 International Conference on (pp. 230-237). IEEE.
Agan Y. (2011), Impact of Operations, Marketing and Information Technology Capabilities
on Supply Chain Integration, Journal of Economic and Social Research, vol. 13 (1), 27-58.
Agbejule, A. (2005). The relationship between management accounting systems and perceived environmental uncertainty on managerial performance: a research note. Accounting and Business Research, 35(4), 295-305.
Caillier, J. G. (2014). Does Public Service Motivation Mediate the Relationship between
Goal Clarity and both Organizational Commitment and Extra-Role Behaviours?. Public
Management Review, (ahead-of-print), 1-19.
Ghozali, Imam. (2005). Multivariate Statistik. Undip Press. Semarang.
Grafton, J., Lillis, A. M., & Widener, S. K. (2010). The role of performance measurement and evaluation in building organizational capabilities and performance. Accounting,
Organizations and Society, 35(7), 689-706.
Kiruja, Ek. & Mukuru, E. (2013). Effect of Motivation on Employee Performance in Public
Middle Level Technical Training Institutions in Kenya. International Journal of Advances in Management and Economics, Vol. 2, No. 4, pp. 73-82.
Liu, H. H. (2011). Impact of regulatory focus on ambiguity aversion. Journal of Behavioral Decision Making, 24(4), 412-430.
Liviu, B. (2015). Information Technology And The Company Performance In The Sector Of
Services. Annals-Economy Series, 127-133.
Maksum, A., Hamid, R., & Muda, I. (2014). The Impact of Treasurer’s Experience And
Knowledge on The Effectiveness of The Administration and Preparation of The
Accountability Reporting System in North Sumatera. Asian Journal of Finance & Accounting, 6(2). 301-318. URL: http://dx.doi.org/10.5296/ajfa.v6i2.6341.DOI:. doi:10.5296/ajfa.v6i2.6341.
Mitchell, Melanie and Mark Newman (2002). Complex Systems Theory and Evolution. In
Encyclopedia of Evolution (M. Pagel, editor), Oxford University Press. New York. Nilawati, Ivon. 2009. Kajian Keterlambatan Laporan Pertanggungjawaban Pengeluaran
Satuan Kerja Perangkat Daerah (SKPD) Di Kabupaten Lampung Tengah Tahun 2008. Online Journal. Universitas Indonesia.
Park, H. S. (2000). Relationships among attitudes and subjective norms: Testing the theory
of reasoned action across cultures. Communication Studies,51(2), 162-175.
Regulation of Minister of Home Affairs No. 59 of 2007, Guidelines of Region Financial Management Management, Department of Home Affairs of Republic of Indonesia.
Governmental Regulation (PP) Number 105 of 2000 about Presentation of Regional Government Budget
Governmental Regulation (PP) number 6 of 1975 about Procedures of Budget Preparation. Governmental Regulation number 58 of 2005 about Assessment on Local Government
Achievement.
Regulation of Minister of Home Affairs No. 21 of 2011 about Guidelines of Region Financial
Management.
Petter, S., DeLone, W., & McLean, E. (2008). Measuring information systems success:
Primasari, Dona Lego Waspodo, Syaiful Rahman. 2008. Antecedent Variables and
Consequence of Implementation of Region Financial Information System (SIKD) (An
Empirical Study on Coordination of Development Regions Cross-Regency/City Region I
Province of Central Java). Accounting National Symposium XII in Solo.
Rahman, Aulia, Darwanis and Dana Siswar (2012). Influence of Competence, Training
and Accounting System of Institution on Quality of Accountability of Financial Statement of Decocentration Fund (A Study on Aceh Government Agency Managing Deconcentration Fund). Postgraduate Accounting Journal of Syiah Kuala University Banda Aceh. Volume 2, No. 1, November 2012.
Rasdianto dan Nurzaimah (2014). Analysis on the Timeliness of the Accountability Report by the Treasurer Spending in Task Force Units in Indonesia. International Journal of Academic Research in Accounting, Finance and Management Sciences. V ol. 4, No.4, October 2014, pp. 176–190. E-ISSN: 2225-8329, P-ISSN: 2308-0337. URL: http://dx.doi. org/10.6007/IJARAFMS/v4-i4/1304.
Robbins, Stephen P. 2006. Behaviors of an Organization. 10th Edition. Translation by Drs.
Benyamin Molan. Jakarta : PT Indeks.
Romney, Marshall B. , Paul J. Steinbart. (2015). Accounting Information Systems. Thirteenth edition. Global edition. Harlow, Essex Pearson.
Decree of Minister of Home Affairs No.900-099 about Region Financial Administration
(MAKUDA).
Law (UU) Number 5 of 1974 about Region Financial Information System.
Law Number 17 of 2003 about State Finances.
Law Number 25 of 1999 about Central and Regional Finance Balance
Law Number 33 of 2004 Central and Regional Finance Balance.
Wibowo, Dedye Priyo. 2013. Analysis of Influential Factors on Accomplishment Time of
SAI Data Reconciliation of Work Unit (A Study on Work Unit in Working Areas of KPPN Malang). Online Journal of Brawijaya University Malang.
Wijaya,Tony. 2009. Analysis of Structural Equation Modeling using Amos. Publisher Atma Jaya University, Jogyakarta.
Zaied, Abdel Nasser H. (2012). An Integrated Success Model for Evaluating Information System in Public Sectors.