Effects of Flow Force on the Characteristics of
Electrohydraulic Servovalves
I. Iwan, S. W. Ji, H. H. Kim, I.Y. Lee
Dept. of Mechanical Design Engineering,Pukyong National University Busan, Republic of Korea
S.H.Kim, H.C.Lee
SG Servo Co. Changwon, Republic of KoreaAbstract—In this study, the effects of flow force applied to the spool in electrohydraulic servovalve on the valve’s performances are investigated. First, experiments investigating flow force in an electrohydraulic servovalve is conducted, and various physical parameters of the servovalve are measured. Then, a simulation program for the valve was developed based on the full mathematical model of the servovalve, using the measured physical parameters’ values and the experimental results on the flow force. The effects of the flow force on the valve performances are described in detail based on the simulation results.
Keywords— servovalve; flow force; valve performance
I. INTRODUCTION
In nozzle-flapper type electrohydraulic servovalves with two stage construction, exemplified in Fig. 1, flow forces arise in the flapper-nozzle part and the spool-sleeve part. In this study, flow force in the spool-sleeve is focused on. The flow force consist of steady state flow force and unsteady state flow force. The steady state flow force constitutes overwhelming portion against the unsteady state flow force in usual servovalves [1-3].
There are many research works related to the flow force, some of them study flow force in the flapper [4, 5] and the others study flow force in the spool valve. Flow force has been calculated from the mathematics model in [6, 7]. Simulation of flow force using computation fluid dynamic, CFD, had been done in [8]. Reference [9-10], flow force was measured by direct measurement method. In [11, 12], the research on the compensation flow forces on spool valves was shown. All the research works are mentioned above only describe the value of the flow force, but there is no research on the effects of flow forces on the servo valve performance.
In the researches listed above, and in the famous text books [1-2] on hydraulic control systems, flow force in the servovalves is described as a symptom that should be reduced as small as possible. However, the degree of the harmful effect of it on the valve performances is not described in detail. Motivated by this, this study was undertaken.
In this study, the effects of flow force applied to the spool in nozzle-flapper type electrohydraulic servovalves with two stage construction on the valve performances are investigated. First, experiments investigating flow force in an electrohydraulic servovalve is conducted, and various physical parameters of the servovalve are measured. Then, a simulation program for the valve is developed based on the full mathematical model of the servovalve, using the measured physical parameter values and the experimental results on flow force. The effects of flow force on the valve performances are described in detail based on the simulation results.
II. BASIC EQUATIONS FOR THE SERVOVALVE The mathematical model of a nozzle-flapper type electrohydraulic servovalve with two stage construction is expressed as follows.
A. Torque balance equation in the flapper
The equation on the movement of the armature of the torque motor in the servovalve is described as follows.
2 2
m a b n s
v
i ft
k i k k p p a r F r b
d d
B J
dt dt
(1)
Fig.1 Schematic of the electrohydraulic servovalve with two stage construction
2015 International Conference on Automation, Cognitive Science, Optics, Micro Electro-Mechanical System, and Information Technology (ICACOMIT), Bandung, Indonesia, October 29–30, 2015
where Fs kfsxs
rb
. Also,J B, v, , kft,km,kfs,and
r bare inertia of the armature and the attached mass, damping coefficient of the armature’s rotational movement, rotational angle of the armature, torsional spring constant of the flexure tube, magnetic spring constant of the torque motor, spring constant of cantilevered feedback spring at the free end, radius of flapper rotation and the distance between nozzle center and the tip of feedback spring, respectively.
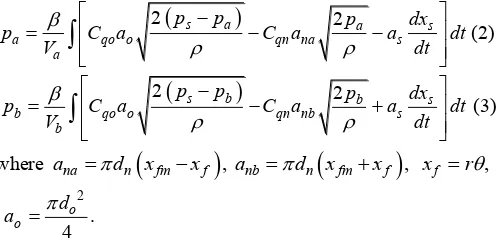
B. Continuity equations in the valve chambers
Continuity equations in both fluid chambers in the second stage of the valve give
C. Force balance equation in the spool
Force balance equation for describing the movement of the spool is of the spool, damping coefficient of the spool movement, spool displacement and angle of jet flow, respectively.
D. Flow equation in the valve
Flow through the spool valve can be computed as
s l displacement, supply pressure, load pressure and density of oil, respectively.
III. SIMULATION MODEL OF THE SERVOVALVE Based on Eq. (1), (2), (3) and (4), a block diagram can be drawn as Fig. 2. Relation between flow rate and current input can be investigated by applying a PI controller to the valve model (Fig. 2) as shown in Fig. 3. The current required to drive the valve shall be computed from the model shown in Fig. 3.
Fig. 2 Simulation model of the servovalve
TABLE 1. PARAMETERS OF THE SERVOVALVE
symbol description unit value Torque motor
v
B damping coefficient of the armature rotation
k magnetic spring constant of torque motor b distance between nozzle center
and the tip of feedback spring
m 210-2
cantilevered feedback spring at the free end
V volume in the left side nozzle chamber
System pressure & oil property
l estimated through the process of comparison between the results of the simulation and the responses shown in the catalog. The value of xfm is estimated through the process of
comparison between the initial setting value
4 10 Pa 6
of
a b
p
p
and the simulation resultsof
p
a
p
b
.
The values of Cq, Cqn, Cqo and f are obtained based on [13].IV. EXPERIMENT FOR FLOW FORCE MEASURING
Fig. 4 shows 3-D drawing of the second stage of the servovalve for flow force measuring devised by the authors. The spool can move by adjusting the micrometer handles ①. Flow force and displacement of the spool are measured by the load cell ③ and the displacement sensor ⑥, respectively.
Fig. 5 shows the photograph of the experimental device to measure flow force. In this experiment, the supply pressure of oil is 7 10 6 Pa.
In the experiment, the neutral position of the spool should be found. This is done by adjusting the spool movement, and thereby finding the position which gives the minimum flow rate. Measuring process is summarized as
-The neutral position of the spool is found.
-Spool displacement is set to a position prescheduled.
-Pressure record of
pspr
is identified to be 7 10 6Pa,Fig. 4 3-D drawing of the second stage of the servovalve for flow force measuring [ཛ micrometer, ཛྷ load cell support, ཝ
load cell, ཞ servovalve block, ཟ manifold, འ
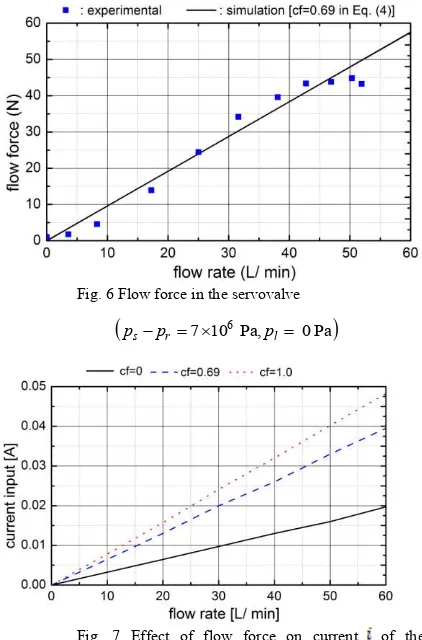
Fig. 6 shows a comparison between the experiment and the simulation on flow force. In Fig. 6, the simulation results were obtained by determining cf(the flow force correction factor in Eq. (4)) to be 0.69. The results of the simulation and be 0.69. The results of the simulation and the experiment show good agreement on a broader scale. However, around the valve’s position of complete closing and the full opening, the experiment show good agreement on a broader scale. However, around the valve’s position of complete closing and the full opening, discrepancies between the simulation and the experiment are shown markedly. It seems that the reason for the discrepancies is due to the values of f and Cq in the simulation. It is because the values of f and Cq in the simulation are constants, though they are not constants in the real valve.
V. EFFECTS OF THE FLOW FORCE ON THE VALVE PERFORMANCES (SIMULATION)
In the research reports listed in section I [3-12] and the textbooks [1,2] on hydraulic control systems, the flow force in servovalves is described to be a symptom that should be reduced as small as possible. However, the degree of the harmful effects of it on the valve performances is not described in detail. This section describes the simulation results on the effects of the flow force on the valve performances in steady state response, step response and frequency response. The simulation is conducted by using the mathematical model shown in Fig. 2 and Fig 3, and the physical values in Table 1.
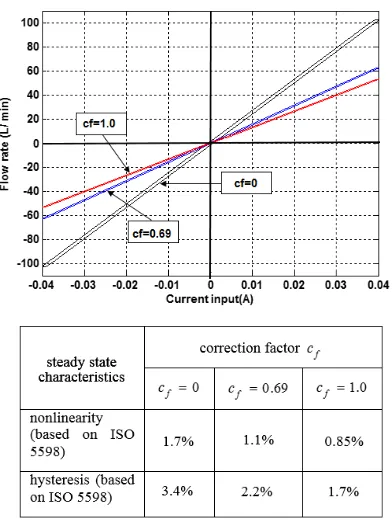
Fig. 7 show the effects of the flow force on the steady state characteristics of the valve. Bigger value of cf implies the case of bigger flow force. Fig. 7 implies that bigger current supply is required to operate the valve under the existence of flow force. For examples, when cf 0, 0.69, 1.0, the current input becomes i0.017, 0.032, 0.047A, respectively This.
simulation result means that the current increase under this severe variation of flow force is restricted to an endurable level in the view point of the electric energy consumption and heat release in the torque motor. This tendency on the relation between the flow force and the current supply can be explained by the energy amplification effect by the nozzle-flapper mechanism in the electrohydraulic servovalve. Fig. 5 Photograph of the experimental apparatus for measuring the flow force [ཛ servovalve (main spool/ sleeve part), ཛྷ displacement sensor (0-1
mm), ཝ load cell (0-110 N), ཞ micrometer (0-1 mm), ཟ pressure sensor 0 1.5 10 Pa 7 , འ pressure sensor0 5 10 Pa 6 ,
ཡ flow sensor (110 L/ min), ར flow sensor (5 L/ min), ལ relief valve, ཤ PC]
Fig. 6 Flow force in the servovalve
7 10 Pa, 6 0 Pa
s r l
p p p
Fig. 7 Effect of flow force on current of the
Fig. 8 shows the simulation results of flow characteristics under no-load when cf = 0, 0.69 and 1.0. The simulation reveals that the flow force may contribute to the improvement of linearity and hysteresis characteristics of the valve.
Fig. 9 shows the results of the simulation and the experiment (from the catalog data, Moog G761) in frequency responses. The simulation result with cf 0.69exhibits comparatively good agreement with the experimental result. Fig. 9(a) reveals that bigger flow force causes faster response (higher band-width). However, this faster response in Fig. 9 current in proportional valve is 2 A, current input will increase until 6 A. Big flow force causes a big current input that induce increasing heat and reducing the reliability of proportional valve.
In the case of servovalve, current input is quite small (40 mA), so increasing the current input causes the reducing of endurable level of the servovalve itself. If the servovalve use in portable/ mobile application, increasing flow force induces the energy consumption.
VI. CONCLUSION
In this study, the effects of flow force applied to the spool in electrohydraulic servovalve on the valve’s performances
were investigated. First, experiments investigating flow force in an electrohydraulic servovalve was conducted, and various physical parameters of the servovalve were measured. Then, asimulation program for the valve was developed based on the full mathematical model of the servovalve, using the measured physical parameters’ values and the experimental results on the flow force.
101 102 103
(a). simulation (amplitude ratio= -8, -5.2, -5 dB at -900 phase, when cf 0, 0.69, 1.0, respectively)
(b) experiment (from catalog, Moog G761)
Fig. 9 Frequency response of the servovalve
(i ir 40 mA, ps2.1 10 Pa, 7 amplitude
ratio= -7 dB, at -900 phase) Fig. 8 Effect of flow force on nonlinearity and hysteresis
of the servovalve at steady state (simulation,
7
40 mA, 2.1 10 Pa)
r s
The results of this study proved the followings.
(1) The flow force causes shortening the stroke of the spool. For this reason, the flow force may lead to the increase of
the current supply for driving electrohydraulic servovalve. However, it proved that the amount of the current variation due to the flow force is said to be an endurable level.
(2) The flow force may contribute to the improvement of linearity and hysteresis characteristics of electrohydraulic servovalve.
(3) The flow force can induce faster response (higher band-width) characteristics for electrohydraulic servovalve.
In the proportional valve, big flow force causes a big current input that induce increasing heat and reducing the reliability of proportional valve. In the servovalve, big flow force causes the reducing of endurable level of the servovalve itself
Acknowledgment
This study work was supported by Advanced Technology Center (ATC, 10045861) program through the Korea Evaluation Institute of Industrial Technology funded by the Ministry of Trade, Industry and Energy in 2014.
References
[1] Merrittt, H. E., Hydraulic Control System. John Wiley & Sons, Icn. New York. 1967,
[2] Blackburn, J. F., Fluid Power control. The M. I. T. Press, Cambridge, Massachusetts, and London, England, 1960.
[3] Istanto I., S. W. Ji, H. H. Kim, I. Y. Lee. S. H. Kim, and H. C. Lee.
“Analysis of Hydraulic servovalve using Linear and Nonlinear Model,”KSFC Conference S2-5, pp. 55-61, September 2014.
[4] Urata E., and Yamashina C., “Influence of Flow Force on the Flapper
of a Water Hydraulic Servovalve,” JSME International Journal, 1998.
[5] Aung N. Z., Yang Q., Chen M., and Li S., “CFD Analysis of Flow Forces and Energy Loss Characteristics in a Flapper –Nozzle Pilot Valve with Different Null Clearances,” Elsevier, 2014.
[6] Lee I. Y., Son J. M., and Kam J. S., "Reflection of Flow Force to Simulation Model of Proportional Directional Control Valve with Spool Position Feedback," Proc. of 8th JFPS International Symp. on Fluid Power, pp. 110-115, 2011.
[7] Tanaka K., Tomioka K., Shimizu F., and Fuchiwaki M., “A Study of Flow Force on a Spool Valve,” Trans. Of JFPS, Vol. 42, No. 1, pp. 13-18, 2011.
[8] Lisowski, E., Czyzyki, W., and Radja, J., “Three Dimensional CFD Analysis and Experimental Test of Flow Force Acting on the Spool of
Solenoid Operated Directional Control Valve,” Elsevier, 2013.
[9] Amirante R., Del Vescovo, G., and Lippolis, A., “Flow Force Analysis of an Open Center Hydraulic Directional Control Valve
Sliding Spool,” Elsevier, Italy, 2005.
[10] Nakano, K., Watanabe, H., and Ying, G. M., “Experimental Study for
the Compensation of Axial Flow Force in a Spool Valve,” Journal of
oil hydraulics and pneumatics, vol. 18, No. 6, 1987.
[11] Borghi, M., Milani, M., and Paoluzzi, R., “Stationary Axial Flow
Force Analysis on Compensated Spool Valves,” International Journal
of Fluid Power I No. 1 pp. 17-25, 2000.
[12] Yuan, Q., and Li, P. Y., “Using Steady Flow-force for Unsteady Valve
Design: Modeling and Experiments,” ASME J. Dyn. Syst., Meas.,
Control, 127, pp. 451-462, 2005.
[13] Watton, J., Fundamentals of Fluid Power Control. Cambridge University Press, New York, 2009.
[14] Amirante, R., Moscatelli, P. G., Catalano, L. A., “Evaluation of the flow forces on a direct (single stage) proportional valve by meass of a computational fluid dynamic analysis, “ www.sciencedirect.com, vol. 48, pp. 942-953, 2007
[15] Lee, I. Y., Son, J. M., Shin, H. B., and Son, J, H., “A Method for Estimating Fluid Force in Proportional Directional Control Valves
![Fig. 4 3-D drawing of the second stage of the servovalve for flow force measuring [� micrometer, � load cell support, � load cell, � servovalve block, � manifold, � displacement sensor]](https://thumb-ap.123doks.com/thumbv2/123dok/263954.506035/3.595.332.542.424.654/drawing-servovalve-measuring-micrometer-support-servovalve-manifold-displacement.webp)