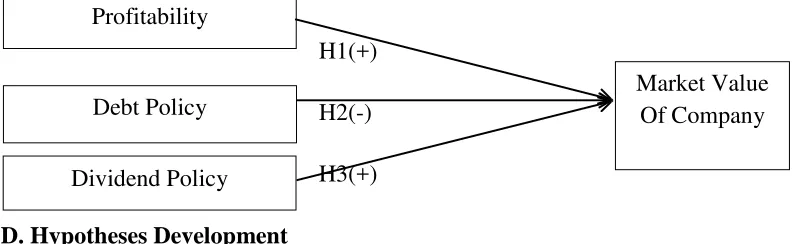
ANALYSIS EFFECT OF PROFITABILITY, DEBT POLICY, AND DIVIDENDS POLICY TO CORPORATE VALUES Analysis Effect Of Profitability, Debt Policy, And Dividends Policy To Corporate Values An Empirical Study from Indonesian Manufacturing Companies.
Teks penuh
Gambar

Dokumen terkait
"ASSET CHARACTERISTICS AND CORPORATE DEBT POLICY: AN EMPIRICAL. TEST", Journal of Business
EVIEWS ANALYSIS: MODEL OF INVESTMENT OPPORTUNITY SET IOS AND ITS IMPLICATION TO CORPORATE VALUE ON MANUFACTURING COMPANIES LISTED IN INDONESIA STOCK EXCHANGE IDX Lely Indriaty1, Gen
The Influence of Free Cash Flow and Capital Structure On Dividend Policy Empirical Study on Manufacturing Companies listed on the Indonesia Stock Exchange 2016-2020, PROCEEDING Call for
"THE EFFECT OF INTERNAL FACTORS ON CAPITAL STRUCTURE AND ITS IMPACT ON FIRM VALUE: EMPIRICAL EVIDENCE FROM THE FOOD AND BAVERAGES INDUSTRY LISTED ON INDONESIAN STOCK EXCHANGE 2013-
Relationship between Firm Characteristics, Debt Level and Earnings Quality of Listed Companies in the Stock Exchange of Thailand with the Moderating Effect of Corporate Governance
"THE EFFECT OF GOOD CORPORATE GOVERNANCE ON FINANCIAL PERFORMANCE IN LQ45 COMPANIES LISTED IN INDONESIAN STOCK EXCHANGE", Economics and Business Solutions Journal, 2020Publication
Marfirah & Syam 2016 “The Influence of Corporate Governance and Leverage on Tax Avoidance in Manufacturing Companies Listed on The Indonesia Stock Exchange Bei For the Period 2011-
The Influence of Indirect Effect of Profitability Through Debt Policy on Stock Prices The results prove that the debt policy proxied by the debt to equity ratio did not mediate the
