DROUGHT EARLY WARNING SYSTEM AND PREPARATION OF PLANTING PATTERN OF GLOBAL CLIMATE CHANGES IN
CONNECTION WITH MOBILE TECHNOLOGY-BASED
Purnomo Edi Sasongko1, I Gede Susrama MD), M. Syahrul Munir3
1
Agrotechnology Department, Faculty of Agriculture – UPN Veteran East Java 2
Infprmatics Department, Faculty of Industrial technology– UPN Veteran East Java 3
Master Student of Multimedia Intelligent Network Department - Post Graduate ITS Surabaya
ABSTRACT
In developing countries, drought due to natural disasters such as flood result in massive loss of farming practices. Warning communities of the incoming flood provides an effective solution to this by giving people sufficient time to prepare and protect their crop pattern and farm activities. However, the range of early warning system solutions introduces a tangle of conflicting requirements including cost and reliability, and creates several interesting problems from factors as diverse as technological, social, and political. The complexity of these systems and need for autonomy within the context of a developing country while remaining maintainable and accessible by nontechnical personnel provides a challenge not often solved within developed countries, much less the developing. After describing this problem, the paper discusses a proposed solution for the problem, initial experiments in implementing the solution, and lessons learned through that work.
Keywords : Early warning system, drought, cropping pattern. mobile applications.
INTRODUCTION
Global Climate Change due to El-Nino is a natural phenomenon of climate
change that are not regularly marked with increasing temperature of the equatorial
Pacific ocean surface. Increasing sea surface temperatures has resulted in drought
in some areas of eastern Indonesia, including some areas of East Java. During the
period of El Nino, the rainy season which occurs under normal and kemaraun
season is longer than normal. Conditions such adverse effects on agricultural
production, plantation, fishery and animal husbandry and other sectors. Year 2002 is
a puzzle that must be wary of the possibility of El-Nino and should be anticipated for
its impact on food insecurity could be reduced as small as possible is to create an
early warning system. So in this study the problems that arise are 1) global climate
change will affect the behavior of the climate elements such as rainfall, temperature,
radiation, and evapotranspiration. 2) The scope of the assessment location is dry
land in East Java Province, and 3) management of the cropping pattern is one key
here is to create an information to the users i.e.: Farmers, Entrepreneurs and Policy
Makers by applying geographic information system on-line, with information about
climate change, drought information and information on cropping pattern. This study
aims to: analyze the temporal characteristics of climate change classification spacio
oldeman in dryland rainfall especially in the era after the 1980's, analyzing the
vulnerability of dryland regions to drought, and develop zoning areas in accordance
with the level of dryness, determine the cropping pattern in land management dry by
taking into account rainfall, soil moisture and plant (crop water balance), and the
behavior of farmers in dealing with drought-based information technology
(geographic information system on line). While the outcome is expected in this study
are: Form a strategic policy to determine: management in dryland cropping,
reduction in yield losses, Anticipation cope with drought, Form Software
Geographical Information System on line to determine: Early Warning System,
Change Climate Information, Information Level drought areas, particularly East
Java, Cropping Pattern Change Information, National and the International Scientific
Publications, Implementing collaboration between Higher Education (UPN "Veteran"
East Java) with BPTP Malang
Drought is an insidious natural hazard characterized by lower than expected
or lower than normal precipitation that, when extended over a season or longer
period of time, is insufficient to meet the demands of human activities and the
environment. Drought is a temporary aberration, unlike aridity, which is a permanent
feature of climate. Seasonal aridity, that is, a well-defined dry season, also needs to
be distinguished from drought, as these terms are often confused or used
interchangeably. The differences need to be understood and properly incorporated
in drought monitoring and early warning systems and preparedness plans.
Drought must be considered a relative, rather than an absolute, condition. It
occurs in both high and low rainfall areas and virtually all climate regimes. Drought
is often associated only with arid, semi-arid and sub-humid regions by scientists,
policymakers and the public. In reality, drought occurs in most countries, in both dry
and humid regions. Drought is a normal part of climate, although its spatial extent
and severity will vary on seasonal and annual timescales.
A critical component of that strategy is a comprehensive drought monitoring
system that can provide early warning of drought’s onset and end, determine its
water-sensitive sectors in a timely manner. With this information, the impacts of drought
can be reduced or avoided in many cases.
Drought differs from other natural hazards in various ways. Drought is a
slow-onset natural hazard that is often referred to as a creeping phenomenon. It is a
cumulative departure from normal or expected precipitation, that is, a long-term
mean or average This cumulative precipitation deficit may build up quickly over a
period of time, or it may take months before the deficiency begins to appear in
reduced stream flows, reservoir levels or increased depth to the groundwater table.
Owing to the creeping nature of drought, its effects often take weeks or months to
appear (Figure 1). Precipitation deficits generally appear initially as a deficiency in
soil water; therefore, agriculture is often the first sector to be affected. It is often
difficult to know when a drought begins. Likewise, it is also difficult to determine
when a drought is over and according to what criteria this determination should be
made. Is an end to drought heralded by a return to normal precipitation and, if so,
over what period of time does normal or above normal precipitation need to be
sustained for the drought to be declared officially over? Since drought represents a
cumulative precipitation deficit over an extended period of time, does the
precipitation deficit need to be erased for the event to end? Do reservoirs and
groundwater levels need to return to normal or average conditions? Impacts linger
for a considerable period of time following the return of normal precipitation.
Therefore, is the end of drought signalled by meteorological or climatological factors,
or by the diminishing negative impact on human activities and the environment?
Another factor that distinguishes drought from other natural hazards is the
absence of a precise and universally accepted definition. There are hundreds of
definitions, adding to the confusion about the existence of drought and its degree of
severity. Definitions of drought should be region and application specific or impact
specific. Droughts are regional in extent and, as previously stated, each region has
Figure 1. Sequence of drought occurrence and impacts for commonly accepted drought types (WMO, 2006).
Proposed Solution For Drought
A comprehensive and integrated approach is required to monitor drought more
effectively and provide early warning. The collection of climatic and hydrologic data
is fragmented between many agencies or ministries in most countries. Often these
data are not reported in a timely fashion. Automating the data collection process can
substantially improve the timeliness and reliability of drought monitoring and early
warning systems.
The analysis of climate and water data is most effective when it is coordinated
under a single authority. This authority could be an agency or ministry or an
inter-agency authority and would be responsible for analysing data and producing useful
end products or decision-support tools for delivery to end users. Stakeholders must
be involved from the early stages of product development to ensure that the
information will serve their varied timing and content needs. A delivery system
should reflect the needs of this diverse clientele. The Internet is the most
cost-effective way to deliver information, but it is inappropriate in many settings. A
required in many instances. To date, monitoring and early warning systems have
been based on a single indicator or climatic index.
Recent efforts to improve drought monitoring and early warning in the United
States and other countries have provided new early warning and decision- support
tools and methodologies in support of drought preparedness planning and policy
development.
The lessons learned can be helpful models for other countries to follow as
they try to reduce the impacts of future droughts. An effective monitoring, early
warning and delivery system continuously tracks key drought and water supply
indicators and climate-based indices and delivers this information to decision
makers. This allows for the early detection of drought conditions and timely
triggering of mitigation and emergency response measures, the main ingredients of
a drought preparedness plan.
Drought Early Warning System (DEWS) is never a concept. Many applied
Drought Early Warning Systems have been studying in many counties, and some
have been used in practice. It is clear that DEWS can be used in many fields. There
are many such samples. Its application in precision agriculture can be identified as
available and efficient in this paper.
DEWS technological development speed is still very rapid reasonably. With
the development of spatial information technology and modern communication, as
well as the advance in computer hardware and software technologies, DEWS will
explore new areas of applications and become more intelligent, efficient and
steady. It may run online agroclimatic module from national meteorology, climate
and geophysic board, etc.
The most common view of DEWS is a linear top-down warning chain that is
expert-driven and hazard-focused from observation to warning generation and
transmission to users. An effective and sustainable EWS needs to have not only a
strong scientific and technical basis, but also a strong focus on the people exposed
to risk, with a systems approach that incorporates all relevant factors in that risk,
whether arising from natural hazards or social vulnerabilities or from short-term or
long-term processes. EWS is ideally a system of systems: it should no longer be
viewed only as a linear chain process, but rather as a mix (or other model) approach
depending on the characteristics and complexity of risks, especially under climate
Architecture Design
Architecture includes frameworks, institutional arrangements, norms,
polycentric-multi-layered systems and structures. System to be designed is the
application of technology-based forecasting system web service that is expected to
run on the mobile web platform, thus facilitating dissemination of information
about weather and potentially catastrophic drought. And early warning to farmers,
researchers and policy-making in the agricultural sector.
Design of System
This application is designed to support drought early warning system and
setting the cropping pattern, then the user of this system include: agriculture
department officials, farmers' groups, and system administrators. The system
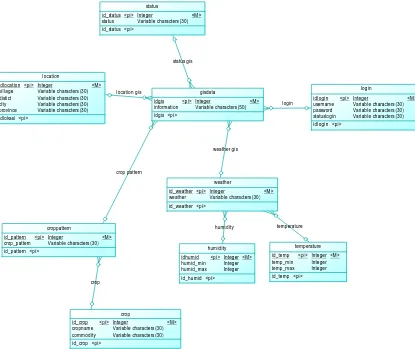
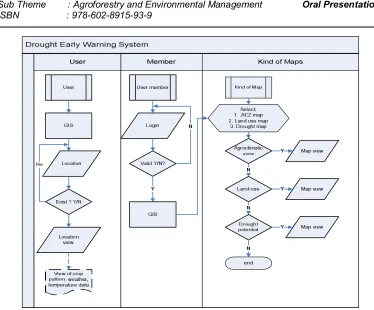
[image:6.612.115.530.326.675.2]design can expressed in figure 2 and figure 3.
Figure 2. Conceptual Data Model of Drought Early Warning System
location gis crop pattern crop status gis weather gis login temperature humidity location idlocation village distict city province <pi> Integer
Variable characters (30) Variable characters (30) Variable characters (30) Variable characters (30)
<M> idlokasi <pi> weather id_weather weather <pi> Integer
Variable characters (30) <M> id_weather <pi> croppattern id_pattern crop_pattern <pi> Integer
Variable characters (30) <M> id_pattern <pi> status id_status status <pi> Integer
Variable characters (30) <M > id_status <pi> crop id_crop cropname commodity <pi> Integer
Variable characters (30) Variable characters (30)
<M> id_crop <pi> login idlogin username password statuslogin <pi> Integer
Variable characters (30) Variable characters (30) Variable characters (30)
<M> idlogin <pi> gisdata idgis information <pi> Integer
Figure 3. Flow Diagram of Drought Early Warning System
CONCLUSION
Drought affects more people than any other natural disaster and results in
serious economic, social and environmental costs. The development of effective
drought monitoring, early warning and delivery systems has been a significant
challenge because of the unique characteristics of drought. Significant strides have
been made in recent years to improve the effectiveness of these systems. With the
increasing frequency and severity of drought in many regions of Indonesia and
increased societal vulnerability, more emphasis is now being placed on the
development of drought preparedness plans that are proactive rather than reactive
and emphasize risk-based management measures. Improved drought monitoring is
a key component of a drought preparedness plan and a national drought policy.
Early warning systems can provide decision makers with timely and reliable access
to information on which mitigation measures can be based. There are many
challenges to improving these systems, but a comprehensive, integrated approach
to climate and water supply monitoring is proving to be successful in
REFERENCES
Agboma, C.O., S. Z. Yirdaw, & K. R. Snelgrove 2009. Intercomparison of the Total
Storage Deficit Index (TSDI) over two Canadian Prairie catchments Journal of
Hydrology, 374, 351– 359.
American Meteorological Society. Glossary of Meteorology
Anderson, M.C., W. P. Kustas, J.R. Mecikalski, and C. R. Hain, 2009 “A
GOES-based drought product using thermal remote sensing of evapotranspiration, 23rd Conference on Hydrology, Session 2, Drought Prediction, Monitoring, and Mitigation, 17 Jan 2009, American Meteorological Society
Anderson, M.C., and W. P. Kustas, “Mapping Evapotranspiration and Drought at
Continental and Local Scales with a Thermal-based Surface Energy Balance
Model”
Andreadis, K.M., E.A. Clark, A.W. Wood, A.F. Hamlet, and D.P. Lettenmaier, 2005.
20th. Century drought in the conterminous United States, J. Hydrometeorology.
6, 985-1001
Berners-Lee, T., J. Hendler, and O. Lassila (2001) “The Semantic Web,”Scientific
American, May, 2001
Guttman, N.B. 1998. Comparing the Palmer Drought Index and Standardized Precipitation Index. Journal of the American Water Resources Association 34:113-121
Svoboda, M. 2009. Drought Early Warning Systems. Inter-Regional Workshop on Indices and Early Warning Systems for Drought Lincoln, NE December 8-11, 2009. School of Natural Resources University of Nebraska-Lincoln.