PERTANIAN
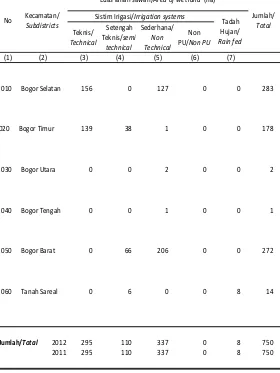
Sebagian besar lahan pertanian di Kota Bogor adalah
lahan bukan sawah yaitu sebesar 2.374 ha atau sekitar 76
persen. Sementara 24 persen sisanya adalah lahan sawah,
dan sebagian berlokasi di Kecamatan Bogor Selatan (283 ha),
Bogor Barat (272 ha) dan Bogor Timur(178 ha).
Palawija di Kota Bogor, tahun 2012 yakni Talas
menca-pai 3.232,65 ton dan ubi kayu sebanyak 3.140,28 ton.
Pro-duksi Kangkung di Kota Bogor tahun 2012 mencapai 979 ton,
tanaman tomat sebesar 702 ton.
Buah jambu biji pada tahun 2012 menghasilkan 1.128
ton sementara buah-buahan lainnya hanya berproduksi tidak
lebih dari 400 ton saja. Pada 2012, produksi tanaman
obat-obatan juga meningkat, temulawak menghasilkan 174,61 ton,
diikuti mengkudu/pace sebesar 143,50 ton dan laos sebesar
114,55 ton.
Cordyline
merupakan tanaman hias paling
popu-ler di Kota Bogor, terlihat dari luas tanam dan produksinya
paling besar di antara tanaman hias lainnya yaitu sebanyak
908.000 pohon, sedangkan tanaman hias lainnya hanya
ber-produksi kurang dari 550.000 pohon.
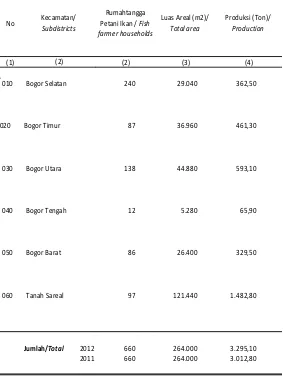
Produksi ikan di Kota Bogor tahun 2012 mencapai
336.743,5 ton, sebagian besar berasal dari budi daya ikan
ko-lam yaitu sekitar 78,39 persen atau sebesar 264.000 ton.
Tanah Sareal sebagai penyumbang terbesar yaitu 36,06 % dari
total produksi ikan. Petani ikan kolam air tenang umumnya
berada di wilayah kecamatan Bogor Selatan (36,36%) dan
Bo-gor Utara (20,91%).
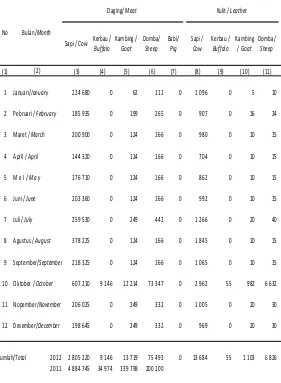
Populasi Ternak kecil pada 2012 terdapat sebanyak
8.948 ekor dan terbanyak berada di Kecamatan Bogor Selatan
yaitu mencapai 55,62 persen. Untuk ternak besar, didominasi
sapi perah sebanyak 857 ekor. Ternak unggas di Kota Bogor
didominasi ayam kampung yang mencapai 201.890 ekor,
se-Tabel 5.1 Table
2012
(1)
010 Bogor Selatan 283 580
020 Bogor Timur 178 383
030 Bogor Utara 2 496
040 Bogor Tengah 1 16
050 Bogor Barat 272 475
060 Tanah Sareal 14 424
Jumlah/Total 2012 750 2 374
2011 750 2 374
Luas lahan Pertanian Menurut Kecamatan Extensive Agricultural Land by Subdistricts
No Kecamatan/ Subdistricts
(2)
Lahan Sawah/Area of Wet land (ha)
Lahan Bukan Sawah/Area of Dry
land (ha)
AGRICULTURE
Most of the agricultural land in the city of Bogor is not a
paddy field that is equal to 2,374 ha , or about 76 percent .
While the remaining 24 percent is wetland , and most are
lo-cated in South Bogor sub-district ( 283 ha ) , Bogor West ( 272
ha ) and East Bogor ( 178 ha ) .
Crops in Bogor City , in 2012 the Talas reached 3232.65
tons and tons of cassava as much as 3140.28 . Swamp Cabbage
production in the city of Bogor in 2012 reached 979 tons , 702
tons of tomato plants .
Guava fruit in 2012 produced 1,128 tons of fruits while
others simply do not produce more than 400 tons. In 2012 ,
pro-duction of medicinal plants also increased , ginger produced
174.61 tons , followed noni / pace of 143.50 tonnes and 114.55
tonnes of laos . Cordyline is the most popular ornamental plant
in the city of Bogor , visible from the acreage and production is
greatest among the other plants as many as 908 000 trees ,
while other plants only produce less than 550,000 trees .
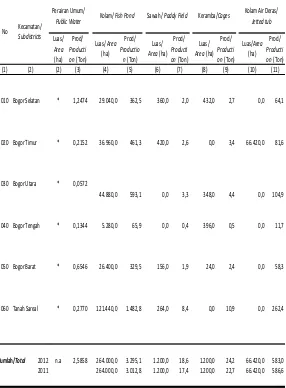
Fish production in the city of Bogor in 2012 reached
336,743.5 tons , mostly from aquaculture pond which is about
78.39 percent or 264,000 tons . Sareal ground as the largest
contributor to the 36.06 % of the total fish production . Calm
water pond fish farmers generally located in South Bogor
sub-district ( 36.36 % ) and North Bogor ( 20.91 % ) .
Livestock populations are much smaller in 2012 and the
highest was 8,948 tails in South Bogor District , reaching 55.62
percent . For large animals , dominated as much as 857 head of
dairy cattle . Poultry in Bogor City dominated the chicken
reaches 201 890 tails , the next broiler with a population
reach-ing 180 250 tails .
224
Kota Bogor Dalam Angka/
Bogor City in Figures
2012
226
Kota Bogor Dalam Angka/
Bogor City in Figures
2012
Tabel 5.2 Table
2012
(1) (3) (4) (5) (6) (7)
010 Bogor Selatan 156 0 127 0 0 283
020 Bogor Timur 139 38 1 0 0 178
030 Bogor Utara 0 0 2 0 0 2
040 Bogor Tengah 0 0 1 0 0 1
050 Bogor Barat 0 66 206 0 0 272
060 Tanah Sareal 0 6 0 0 8 14
Jumlah/Total 2012 295 110 337 0 8 750
2011 295 110 337 0 8 750
Sumber : Dinas Pertanian Kota Bogor
Source : Department of Agriculture of Bogor City
Luas Lahan Sawah Menurut Kecamatan dan Sistim Irigasi Area of Wet Land by Subdistricts and Irrigation Systems
(2) No Kecamatan/
Subdistricts
Luas lahan sawah/Area of wet land (ha)
Jumlah/ Total Sistim Irigasi/Irrigation systems
Tadah Hujan/ Rain fed Teknis/
Technical
Setengah Teknis/semi
technical
Sederhana/ Non Technical
Pertanian
/Agriculture
Tabel 5.3 Table
2012
(1) (3) (4) (5) (6) (7) (8)
010 Bogor Selatan 282 73 19 11 195 580
020 Bogor Timur 137 54 18 7 167 383
030 Bogor Utara 195 93 13 3 192 496
040 Bogor Tengah 3 3 5 0 5 16
050 Bogor Barat 128 72 8 2 265 475
060 Tanah Sareal 219 71 12 4 118 424
Jumlah/Total 2012 964 366 75 27 942 2 374
2011 964 366 75 27 942 2 374 No Kecamatan/
Subdistricts
Luas lahan bukan sawah/Area of non Fiels land (ha)
Jumlah/ Total Tegal/
Ditanami pohon/Trees
planted
Kolam/ Fishpond
Tidak Diusahakan/ Temporarily non cultivated
Lainnya/ Others
(2)
Luas Lahan Bukan Sawah Menurut Kecamatan Area of Dry Land by Subdistricts
Tabel 5.5 Produksi Telur Unggas menurut Kecamatan Table Poultry Egg Production by Subdistricts
2012
(1)
010 Bogor Selatan - 19.313 7.088
020 Bogor Timur 359.815 5.782 1.440
030 Bogor Utara - 10.825 2.910
040 Bogor Tengah - 5.644 2.585
050 Bogor Barat - 19.153 6.307
060 Tanah Sareal - 12.875 2.890
Jumlah/Total 2012 359.815 73.592 23.220
2011 1.926.087 205.645 104.957 No Kecamatan/
Subdistricts
(2)
Ayam Ras/ Improved hen
(Ton)
Ayam Bukan Ras/ Local hen (Ton)
Itik/ Ducks (Ton)
228
Kota Bogor Dalam Angka/
Bogor City in Figures
2012
230
Kota Bogor Dalam Angka/
Bogor City in Figures
2012
Tabel 5.6 Luas Areal dan Jumlah Produksi Ikan Menurut Tempat Penangkapan/Pemeliharaan per Kecamatan Table Total Area and Total Production of Fish According to the Place of Capture / Maintenance by Subdistricts
2012
(1) (2) (3) (4) (5) (6) (7) (8) (9) (10) (11)
010 Bogor Selatan * 1,2474 29.040,0 362,5 360,0 2,0 432,0 2,7 0,0 64,1
020 Bogor Timur * 0,2152 36.960,0 461,3 420,0 2,6 0,0 3,4 66.420,0 81,6
030 Bogor Utara * 0,0572
44.880,0 593,1 0,0 3,3 348,0 4,4 0,0 104,9
040 Bogor Tengah * 0,1344 5.280,0 65,9 0,0 0,4 396,0 0,5 0,0 11,7
050 Bogor Barat * 0,6546 26.400,0 329,5 156,0 1,9 24,0 2,4 0,0 58,3
060 Tanah Sareal * 0,2770 121.440,0 1.482,8 264,0 8,4 0,0 10,9 0,0 262,4
Jumlah/Total 2012 n.a 2,5858 264.000,0 3.295,1 1.200,0 18,6 1.200,0 24,2 66.420,0 583,0
2011 264.000,0 3.012,8 1.200,0 17,4 1.200,0 22,7 66.420,0 586,6
Sumber : Dinas Pertanian Kota Bogor Source : Department of Agriculture of Bogor City
No Kecamatan/ Subdistricts
(2)
Perairan Umum/ Public Water
Luas/ Area (ha)
Prod/ Producti on (Ton)
Luas/ Area (ha) Luas/ Area
(ha) Prod/ Productio
n (Ton) Luas/ Area (ha)
Prod/ Producti on (Ton) Kolam/ Fish Pond Sawah / Paddy Field
Prod/ Producti on (Ton)
Luas/Area (ha)
Prod/ Producti on (Ton) Keramba/Cages Kolam Air Deras/
Jetted tub
Tabel 5.4
Table Target and Realization of Paddy
2012
(1) (3)
010 Bogor Selatan 610 3 690,50 0
020 Bogor Timur 258 1 560,90 0
030 Bogor Utara 7 42,35 0
040 Bogor Tengah 0 0,00 0
050 Bogor Barat 446 2 698,30 0
060 Tanah Sareal 26 157,30 0
Jumlah/Total 2012 1 347 8 149,35 0
2011 1 732 10 431,90 0
Sumber : Dinas Pertanian Kota Bogor
Source : Department of Agriculture of Bogor City Target dan Realisasi Produksi Padi
No Kecamatan/ Subdistricts
(5) (4)
(2)
Luas panen/ Area harvested
(ha) Padi Sawah/Wet land Paddy
Tabel
5.7
Target, Realisasi dan Produksi Tanaman Padi Menurut Intensifikasi
Table
Target, Realization and Actual Production of Rice Crop by Intensification
2012
1. Supra Insus
-
-
- Kredit /
Credit
-
-
- Swadana/
Self Finance
-
-
-2. Intensifikasi Khusus (INSUS)
-
-
Special intensification
- Kredit /
Credit
-
-
- Swadana/
Self Finance
-
-
-3. Intensifikasi Umum (INNUM)
1.303
1.347
8.149
General intensification
4. Non Intensifikasi
-
-
Non intensification
Jumlah/Total
2012
1.303
1.347
8.149,35
2011
1.596
1.627
10.431,84
(2)
(3)
(4)
Target/
Target
(ha)
Realisasi /
Realization
(ha)
Produksi/
Production
(ton)
(1)
Tanaman/
Plant
Tabel 5.9 Target, Realisasi dan Produksi Tanaman Sayuran Menurut Jenis Tanaman di Kota Bogor Table Target, Realization and Actual Production of Vegetables by Kind in Bogor Municipality
2012
(1) (3) (4) (5) (6) (7) (8)
1 Bayam/ Spinach 114 111 346,90 114 86 310,00
2 Buncis/ French Beans 48 49 322,90 48 46 345,00
3 Cabe/ Chili 24 16 114,00 24 24 144,00
4 Kacang Panjang/Yard long beans 64 50 484,50 64 46 391,00
5 Kangkung/Swamp cabbage 98 80 935,00 98 89 979,00
6 Ketimun/Cucumber 68 54 619,50 68 56 588,00
7 Tomat/Tomatoes 44 32 594,00 44 39 702,00
8 Terung/ Eggplant 36 55 697,50 36 33 511,50
9 Daun Bawang/ Scallion 19 15 162,00 19 11 99,00
10 Cabe Rawit/ Hot chili 19 18 102,00 19 13 78,00
11 Petsai/Sawi/Mustard Greens 48 51 612,00 46 41 480,00
12 Kacang Merah/Kidney beans 18 14 126,00 18 15 90,00
13 Jamur / Mushrooms … … … 4 2 234,16 Produksi/ Production
(Ton) Jenis Tanaman/Kind of
No
2011 2012
Target/ Target (ha)
Realisasi/ Realization
(ha)
Produksi/ Production
(Ton)
Target/ Target
(ha)
Realisasi/ Realization
(ha)
232
Kota Bogor Dalam Angka/
Bogor City in Figures
2012
234
Kota Bogor Dalam Angka/
Bogor City in Figures
2012
Tabel 5.10
Table The Number of Trees Planted Harvested and Production of Fruits Tree in Bogor Municipality 2012
(1) (3) (4) (5) (6) (7) (8)
1 Alpukat/Alvocado 32 358 2 430 14 580,0 0 4 548 73,9
2 Belimbing/Starfruit 18 140 7 607 26 624,5 0 7 556 170,0
3 Jengkol/ 8 908 771 1 542,0 0 1 028 1,3
4 Durian/Durian 42 320 8 212 61 590,0 0 8 712 222,7
5 Jambu Biji/ Guava 190 688 104 016 312 048,0 3 140 110 052 1 128,0
6 Jeruk/ Orange 18 036 7 246 28 984,0 0 6 836 35,9
7 Mangga/ Manggo 54 584 3 319 19 914,0 0 4 152 249,1
8 Manggis/Mangistan 6 528 2 906 17 436,0 0 2 912 51,0
9 Nangka/Jack fruit 20 496 3 361 15 124,5 0 4 452 27,8
10 Nenas/ Pineapple 33 356 4 895 979,0 0 5 740 5,7
11 Pepaya/ Papaya 58 576 19 399 48 497,5 100 19 992 274,9
12 Pisang / Banana 173 802 22 120 33 180,0 200 23 044 345,7
13 Rambutan/Rambutan 41 384 16 224 97 344,0 0 16 776 209,7
14 S a l a k/ Zalaka 7 104 0 0,0 0 0 0,0
15 S a w o /Sapodillas 8 228 750 3 375,0 0 1 000 3,8
16 Sirsak /Soursop 17 620 14 244 21 366,0 0 14 264 82,0
17 Sukun /Breadfruit 12 664 7 880 35 460,0 0 7 880 69,0
18 P e t a i/ Petai 13 496 1 489 2 233,5 0 1 932 4,8
19 Melinjo /Melinjo 8 868 2 428 0,0 0 2 512 6,9
20 Jambu Air /Guava 111 048 33 391 106 173,0 0 33 416 108,6
Sumber : Dinas Pertanian Kota Bogor Source : Department of Agriculture of Bogor City
No
Pohon Ditanam/
Trees Planted
Pohon dipanen/
Trees Harvested
Produksi/ Production
(Ton)
(2)
Pohon Ditanam/
Trees Planted
Pohon dipanen/
Trees Harvested
Produksi/ Production
(Ton) Jenis Tanaman/Type plant
Banyaknya Pohon Ditanam, Dipanen dan Produksi Tanaman Buah-buahan di Kota Bogor
2011 2012
Tabel 5.8
Table Target and Actual Production of Crops 2012
(1) (3) (4) (5) (6) (7) (8)
1
Jagung/ Corn 180 192 562,06 197 202 727,20
2
Kedelai/ Soyabean 0 0 0,00 0 0 0,00
3
Kacang Tanah/Peanuts 70 63 64,06 74 87 107,30
4
Kacang Hijau/Small green 0 0 0,00 0 0 0,00 pea
5
Ubi Kayu/Cassava 322 105 4 883,00 312 244 3 140,28
6
Ubi Jalar /Sweet potatoes 106 111 1 454,00 96 110 1 441,00
7
Sorgum / Sorghum 0 0 0,00 0 0 0,00
8 Talas/ Taro 169 89 2 697,60 169 115 3 232,65
Sumber : Dinas Pertanian Kota Bogor
Source : Department of Agriculture of Bogor City Target dan Realisasi Produksi Palawija
No Tanaman/plant
2011 2012
Target/ Target (ha)
Realisasi/ Realizati
on(ha)
Produksi/ Production
(Ton)
Target/ Target (ha)
Realisasi/ Realizatio n(ha)
Produksi/ Production
(Ton)
Tabel 5.11
Table Area, Harvested Area and Production of Medicinal Plant by Kind 2012
(1) (3) (4) (5) (6) (7) (8)
1 Jahe / Ginger 0,41 0,65 50,02 12400,00 18750,00 65,29
2 Laos / Galangal 1,13 1,86 172,80 1200,00 32800,00 114,55
3 Kencur /Aromatic Ginger 0,52 1,16 26,88 100,00 9850,00 22,66
4 Kunyit / Turmeric 0,68 1,04 22,12 250,00 4500,00 12,60
5 Lempuyang /Zingiber Aromaticum 0,44 0,38 10,35 250,00 2750,00 6,33
6 Temulawak / Curcuma 0,91 1,01 20,60 0,00 7937,00 174,61
7 Temuireng /Curcuma aeruginosa 0,32 0,15 5,28 0,00 701,00 1,68
8 Kapulaga / Capollaga 0,02 0,11 3,76 750,00 6610,00 9,92
9 Kejibeling / Strobilanthes 0,25 0,20 39,00 0,00 17400,00 34,80
10 Mengkudu / Pace 0,14 0,00 126,02 0,00 8231,00 143,50
11 Temukunci /Fingerroots 0,23 0,25 6,32 0,00 2375,00 5,23
12 Sambiloto /Green chiretta 0,38 0,36 9,46 1500,00 1800,00 3,60
13 Lidah buaya /Aloe vera 1,85 3,12 78,71 3650,00 31950,00 86,27
Sumber : Dinas Pertanian Kota Bogor No
Luas Panen/ Harvested
Produksi/ Production
(ton)
Luas Tanam/
Area Luas Panen/ Harvested
Produksi/ Production
(ton) Luas Tanam, Luas Panen dan Produksi Tanaman Obat-obatan menurut Jenis Tanaman
2011 2012
Luas Tanam/
Area
(2) Jenis Tanaman/Type plant
Tabel 5.13
Table Number of Farmer Groups by Subdistricts in Bogor Municipality 2012
(1) (3) (4) (5) (6) (7) (8)
010 Bogor Selatan 13 357 29 777 5 94
020 Bogor Timur 7 199 9 308 0 0
030 Bogor Utara 8 174 10 203 0 0
040 Bogor Tengah 9 185 5 115 0 0
050 Bogor Barat 10 120 19 508 1 27
060 Tanah Sareal 7 136 9 247 0 0
Jumlah/Total 2012 54 1 171 81 2 158 6 121
2011 54 1 271 81 2 158 6 121 (2)
Banyaknya Kelompok Tani di Kota Bogor Menurut Kecamatan
No Kecamatan/ Subdistricts
Wanita Tani/ Women farmer
Tani Dewasa/Mature farm
Taruna Tani/ Cadets farm Kelompok
Tani/ Farmer groups
Anggota/ Member
Kelompok Tani/Farme r groups
Anggota/ Member
Kelompok Tani/Farmer
groups
236
Kota Bogor Dalam Angka/
Bogor City in Figures
2012
238
Kota Bogor Dalam Angka/
Bogor City in Figures
2012
Tabel 5.14
Table
Population of Livestock and Poultry by Subdistricts in Bogor Municipality
2012
(1)
(3)
(4)
(5)
(6)
(7)
(8)
(3)
(4)
(5)
(6)
010
Bogor Selatan
266
2
92 26 652 4 977 52 980
0 118 350 1 093
020
Bogor Timur
2
9
12
0
97
253 15 862
408
0 223
030
Bogor Utara
13 15
0
0
96 1 332 29 699
0 18 900 449
040
Bogor Tengah
6 51
0
0
0
36 15 485
0
0 399
050
Bogor Barat
34 13
56 16 214 1 180 52 543
0 17 000 973
060
Tanah Sareal
536 132
27 34 104 1 170 35 321
0 26 000 446
Jumlah/Total
2012
857 222 187 76 1 163 8 948 201 890
408 180 250 3 583
2011
833 331 202 90 2 111 11 107 231 441
600 218 500 1 512
Sumber : Dinas Pertanian Kota Bogor
Source : Agriculture Service of Bogor Municipality
Kerbau/
Buffalo
Kuda/
Horse
Kambin
g/
Goat
Domba/
Sheep
Ayam
Kampung/
Local hen
Ayam Ras
Petelur/
L
aying
chiken
Ayam Ras
Pedaging/
Broiler
Populasi Ternak dan Unggas Menurut Kecamatan
(2)
No
Kecamatan/
Subdistricts
Sapi
Perah/
Dairy
cow
Sapi
Potong
/
Cattle
cow
Itik/
Ducks
Tabel 5.12Table The Number of Ornamental Plants, Planted, Harvested and Production of Ornamental Plants in Bogor Municipality
2012
(1) (3) (4) (5) (6) (7) (8)
1 Anggrek/Orchid 6000 8400 100800Tangkai/stalk 4450 37350 448200 2 Anthurium/ 6000 11300 113000Tangkai/stalk 1600 7300 73000 3 Anyelir/ Carnatin 0 0 0Tangkai/stalk 0 12494 174916 4 Gerbera (Herbas)/ 3500 0 0Tangkai/stalk 0 11990 179850 5 Gladiol/Gladiole 18800 27700 414500Tangkai/stalk 6050 29510 442650 6 Heliconia/Heliconia 4150 1100 13200Tangkai/stalk 200 24650 295800 7 Krisan / 0 0 0Tangkai/stalk 0 7868 251776 8 Mawar / Rose 2400 3000 33000Tangkai/stalk 550 26850 295350 9 Sedap Malam/ Tuberose 3750 2850 22800Tangkai/stalk 500 20100 241200 10 Dracaena / 0 0 77000pohon/tree 0 16500 330000 11 Melati / Jasmine 0 0 3040Kg 0 10170 193230 12 Palem / Palm 0 0 773pohon/tree 0 1750 2625
13 Aglonema / 0 0 124000pohon/tree 50 0 0
14 Adenium / 0 0 160000pohon/tree 0 900 22500 15 Euphorbia / 0 0 68750pohon/tree 0 3200 80000 16 Phylodendron/ 0 0 812500pohon/tree 2700 8620 215500 17 Pakis / 0 0 12875pohon/tree 0 1700 42500 18 Montera / 0 0 25000pohon/tree 0 3700 9250 19 Soka (ixora)/ 0 0 37500pohon/tree 0 3600 90000 20 Cordyline / 75000 76000 760000pohon/tree 8300 90800 908000 21 Diffenbahia / 1450 1400 35000pohon/tree 400 2750 68750 22 Sansiviera/ 15675 23600 377600Rmpun/clump 4950 31685 506960 23 Anthurium Daun/ 5625 2200 52800pohon/tree 650 4450 106800 24 Caladium/ 3125 0 0pohon/tree 0 3310 52960
Sumber : Dinas Pertanian Kota Bogor Source : Department of Agriculture of Bogor City
Satuan Pproduksi/ Production
unit
Banyaknya Tanaman Hias yang Ditanam, Dipanen dan Produksi Tanaman Hias di Kota Bogor
No Jenis Tanaman/Type Plant 2011 2012 Luas Tanam/ Area Luas Panen/ Harvested Produksi/ Production Luas Tanam/ Area Luas Panen/ Harveste Produksi/ Production (2) Tabel 5.14
Table Population of Livestock and Poultry by Subdistricts in Bogor Municipality 2012
(1) (3) (4) (5) (6) (7) (8) (3) (4) (5) (6)
010 Bogor Selatan 266 2 92 26 652 4 977 52 980 0 118 350 1 093
020 Bogor Timur 2 9 12 0 97 253 15 862 408 0 223
030 Bogor Utara 13 15 0 0 96 1 332 29 699 0 18 900 449
040 Bogor Tengah 6 51 0 0 0 36 15 485 0 0 399
050 Bogor Barat 34 13 56 16 214 1 180 52 543 0 17 000 973
060 Tanah Sareal 536 132 27 34 104 1 170 35 321 0 26 000 446
Jumlah/Total 2012 857 222 187 76 1 163 8 948 201 890 408 180 250 3 583
2011 833 331 202 90 2 111 11 107 231 441 600 218 500 1 512
Sumber : Dinas Pertanian Kota Bogor Source : Department of Agriculture of Bogor City
Itik/ Ducks Populasi Ternak dan Unggas Menurut Kecamatan
Tabel 5.15
Banyaknya Rumahtangga Pemelihara Ternak dan Unggas Menurut Kecamatan
Table
Number of Households Keepers Livestock and Poultry by Subdistricts
2012
(1)
(3)
(4)
(5)
(6)
(7)
(8)
(9)
(10)
(11)
010 Bogor Selatan
42
37
0
116
837
1 424
3
22 332
020 Bogor Timur
3
3
0
4
30
510
0
0
95
030 Bogor Utara
6
0
0
6
32
275
0
1
63
040 Bogor Tengah
1
0
0
0
1
523
0
0 176
050 Bogor Barat
15
31
0
28
108
3 327
0
24 224
060 Tanah Sareal
62
13
6
9
82
596
0
4
96
Jumlah/Total
2012 129
84
6
163 1 090
6.655
3
51 986
2011 331 202 90 2 111 11 107
231.441
600 218.500 1 512
Sumber : Dinas Pertanian Kota Bogor
(2)
No
Kecamatan/
Subdistricts
Sapi
Potong
/
Cattle
cow
Kerbau/
Buffalo
Kuda/
Horse
Kambing/
Goat
Domba/
Sheep
Ayam Ras
Petelur/
Laying
chiken
Ayam Ras
Pedaging/
Broiler
Itik/
Ducks
Ayam
Kampung/
Local hen
Tabel 5.17
Banyaknya Ternak yang Dipotong di Kota Bogor Menurut Jenis Ternak
Table
Number of Cattle Slaughtered in The City of Bogor by Type of Livestock
2012
(1)
(3)
(4)
(5)
(6)
(7)
(8)
1
Januari/
January
1 096
0
0
5
10
0
2
Pebruari /
February
907
0
0
16
24
0
3
Maret /
March
980
0
0
10
15
0
4
April /
April
704
0
0
10
15
0
5
M e I /
M a y
862
0
0
10
15
0
6
Juni /
June
992
0
0
10
15
0
7
Juli /
July
1 266
0
0
20
40
0
8
Agustus /
August
1 845
0
0
10
15
0
9
September/
September
1 065
0
0
10
15
0
10
Oktober /
October
2 962
55
0
982
6 632
0
11
Nopember/
November
1 005
0
0
20
30
0
12
Desember/
December
969
0
0
20
30
0
Jumlah/Total
2012
14 653
55
0
1 123
6 856
0
2011
16 943
10
0
3 021
22 655
0
No
(2)
Sapi /
Cow
Kerbau /
Buffalo
Kuda/
Horse
Kambing /
Goat
Domba/
Sheep
Babi /
Pig
240
Kota Bogor Dalam Angka/
Bogor City in Figures
2012
242
Kota Bogor Dalam Angka/
Bogor City in Figures
2012
Tabel 5.18
Produksi Daging dan Kulit Menurut Jenis Ternak
Table
Production of Meat and Leather by Type of Livestock
2012
(1)
(3)
(4)
(5)
(6)
(7)
(8)
(9)
(10)
(11)
1 Januari/
January
224 680
0
62
111
0
1 096
0
5
10
2 Pebruari /
February
185 935
0
199
265
0
907
0
16
24
3 Maret /
March
200 900
0
124
166
0
980
0
10
15
4 April /
April
144 320
0
124
166
0
704
0
10
15
5 M e I /
M a y
176 710
0
124
166
0
862
0
10
15
6 Juni /
June
203 360
0
124
166
0
992
0
10
15
7 Juli /
July
259 530
0
249
442
0
1 266
0
20
40
8 Agustus /
August
378 225
0
124
166
0
1 845
0
10
15
9 September/
September
218 325
0
124
166
0
1 065
0
10
15
10 Oktober /
October
607 210
9 146
12 214
73 347
0
2 962
55
982
6 632
11 Nopember/
November
206 025
0
249
332
0
1 005
0
20
30
12 Desember/
December
198 645
0
249
332
0
969
0
20
30
Jumlah/
Total
2012 2 805 220
9 146
13 719
75 493
0
13 684
55
1 103
6 826
2011 4 884 745
34 974
139 798
200 100
Sumber : Dinas Pertanian Kota Bogor
Source : Department of Agriculture of Bogor City
Kulit /
Leather
(2)
Bulan/
Month
Daging/
Meat
No
Kerbau /
Buffalo
Kambing /
Goat
Domba/
Sheep
Babi/
Pig
Sapi /
Cow
Kerbau /
Buffalo
Kambing
/
Goat
Domba/
Sheep
Sapi /
Cow
Tabel 5.16 Banyaknya Ternak yang Masuk dan Keluar dari Kota Bogor Menurut Jenis Ternak Table Number of Livestock In and Out of The City of Bogor by Type of Livestock
2012
(1) (3) (4) (5) (6) (7) (8) (9) (10) (11) (12)
1 Januari/January 1 139 0 35 65 0 10 0 30 55 0
2 Pebruari / February 942 0 60 90 0 15 0 44 66 0
3 Maret / March 1 037 0 50 75 0 15 0 40 60 0
4 April / April 715 0 60 90 0 10 0 50 75 0
5 M e I / M a y 833 0 100 150 0 20 0 90 135 0
6 Juni / June 1 027 0 90 135 0 25 0 80 120 0
7 Juli / July 1 329 0 110 165 0 20 0 90 125 0
8 Agustus / August 1 948 0 100 150 0 15 0 90 135 0
9 September/September 1 030 0 90 135 0 20 0 80 120 0
10 Oktober / October 1 318 0 140 210 0 202 0 130 195 0
11 Nopember/November 1 045 0 50 75 0 5 0 30 45 0
12 Desember/December 971 0 60 90 0 10 0 40 60 0
Jumlah/Total 2012 13 334 0 945 1 430 0 367 0 794 1 191 0 2011 15 787 0 727 1 463 0 537 0 567 1 208 0
Sumber : Dinas Pertanian Kota Bogor Source : Department of Agriculture of Bogor City
(2)
Kambing / Goat
Babi / Pig
Sapi / Cow
Kerbau / Buffalo
Kambing / Goat
Babi / Pig Domba/
Sheep
Domba/ Sheep
Masuk/In Keluar/Out
No Bulan/Month Sapi /
Pertanian
/Agriculture
Tabel 5.19
Hasil Pemeriksaan Susu di Laboratorium
Table
Results in the Laboratory Examination of Milk
2012
(1)
(4)
(5)
(6)
(7)
(8)
(9)
1
Januari/
January
4
3
1
-
-
-
-2
Pebruari /
February
6
4
-
-
2
-
-3
Maret /
March
6
3
-
-
2
-
-4
April /
April
6
4
1
-
2
-
-5
M e I /
M a y
8
4
-
-
4
-
-6
Juni /
June
8
4
-
-
4
-
-7
Juli /
July
12
6
2
-
4
-
-8
Agustus /
August
14
6
2
-
6
-
-9
September/
September
12
7
1
-
4
-
-10
Oktober /
October
8
3
1
-
4
-
-11
Nopember/
November
6
4
-
-
2
-
-12
Desember/
December
6
3
1
-
2
-
-Jumlah/Total
2012
96
51
9
-
36
-
-2011
36
12
-
-
22
1
1
No
Bulan/
Month
(2)
Jumlah contoh
yang diperiksa /
Number of
samples
examined
Baik/
Good
Cukup/
Enough
Buruk/
Bad
Susunan Air Susu/
Composition of breast milk
Kondisi Air
Susu/
Conditions of milk
Baik/
Good
Cukup/
Enoug
Buruk/
Bad
Hasil Pemeriksaan/
Examination results
(3)
Tabel 5.21 Banyaknya Vaksinasi/Pencegahan Penyakit Ternak/Unggas Menurut Jenis Vaksin Table Number of Vaccination/Disease Prevention of Livestock/Poultry by Type of Vaccine
2012
(1) (2) (3) (4) (5)
1 Januari/January 0 0 0 0
2 Pebruari / February 0 0 0 0
3 Maret / March 0 1000 0 40.000
4 April / April 0 2.430 0 30.000
5 M e I / M a y 0 393 0 30.000
6 Juni / June 0 558 0 0
7 Juli / July 0 0 0 0
8 Agustus / August 0 1000 0 0
9 September/September 0 1.619 0 40.000
10 Oktober / October 0 0 0 37.000
11 Nopember/November 0 0 0 37.000
12 Desember/December 0 0 0 0
Jumlah/Total 2012 0 7.000 0 214.000
2011 0 1.000 0 100.000
Sumber : Dinas Pertanian Kota Bogor No Bulan/Month
(2)
Vaksin/Pencegahan Penyakit / Vaccine / Disease Prevention
ND / Newcastle
Diseases
AI /Avian Influenza ANTHRAX
SE/ Septicaemia
244
Kota Bogor Dalam Angka/
Bogor City in Figures
2012
246
Kota Bogor Dalam Angka/
Bogor City in Figures
2012
Tabel 5.20 Jumlah Orang yang Digigit Anjing, Banyaknya Pengamatan Terhadap Anjing yang Menggigit dan Vaksinasi Table serta Eliminasi Rabies per Bulan di Kota Bogor / Number of People Bitten by Dogs, Many Observations of
The Dog Bite and Rabies Vaccination and Elimination per Month in Bogor Municipality 2012
(1) (3) (4) (5) (6) (7) (8)
1 Januari/January - - - - - 3
-2 Pebruari / February - - - - - 0
-3 Maret / March - - - - - 114
-4 April / April - - - - - 93
-5 M e I / M a y - - - - - 111
-6 Juni / June - - - - - 95
-7 Juli / July - - - - - 93
-8 Agustus / August - - - - - 114
-9 September/September - - - - - 112
-10 Oktober / October 1 - - 1 1 93 -11 Nopember/November - - - - - 60
-12 Desember/December - - - - - 115
-Jumlah/Total 2012 1 0 0 1 1 1.003 0
2011 0 0 0 0 0 556 0
Sumber : Dinas Pertanian Kota Bogor Source : Department of Agriculture of Bogor City
(2)
Jumlah Orang yang Digigit/
Number of people bitten
(2)
Tanpa observasi/
Without observation Mati/
dead
Bebas/ Free
Anjing Yang Menggigit/Tersangka / Dogs that bite / suspect
Observasi/ Observation Jumlah/ Number No Bulan/Month
Vaksinasi/ Vaccina
tion
Eliminasi/ Eliminati
on
Tabel
5.22
Banyaknya Rumahtangga Petani, Luas dan Produksi Ikan Kolam Air Tenang
Table
The Number of Farm Households, Spacious and Calm Water Pond Fish Production
2012
(1)
010
Bogor Selatan
240
29.040
362,50
020
Bogor Timur
87
36.960
461,30
030
Bogor Utara
138
44.880
593,10
040
Bogor Tengah
12
5.280
65,90
050
Bogor Barat
86
26.400
329,50
060
Tanah Sareal
97
121.440
1.482,80
Jumlah/Total
2012
660
264.000
3.295,10
2011
660
264.000
3.012,80
Sumber : Dinas Pertanian Kota Bogor
Source : Department of Agriculture of Bogor City
No
Kecamatan/
Subdistricts
Rumahtangga
Petani Ikan /
Fish
farmer households
Luas Areal (m2)/
Total area
Produksi (Ton)/
Production
Tabel
5.23
Banyaknya Rumahtangga Petani, Luas dan Produksi Ikan Kolam Air Deras
Table
Number of Farm Household, Widespread and The Productionof Heavy Water Fish Pond
2012
(1)
010
Bogor Selatan
-
-
64,13
020
Bogor Timur
40
66.420
81,62
030
Bogor Utara
-
-
104,90
040
Bogor Tengah
-
-
11,66
050
Bogor Barat
-
-
58,30
060
Tanah Sareal
-
-
262,35
Jumlah/Total
2012
40
66.420
582,96
2011
40
66.420
518,83
Sumber : Dinas Pertanian Kota Bogor
(2)
Rumahtangga Petani
Ikan /
Fish farmer
households
Luas Areal (m2)/
Total area
Produksi (Ton)/
Production
(2)
(3)
(4)
No
Kecamatan/
Subdistricts
Tabel
5.25
Banyaknya Rumahtangga Petani Ikan (karamba), Luas Areal dan Produksi Ikan
Table
Number of Farmer Households of Fish Cage , Acreage and The Production of Fish
2012
(1)
010
Bogor Selatan
15
432
2,66
020
Bogor Timur
-
-
3,39
030
Bogor Utara
35
348
4,36
040
Bogor Tengah
60
396
0,48
050
Bogor Barat
10
24
2,42
060
Tanah Sareal
-
-
10,89
Jumlah/Total
2012
120
1.200
24,20
2011
120
1.200
22,70
Sumber : Dinas Pertanian Kota Bogor
Kecamatan/
Subdistricts
(2)
Rumahtangga
Petani Ikan /
Fish
farmer households
Luas Areal (m
2)/
Total area
Produksi (Ton)/
Production
(2)
(3)
(4)
248
Kota Bogor Dalam Angka/
Bogor City in Figures
2012
250
Kota Bogor Dalam Angka/
Bogor City in Figures
2012
0,00
100,00
200,00
300,00
400,00
500,00
600,00
700,00
800,00
900,00
1 000,00
3 1 0 ,0 0 3 4 5 ,0 0 1 4 4 ,0 0 3 9 1 ,0 0 9 7 9 ,0 0 5 8 8 ,0 0 7 0 2 ,0 0 5 1 1 ,5 0 9 9 ,0 0 7 8 ,0 0 4 8 0 ,0 0 9 0 ,0 0 3 4 6 ,9 0 3 2 2 ,9 0 1 1 4 ,0 0 4 8 4 ,5 0 9 3 5 ,0 0 6 1 9 ,5 0 5 9 4 ,0 0 6 9 7 ,5 0 1 6 2 ,0 0 1 0 2 ,0 0 6 1 2 ,0 0 1 2 6 ,0 02011
2012
Gambar/
Picture
5.1
Produksi Sayuran di Kota Bogor
Tahun 2011-2012
Tabel
5.24
Banyaknya Rumahtangga Petani Ikan Sawah, Luas Areal dan Produksi Ikan
Table
Number of Households in Rice Field Fish Farmer , Acreage and The Production of Fish
2012
(1)
010
Bogor Selatan
15
360
2,05
020
Bogor Timur
-
420
2,60
030
Bogor Utara
35
-3,35
040
Bogor Tengah
60
-
0,37
050
Bogor Barat
10
156
1,86
060
Tanah Sareal
-
264
8,37
Jumlah/Total
2012
120
1.200
18,60
2011
120
1.200
17,40
Sumber : Dinas Pertanian Kota Bogor
Source : Department of Agriculture of Bogor City
No
Kecamatan/
Subdistricts
(2)
Rumahtangga
Petani Ikan /
Fish
farmer households
Luas Areal (m2)/
Total area
Produksi (Ton)/
Production
PERINDUSTRIAN DAN PERDAGANGAN
Perusahaan industri di Kota Bogor yang mempunyai nilai
investasi terbesar tahun 2012 adalah industri tekstil kategori
industri besar dan menengah yang mencapai 28,74 persen dari
total investasi sebesar 746,65 milyar rupiah, diikuti oleh
industri minuman kategori industri besar dan menengah yang
mencapai 15,72 persen terhadap total investasi . Demikian pula
dalam penyerapan tenaga kerja, perusahaan industri tekstil
kategori besar dan menengah memberikan peranan yang
terbesar yaitu sebesar 37,65 persen. Namun perusahaan
industri yang paling banyak unit usahanya adalah jenis industri
makanan kategori industri kecil informal yaitu sebanyak 1.116
unit (31,30 persen).
Perdagangan, perusahaan perdagangan di Kota Bogor
dari tahun ke tahun semakin bertambah. Dari segi kuantitas,
Usaha Perdagangan Kecil sampai dengan tahun 2012 masih
mendominasi sektor perdagangan Kota Bogor. Pada tahun
2012, banyaknya perusahaan perdagangan kecil mencapai
8.216 pengusaha (83,02 persen).
Pada 2011 perusahaan yang terdaftar terdapat 1.366
dan pada 2012 hanya 1.288 perusahaan. Yang terbanyak
mendaftar adalah perusahaan perorangan yaitu sebanyak 605
(46,97 persen) dan perusahaan komanditer (CV) sebanyak 458
(35,56 persen).
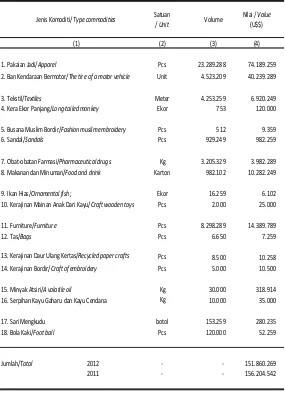
Nilai ekspor non migas Kota Bogor tahun 2012
mengalami penurunan 2,78 persen dibanding tahun 2011. Jenis
komoditas yang paling banyak diekspor adalah pakaian jadi
dengan nilai ekspor sebesar 74,2 juta US Dolar. Terbesar kedua
adalah ekspor ban kendaraan bermotor dengan nilai ekspor
40,24 juta US Dolar.
252
Kota Bogor Dalam Angka/
Bogor City in Figures
2012
254
Kota Bogor Dalam Angka/
Bogor City in Figures
2012
INDUSTRY AND TRADE
Industrial enterprises in Bogor which has a value of 2012
is the biggest investment of the textile industry of large and
medium industry category which reached 28.74 percent of the
total investment of 746.65 billion dollars , followed by the
bev-erage industry category of large and medium industries which
reached 15.72 percent of the total investment . Similarly, in
em-ployment , the textile industry enterprises large and medium
categories provide the greatest role in the amount of 37.65
per-cent . However, most industrial enterprises business unit is the
type of industry categories of the food industry as many as
1,116 small informal units ( 31.30 per cent ) .
Trade , trading company in Bogor from year to year
in-crease. In terms of quantity , Small Trade Business until 2012
still dominates trade Bogor . In 2012 , the number of small
trad-ing companies reached 8,216 entrepreneurs ( 83.02 percent ) .
In 2011 there were 1,366 listed companies and in 2012
only 1,288 companies . Most companies that are registered as
many as 605 individuals ( 46.97 percent ) and company limited
partnership ( CV ) of 458 ( 35.56 percent ) .
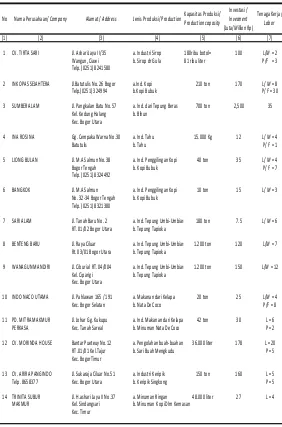
Tabel/ 6.3 Lokasi Perusahaan Industri Makanan dan Minuman di Kota Bogor/
Table Company Location Food and Beverages industry in Bogor Municipality
2012
(1) (3) (4) (5) (6) (7)
1 CV. TIRTA SARI Jl. Ashari Jaya II/35 a. Industri Sirop 180ribu botol= 100 L/M = 2
Wangun, Ciawi b. Sirop dr Gula 81 ribu liter P/F = 3
Telp. (0251) 8241580
2 INKOPAS SEJAHTERA Jl.Batutulis No. 26 Bogor a.Ind. Kopi 210 ton 170 L/ M = 8
Telp.(0251) 324994 b.Kopi Bubuk P/ F = 30
3 SUMBER ALAM Jl. Pangkalan Batu No. 57 a. Ind. dari Tepung Beras 700 ton 2,500 35
Kel. Kedung Halang b. Bihun Kec. Bogor Utara
4 INA ROSINA Gg. Cempaka Warna No.30 a. Ind. Tahu 15.000 Kg 12 L/ M = 4
Batutulis b. Tahu P/ F = 1
5 LIONG BULAN Jl. M.A Salmun No. 38 a. Ind. Penggilingan Kopi 40 ton 35 L/ M = 4
Bogor Tengah b. Kopi Bubuk P/ F = 7
Telp. (0251) 8324492
6 BANGKOK Jl. M.A Salmun a. Ind. Penggilingan Kopi 10 ton 15 L/ M = 3
No. 32-34 Bogor Tengah b. Kopi Bubuk Telp. (0251) 8321380
7 SARI ALAM Jl. Tanah Baru No. 2 a. Ind. Tepung Umbi-Umbian 180 ton 7.5 L/ M = 6
RT. 01/02 Bogor Utara b. Tepung Tapioka
8 BENTENG BARU Jl. Raya Ciluar a. Ind. Tepung Umbi-Umbian 1.200 ton 120 L/M = 7
Rt. 03/01 Bogor Utara b. Tepung Tapioka
9 WANAGUN MANDIRI Jl. Ciburial RT. 04/004 a. Ind. Tepung Umbi-Umbian 1.200 ton 150 L/M = 12 Kel. Ciparigi b. Tepung Tapioka
Kec. Bogor Utara
10 INDO NACO UTAMA Jl. Pahlawan 165 / 191 a. Makanan dari Kelapa 20 ton 25 L/M = 4
Kec. Bogor Selatan b. Nata De Coco P/F = 8
11 PD. MITRA MAKMUR Jl. Johar Gg. Kukupu a. Ind. Makanan dari Kelapa 42 ton 30 L = 6
PERKASA Kec. Tanah Sareal b. Minuman Nata De Coco P = 2
12 CV. MORINDA HOUSE Bantar Pueteuy No.12 a. Pengolahan buah-buahan 36.000 liter 178 L = 20
RT .01/01 Kel.Tajur b. Sari Buah Mengkudu P = 5
Kec. BogorTimur
13 CV. ARIRA PANGINDO Jl. Sukaraja Ciluar No.51 a. Industri Keripik 150 ton 160 L = 5
Telp. 8658377 Kec. Bogor Utara b. Keripik Singkong P = 5
14 TRINITA SUBUR Jl. H.ashari Jaya II No.37 a. Minuman Ringan 48.000 liter 27 L = 4
MAKMUR Kel. Sindangsari b. Minuman Kopi Dlm Kemasan
Kec. Timur
Tenaga Kerja /
Labor
(2)
No Nama Perusahaan/ Company Alamat / Address Jenis Produksi/ ProductionKapasitas Produksi/ Production capasity
Investasi /
Invesment
(Juta/Million Rp)
Tabel 6.1 Potensi Industri Kimia, Agro, dan Hasil Hutan di Kota Bogor Table Potential Industrial Chemicals, Agro and Forrest Product in Bogor City
2012
(2) (3) (4)
I. Industri Besar dan Menengah / Large and Medium Industries 8.529 89 321.165.870.635
I.1. Makanan / Food 1.552 25 34.298.104.400
I.2. Minuman / Beverages 1.885 15 117.374.061.278 I.3. Kayu Olahan dan Rotan / Processed wood and rattan 2.362 13 31.103.084.707 I.4. Pulp dan Kertas / Pulp and paper 686 13 68.258.216.000 I.5. Bahan Kimia Industri dan Karet / Chemicals and rubber industries 753 12 18.322.491.000 I.6. Bahan Galian Non Logam / Minerals and metals 65 2 5.391.500.000 I.7. Kimia / Chemicals 1.226 9 46.418.413.250
II. Industri Kecil Formal / Formal Small Industries 6.387 737 41.499.437.824
II.1. Makanan / Food 2.361 278 12.549.921.500 II.2. Minuman / Beverages 598 85 4.188.834.500 II.3. Kayu Olahan dan Rotan / Processed wood and rattan 1.125 124 3.743.160.000
II.4. Pulp dan Kertas / Pulp and paper 707 106 8.705.709.000 II.5. Bahan Kimia Industri dan Karet / Chemicals and rubber industries 174 25 4.654.873.974 II.6. Bahan Galian Non Logam / Minerals and metals 823 37 2.323.400.000 II.7. Kimia / Chemicals 599 82 5.333.538.850
III. Industri Kecil Informal / Informal Small Industries 6.838 1.546 2.358.183.900
III.1. Makanan / Food 5.054 1.116 1.242.947.638 III.2. Minuman / Beverages 968 228 306.507.925 III.3. Kayu Olahan dan Rotan / Processed wood and rattan 355 84 321.959.872 III.4. Pulp dan Kertas / Pulp and paper 132 47 84.291.720
III.5. Bahan Kimia Industri dan Karet / Chemicals and rubber industries - - III.6. Bahan Galian Non Logam / Minerals and metals 198 36 288.650.000 III.7. Kimia / Chemicals 131 35 113.826.745
Jumlah/ Total 2012 21.754 2.372 365.023.492.359 2011 21.181 2.294 352.075.487.659 Jenis Usaha/Type of industrial enterprises Tenaga Kerja /
Labor
Unit Usaha/ Industrial business unit
Nilai Investasi/Value
Investing (Rp)
256
Kota Bogor Dalam Angka/
Bogor City in Figures
2012
258
Kota Bogor Dalam Angka/
Bogor City in Figures
2012
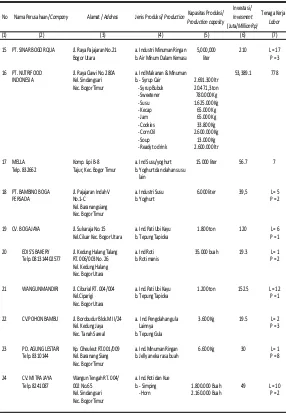
Tabel/ 6.3 LANJUTAN
Table Continued
(1) (3) (4) (5) (6) (7)
15 PT. SINAR BOGOR QUA Jl. Raya Pajajaran No.21 a. Industri Minuman Ringan 5,000,000 210 L = 17
Bogor Utara b. Air Minum Dalam Kemasan liter P = 3
16 PT. NUTRIFOOD Jl. Raya Ciawi No. 280A a. Ind Makanan & Minuman 53,389.1 778
INDONESIA Kel. Sindangsari b. - Syrup Cair 2.691.300 ltr
Kec. Bogor Timur - Syrup Bubuk 20.471,3 ton
- Sweetener 780.000 Kg
- Susu 1.625.000 Kg
- Kecap 65.000 Kg
- Jam 65.000 Kg
- Cookies 33.800 Kg
- Corn Oil 2.600.000 Kg
- Soup 13.000 Kg
- Ready to drink 2.600.000 ltr
17 MELLA Komp. Lipi B-8 a. Ind Susu/yoghurt 15.000 liter 56.7 7
Telp. 832662 Tajur, Kec. Bogor Timur b. Yoghurt dan olahan susu lain
18 PT. BAMBINO BOGA Jl. Pajajaran Indah V a. Industri Susu 6.000 liter 39,5 L = 5
PERSADA No.1-C b. Yoghurt P = 2
Kel. Baranangsiang Kec. Bogor Timur
19 CV. BOGA JAYA Jl. Sukaraja No.15 a. Ind.Pati Ubi Kayu 1.800 ton 120 L = 6
Kel.Ciluar Kec. Bogor Utara b. Tepung Tapioka P = 1
20 EDIS'S BAKERY Jl. Kedung Halang Talang a. Ind Roti 35.000 buah 19.3 L = 1
Telp. 081314402577 RT. 006/003 No. 26 b. Roti manis P = 2
Kel. Kedung Halang Kec. Bogor Utara
21 WANGUN MANDIRI Jl. Ciburial RT. 004/004 a. Ind.Pati Ubi Kayu 1.200 ton 152.5 L = 12
Kel.Ciparigi b. Tepung Tapioka P = 1
Kec. Bogor Utara
22 CV.POHON BAMBU Jl. Borobudur Blok.M II/24 a. Ind.Pengolahan gula 3.600 Kg 19.5 L = 2
Kel. Kedung Jaya Lainnya P = 3
Kec. Tanah Sareal b. Tepung Gula
23 PD. AGUNG LESTARI Kp. Ciheuleut RT.001/009 a. Ind.Minuman Ringan 6.600 Kg 30 L = 1
Telp. 8310144 Kel. Baranang Siang b. Jelly aneka rasa buah P = 8
Kec. Bogor Timur
24 CV. MITRA JAYA Wangun Tengah RT. 004/ a. Ind.Roti dan Kue
Telp. 8241087 002 No.65 b. - Simping 1.800.000 Buah 49 L = 10
Kel. Sindangsari - Horn 2.160.000 Buah P = 2
Kec. Bogor Timur (2)
No Nama Perusahaan/ Company Alamat / Address Jenis Produksi/ Production Kapasitas Produksi/ Production capasity
Investasi /
Invesment
(Juta/Million Rp)
Tenaga Kerja /
Labor
Tabel 6.2 Potensi Industri Logam, Mesin, Elektronika, dan Aneka di Kota Bogor/ Table Potential of Metal, Machinery, Electronics and Micellaneous in Bogor City
2012
(2) (3) (4)
I. Industri Besar dan Menengah/Large and medium industries 58 25.899 348.891.854.450
I.1. Mesin & Rekayasa / Machinery & Engineering 1 180 6.528.785.950
I.2. Logam / Metal 12 1.966 23.727.455.000 I.3. Alat Angkut / Transport equipment 10 946 47.074.870.000 I.4. Industri Tekstil / Textile industry 28 21.769 214.581.540.000 I.5. Industri Kulit / Leather industry 2 68 6.202.000.000 I.6. Industri Alpora / Alpora industry 1 300 3.652.152.000 I.7. Industri Elektronika / electronics industry 4 670 47.125.051.500
II. Industri Kecil Formal / Formal small industries 343 7.285 28.027.943.250
II.1. Mesin & Rekayasa / Machinery & Engineering 6 211 1.636.560.000 II.2. Logam / Metal 93 874 12.245.499.600 II.3. Alat Angkut / Transport equipment 54 1.082 4.256.346.000
II.4. Industri Tekstil / Textile industry 91 3.196 6.051.918.650 II.5. Industri Kulit / Leather industry 75 1.695 2.608.630.000 II.6. Industri Alpora / Alpora industry 15 180 917.620.000 II.7. Industri Elektronika / electronics industry 9 47 311.369.000
III. Industri Kecil Non Formal / Informal Small industries 792 2.882 4.707.764.600
III.1. Mesin & Rekayasa / Machinery & Engineering - - III.2. Logam / Metal 168 417 442.158.600 III.3. Alat Angkut / Transport equipment 65 184 346.060.000 III.4. Industri Tekstil / Textile industry 160 684 424.700.900
III.5. Industri Kulit / Leather industry 337 1.335 3.256.139.200 III.6. Industri Alpora / Alpora industry 18 49 60.138.700 III.7. Industri Elektronika / electronics industry 44 213 178.567.200
Jumlah/ Total 2012 1.193 36.066 381.627.562.300 2011 1.183 36.035 369.980.174.800
Sumber : Dinas Perindustrian dan Perdagangan Kota Bogor Source : Department of Industry and Trade of Bogor City
Jenis Usaha/Type of industrial enterprises
Unit Usaha/ Industrial business unit
Tenaga Kerja / Labor
Nilai Investasi/Value Investing (Rp)
Tabel/ 6.3 LANJUTAN
Table Continued
(1) (3) (4) (5) (6) (7)
25 PT. NUTRIFOOD Jl. Raya Ciawi No.28 0A a. Ind Makanan dan Minuman 53.389,1 778
INDONESIA Kel. Sindangsari b. - Syrup Cair 2.691.300 ltr
Kec. Bogor Timur - Syrup bubuk 20.471,3 ton - Sweetener 780.000 Kg
- Susu 1.625.000 Kg
- Kecap 65.000 Kg
- Jam 65.000 Kg
- Cookies 33.800 Kg
- Corn Oil 2.600.000 Ltr
- Soup 13.000 Kg
- Ready To Drink 2.600.000 Ltr
26 VENUS Jl. Siliwangi No. 27A a. Ind Roti 364.72 L = 6
Kec. Bogor Selatan b. - Roti Manis 1 800.000 Buah P = 5
- Roti Tawar 30.000 Buah
27 BOGOR PERMAI Jl. Jend. Sudirman No.23A a. Ind Roti 359,3 L = 20
Kec. Bogor Tengah b. - Roti Manis 1.000.000 Buah P = 5
- Roti Tawar 80.000 Buah
28 PIALA Jl. Pahlawan No.187 a. Industri Kopi 7.500 Kg 125 L = 8
Kec. Bogor Selatan b. Kopi Bubuk P = 24
29 PT. MUSTIKA CITRA Jl. Raya Pajajaran No.7 a. Industri Roti 46.000 buah 140,4 L = 3
RASA "HOLLAND Bogor Timur b. Roti Manis P = 6
BAKERI"
30 DE PARIS Jl. Suryakencana No.299 a. Industri Roti 120 L = 1
Kec. Bogor Tengah b. - Roti Manis. 252.000 buah P = 8
- Roti Tawar 18.000 buah
31 JUMBO BAKERY Jl.Raya Pajajaran 3P No.8 a. Ind.Roti 80 L = 5
Kec. Bogor Timur b. Roti Manis 90.000 Buah
Roti Tawar 18.000 Buah
32 LIONG BULAN Jl. MA. Salmun No.38 a. Ind.Kopi 40 Ton 40 L = 5
Telp (0251) 321723 Kec. Bogor Tengah b. Kopi Bubuk P = 7
33 MERDEKA Jl.Bangbarung Raya Blok. a. Ind.Roti 175 L = 9
AA-AB No.88 Ruko Villa b. Roti Manis 252.000 Buah P = 5
Indah Pajajaran Roti Tawar 18.000 Buah
Kec. Bogor Tengah
34 PT. ROLIKA Jl.Raya Semplak No.389 a. Makanan 48.000 porsi 2,488 105
CATERING Kec. Bogor Barat b. Jasa Boga
35 SETIA Jl. Pangeran Sogiri 456 a. Pati Ubi Kayu 1.500 Ton 973 L = 26
RT.01/01 b. Tepung Tapioka
Kel. Tanah Baru Kec. Bogor Utara
Investasi /
Invesment
(Juta/Million Rp)
Tenaga Kerja /
Labor
(2)
No Nama Perusahaan/ Company Alamat / Address Jenis Produksi/ ProductionKapasitas Produksi/ Production capasity
Tabel/ 6.3 LANJUTAN
Table Continued
(1) (3) (4) (5) (6) (7)
47 KARTA Jl. Johar IV No.7 a. Ind.Makanan dari Kelapa 240 Ton 197 L = 12
Telp. (0251) 8338244 Taman Ciamanggu b. Nata de Coco P = 8
Kec. Tanah Sareal
48 MELIANA Jl. Kedung Halang RT.01 a. Industri Mie 40 Ton 75 L = 4
RW.02 Kec. Bogor Utara b. Mie Basah P = 4
49 KOPI BOGOR Jl. Kedung Halang Talang a. Industri Kopi 75 Ton 100 L = 6
RT. 01/02 b. Kopi Bubuk P = 95
Kec. Bogoe Utara
50 APOLLO Jl. Ciliwung No.8 a. Ind Mie 180.000 Kg 50 L = 4
RT. 003/01 b. Mie Basah
Kec. Bogor Tengah
51 CV. WANGUN MANDIRI Jl. Ciburial RT.004/004 a. Minuman Ringan 10.000.000 liter 645 20 Kel.Ciparigi Bogor b. AMDK
Kec. Bogor Utara
52 SUMBER ALAM Jl. Pangkalan Batu No.57 a. Industri Bihun 700 Ton 2.500 L = 35
Kel. Kedung Halang b. Bihun Kec. Bogor Utara
53 WAROENG COKLAT Jl.Anggada I No .11 a. Ind Makanan dari Coklat 2.000 Kg 85 L = 3
RT. 04/15 Kel. Bantar Jati b. Permen Coklat P = 4
Kec. Bogor Utara
54 LAKSANA MANDIRI Jl. Arzimar II RT.02/02 a. Ind Tahu 15 Ton 138,5 L = 15
Kel. Tegal Gundil b. Tahu dari Kedelai Kec. Bogor Utara
55 CV. TRI ANGLE BTN Cipaku Indah I a. Ind Makanan dari Kelapa 360.000 Gelas 154 L = 10
RT. 01/011 b. Nata de Coco P = 5
Kel. Cipaku Kec. Bogor Selatan
56 MACARONI PANGGANG Jl. Salak No.24 a. Industri Makaroni 15.000 Loyang 104.2 L = 2
Kec. Bogor Tengah b. Makaroni Panggang P = 6
57 PIA APPLE PIE Jl. Pangrango No.10 a. Ind. Roti 7.500 Loyang 81.5 L = 2
Kec. Bogor Tengah b. Pie Apple P = 4
58 ARIRA PRATAMA Jl. Pahlawan No.78 A a. Ind Pengolahan Kopi 7,5 Ton 25 L = 2
Kec. Bogor Selatan b. Kopi Bubuk P = 5
59 RIFIA Tamansari Persada Blok.G a. Ind. Roti 50.000 Buah 40 L = 5
2/12 A RT. 3/2 Cibadak b. Aneka Roti Kel. Cibadak
Kec. Tanah Sareal (2)
No Nama Perusahaan/ Company Alamat / Address Jenis Produksi/ ProductionKapasitas Produksi/ Production capasity
Investasi /
Invesment
(Juta/Million Rp)
Tenaga Kerja /
260
Kota Bogor Dalam Angka/
Bogor City in Figures
2012
262
Kota Bogor Dalam Angka/
Bogor City in Figures
2012
Tabel/ 6.3 LANJUTAN
Table Continued
(1) (3) (4) (5) (6) (7)
36 MAJU Jl. Raya Kedung Halang a. Ind.Pati Ubi Kayu Ongok = 95 L = 6
No.299 b. Tepung Tapioka 450 ton
Kec. Bogor Utara Sagu = 74 Ton
37 VICTORY Jl. Raya Kedung Halang a. Ind.Pati Ubi Kayu 480 Ton 61 L = 5
No. 241 b. Tepung Tapioka
Kec. Bogor Utara
38 PT. SUMBER JAYA Kp.Babakan RT.01/II a. Ind.Pati Ubi Kayu 100 Ton 124 L = 7
MURNI No. 72 Ciluar b. Tepung Tapioka
Kec. Bogor Utara
39 ALAM SUBUR Jl. Kramat RT.003/01 a. Ind.Pati Ubi Kayu 180 Ton 72 L = 6
Kel. Tanah Baru b. - Tepung Tapioka Kec. Bogor Utara - Tepung Asia
40 SARI ALAM Jl. Tanah Baru No.2 a. Ind.Pati Ubi Kayu 180 Ton 70 L = 6
RT. 01/02 b. - Tepung Tapioka
Kec. Bogor Utara - Tepung Asia
41 SINAR BOGOR Jl. Pajajaran No.21 a. Industri Minuman Ringan 240.000 galon 23.5 L = 2
Kec. Bogor Utara b. Air Minum Destilasi/ Demineralisasi
42 SEGAR Jl. Raya Bogor RT.001/04 a. Industri Minuman Ringan 54.000 Galon 127.6 L = 4
Ruko 5 Kec. Bogor Utara b. Air Minum Destilasi/ Demineralisasi
43 PT. SUPRA SARI Jl. Pembangunan No.5 a. Ind Sirop 157.75 L = 10
LESTARI Kel. Kedung Halang b. Sirop P = 7
Kec. Bogor Utara
44 PT. SUPRA SARI Jl. Pembangunan No.5 a. Ind Kembang Gula 91.9 L = 10
LESTARI Kel. Kedung Halang b. Kembang Gula Serbuk P = 7
Kec. Bogor Utara
45 PT. NUTRIFOOD Jl. Raya Ciawi No. 280A a. Ind Makan dan Minuman
INDONESIA kec. Bogor Timur b. - Susu 3.127 ton 38,265.66
- Cookies 38,2 Ton
- Sweetener 834 Ton
- Ready To Drink 184.760.000 ltr - Syrup Bubuk 6.915,7 ton
- Kecap 25.317 liter
46 UD. FADILAH Jl. Gunung Batu a. Ind.Tahu 10 Ton 20 L = 2
Kel. Pasir Jaya b. Tahu dari Kedelai Kec. Bogor Barat
Kapasitas Produksi/
Production capasity
Investasi /
Invesment
(Juta/Million Rp)
Tenaga Kerja /
Labor
(2)
Nama Perusahaan/ Company Alamat / Address Jenis Produksi/ Production
No Tabel/ 6.3 LANJUTAN
Table Continued
(1) (3) (4) (5) (6) (7)
60 NOORA CAKE Cimanggu Gg.Mantri Guru a. Ind.Roti 30.000 Buah 30 L = 8
RT. 4/1 Kel. Kedung Jaya b. Aneka Roti Kec. Tanah Sareal
61 UD. SAMPURNA Cimanggu Jl. Baru RT. 1/8 a. Ind.Minuman Ringan 9 Ton 66 L = 6
Kel. Kedung Jaya b. Jelly Aneka Rasa Buah P = 9
Kec. Tanah Sareal
62 PD. SUKARAJA Jl. Sukaraja 3/1 a. Tahu 300 Ton 50 L = 4
Kel. Ciluar b. Tahu dari Kedelai Kec. Bogor Utara
63 PT. SUPRA SARI LESTARI Jl. Pembangunan No. 5 a. Ind.Minuman 14.400 Kg - L = 4
RT. 3/5 Kel. Kd.Halang b. Minuman Serbuk Kec. Bogor Utara
64 LOJI WATER Jl. Sindang Barang No. 163 a. Minuman Ringan 1.200 Galon 25 L = 1
Kec. Bogor Barat b. Air Minum Demineralisasi
65 USAHA BERSAMA Jl. MA. Salmun Blok. A a. Daging Olahan 12 ton 15 L = 3
No. 32 Kec. Bogor Tengah b. Bakso Sapi
66 SUKA HATI Jl. MA. Salmun Blok B a. Daging Olahan 6 Ton 50 L = 4
14/13 Kel. Cibogor b. Bakso Sapi P = 1
Kec. Bogor Tengah
67 PT. INDONESIAN MALTOSE Kp. Karang Niaga Cipaku a. Gula Lainnya 1.000 ton 1,100 45
INDUSTRY RT. 1/1 Kel Cipaku b. Glucosa Cair
Kec. Bogor Selatan
68 ELSARI RT. 2/3 Kel. Kebon Pedes a. Roti / Cake 16.800 buah 85 L = 6
Kec. Tanah Sareal b. Brownies P = 4
69 FATIMAH Benda Kaum RT. 002/004 a. Ind Pengeringan Ikan 2.500 Kg -
-Kel. Kedung Waringin b. Ikan yang dikeringkan Kec. Tanah Sareal
70 PT. TRIAS SUKSES Jl. Raya Tajur No. 119 a. Ind Pengolahan & Pengawet 48.000 Liter 490 33
DINAMIKA Kel. Tajur Buah-buahan
Kec. Bogor Timur b. Sari Mengkudu
71 SINAR DARULUNG Jl. Raya Darulung Raya a. Ind Minuman Ringan 7.200 Galon 20 L = 3
No. 2 Bantar Jati b. Air Minum Destilasi/ Kel. Bantar Jati Demineralisasi Kec. Bogor Utara
(2)
No Nama Perusahaan/ Company Alamat / Address Jenis Produksi/ ProductionKapasitas Produksi/ Production capasity
Investasi /
Invesment
(Juta/Million Rp)
Tenaga Kerja /
Perindustrian dan Perdagangan
/Industry and Trade
Tabel/ 6.3 LANJUTAN
Table Continued
(1) (3) (4) (5) (6) (7)
85 KUJANG Kp. Babakan RT. 03/01 a. Industri Roti 1.662.500 Bh 187,5 L = 3
Telp. 0251 - 651166 Kel. Ciluar, Kec. Bogor Utara b. - Roti Manis 17.500 Bh P = 8
- Roti Tawar
86 PT. TRIAS SUKSES Jl. Raya Tajur No. 199 a. Industri Susu 31.500 Liter 1.100 5
DINAMIKA Kel. Tajur b. Yogurt
Telp. 0251 - 360111
87 ROTI MARIAM Jl. Sedane No. 14 RT. 003/002 a. Ind.Roti 3.500 Bh 25 L = 1
Telp. 0251 - 342209 Kec. Bogor Selatan b. Roti Cane P = 2
88 KUJANG Jl. Sukaraja RT. 03/01 a. Ind.Pengupasan Kacang2an 60 Ton 180 15
Telp. 0251 - 651166 Kel. Ciluar, Kec. Bogor Utara b. Kacang Kupas
89 KUJANG Jl. Sukaraja RT. 03/01 a. Industri Makanan 8 Ton 180 43
Kel. Ciluar, Kec. Bogor Utara b. Sekoteng
90 KUJANG Jl. Sukaraja RT. 03/01 a. Industri Roti 90 Ton 125 12
Kel. Ciluar, Kec. Bogor Utara b. Tepung Roti
91 AGFA PRIMA LESTARI