An IHS-Based Enhancement Method with Improved Scale/Shift Parameter of Linear Model
Zhang Bingxian1
Beijing Institute of Space Mechanics & Electricity, 104 Youyi Road, Beijing 100089, China [email protected]
Commission III, WG III/5
KEY WORDS: B3-Spline, Colour image, Image enhancement, Improved gamma transformation, Linear transformation
ABSTRACT:
An IHS-based enhancement method for colour images (IEM) is presented in this paper. An improved gamma transformation was applied to enhance the brightness and texture details of colour images taken in dark conditions. Moreover, a spatial filter was used to prevent the loss of details of highlighted areas. The method was tested with the images from the database of Simon Fraser University (SFU) and from the Chinese ZIYUAN-02C satellite. The experimental results show our proposed method could effectively enhance the luminance and texture of the images, especially for those taken in dim conditions, and maintain the hue and saturation of original images.
1. INTRODUCTION
Remote sensing images have played an important role in many applications, such as objective detection and image interpretation. Among these applications, the visual effect is an important factor that affects the accuracy of application results. However, many factors may reduce the visual effect and degrade the image quality. For example, insufficient light lowers the image brightness and smudges the fine textures, making the detailed information difficult to be identified. In this case, images need to be enhanced prior to applications [1]. The visual effect is closely related to the capability of the display devices that show graphic images. Because remote sensing images can be shown only in a single band or in three bands simultaneously on a display device, many image enhancement techniques have been developed for panchromatic images and colour images. Among these techniques, enhancement approaches in frequency domain and space domain [2, 3, 4, 5] are popular. Although these approaches can effectively improve the contrast of images, they cannot maintain an average brightness level, which may result in either under- or over-saturation in the processed images. Therefore, these methods are not suitable for colour image enhancement. Because colour appearance is a useful feature to identify an object, it must remain roughly constant during colour enhancement. To study colour constancy, the retinex model was proposed [6]. The colour appearance of an object is believed to be determined by the surface reflectance function of surrounding objects, which is not related to the intensity of light [7]. Therefore, the colour appearance of an object can be defined by the variation of ambient light, and this appearance can remain unchanged when the intensity of the light is changed. Although many researchers established the mathematical foundations of the retinex model soon after, the model has not been applied widely to image enhancement. Then the author in [8] developed a single-scale retinex (SSR) method. It replaced the center/surround retinex with a difference of Gaussian (DOG) function. Moreover, it modified the placement of the logarithmic function in the retinex model. The SSR method can
provide either dynamic range compression or tonal rendition of images, but it cannot provide both of them simultaneously [8, 9]. Therefore, a multi-scale retinex (MSR) method was developed [10]. Both dynamic range compression and tonal rendition are achieved by the MSR method; however, the method causes gray-world violation in the rendition of scenes [10]. To resolve this problem, a multi-scale retinex method with colour restoration (MSRCR) [11, 12] was proposed. Although all of these algorithms could improve the colour constancy to some extent, the hue of images may be changed as they mix the colour information with illumination [13]. To cope with the problem mentioned above, a linear transformation method (LTM) was proposed, which proved that linear transformation does not change the hue of images in the Intensity-Hue-Saturation (IHS) colour space, and the variation of saturation is decided by the scale parameter and shift parameter of linear transformation [13]. However, the scale parameter in LTM contains an experience constant, which may increase the instability of the method. Moreover, the scale parameter is not monotonic in LTM, which may result in texture distortion after enhancement. Therefore, to increase the robustness of the result, the innovation of this paper is focused on the accuracy and stability of the scale parameter. The shift parameter is changed slightly to further optimize the enhancement image quality.
2. METHOD
The main steps of the proposed IHS-based enhancement method for colour images (IEM) are as follows:
1. Transforming the image data from RGB colour space into IHS colour space;
2. Determining the scale parameter and the shift parameter of linear transformation;
3. To obtain the enhanced images, a linear transformation is performed by convolving the scale parameter with the original images. Then a shift parameter is added into the intensity component of the enhanced images to restore some detail information that is lost during transformation.
2.1 LTM method
The key step of the LTM method is the construction of the scale parameter. The scale parameter α of the current pixel in LTM consists of two components, i.e, the luminance gain and the colour gain, described as follows:
lg log(1x c* / (s1))l (1)where g is a log mapping function defined in LTM that denotes the colour gain of α, x = max(R, G, B) is the maximum gray value of the current pixel, s = R + G + B, x/(s+ 1) denotes the colour information of the current pixel and c is the constant; l denotes the luminance gain. In LTM, the luminance gain is defined as [13]:
0, 0
( ), 0
x l
F x x
(2)
where x = max(R, G, B), F(x) represents the adaptive quadratic function, which is defined as:
2 2
( ) [ ( 127.5) (255 )] /
127.5
mv
F x x mv x (3)
where mv denotes the mean of the luminance image. Obviously, when x is equal to 0 or 255, F x( ) achieves the maximum value of 255. Therefore, the processed value will not be over flow.
In LTM, the authors directly adopted the quadratic function and the log function to work out the scale parameter without a detailed analysis, but they gave us a conclusion that this scale parameter can promote the intensity and texture information. Therefore, the scale parameter in LTM seems to be treated in a heuristic manner that is not based on modeling.
As the authors did not give the optimal values of mv and c in LTM, here we randomly select some values of mv and c to reveal the distribution of the scale parameter function to analyze its characteristics, as shown in Fig. 1:
(a) mv is assigned to 64 (b) mv is assigned to 127.5
Figure 1. The distribution function of LTM’s scale parameter
In Fig. 1, mv is set to 64 in (a) and 127.5 in (b). The values of c
in red, green and blue curve in (a) and (b) are 0.3, 3.0 and 30.0, respectively. We find from the figure that mv has an impact on the range of the scale parameter while c affects the fluctuation of the parameter. Therefore, there are two main problems with the scale parameter in LTM:
(1) No matter what values are assigned to mv and c, the value of scale parameter less than 1.0 still exists in the function. It will make some “dark place” in images become darker;
(2) The scale parameter function does not increase monotonically. Consequently, multiplying the scale parameter
with the original image will change the texture information in the original image.
We have tested the effectiveness of applying LTM to the ordinary image and satellite image. The results are shown in Fig. 2 (c=3.0).
(a) original ordinary image (b) enhanced ordinary image
(c) original satellite image (d) enhanced satellite image
Figure 2. the colour image enhanced using LTM method
From Fig. 2, we find that the enhanced ordinary image does not suffer from an obvious texture distortion, but the enhanced satellite image contains a serious texture distortion. To explain this phenomenon, we show their histograms in Fig.3.
(a) ordinary image (b) satellite image
Figure 3. the histograms of colour images
In Fig. 3, most DN values in the ordinary image are less than 50, but the DN values in the satellite image cover the entire gray range. From Fig. 1, it is obvious to find that when the DN value is less than 50, the scale parameter is increasing monotonically. Most of its corresponding values is bigger than 1.0 when c is assigned to 3.0. Therefore, the ordinary image can be enhanced very well. But when the original DN value covers the entire gray range, the scale parameter is not monotonous, so the texture distortion appears in the satellite image. Therefore, the effect of LTM is limited, and we proposed an optimized method--IEM.
2.2 Linear transformation
In IHS space, H, S, and I components are defined as [14]:
arccos( )... 3min( , , )
, 1 ,
2 arccos( ).. 3
G R R G B R G B
H S I
G R R G B
(4)
where R (red), G (green), and B (blue) are gray values of a pixel of a 24-bit colour image; min () expresses the function of taking the minimum value. φ is defined in Eq. (5):
2
Assuming the scale parameter is α and the shift parameter is , we can derive the linear transformation as follows:
, , enhancement is to suppress the variation of saturation.
The transformed saturation is defined as ST in Eq. (8):
3min( , , ) 3min( , , ) 3 / To suppress the variation in saturation, should be as small as
possible and αshould be as big as possible. The determinations of α and in IEM are presented below.
2.3 Determination of scale parameter and shift parameter
Gamma transformation defined in Eq. (9) is common used for brightness correction of images for its advantages over other methods.
Scr (9)
where c and are constant values, r is the grayscale value of the current pixel, and S is the transformed grayscale value.
However, since the ratio of red, green and blue components will change along with the process of brightness correction by using gamma transformation, gamma transformation is not suitable for directly using as the scale parameter in enhancement of colour images. Fortunately, the linear transformation mentioned in section 2.2 in this paper can effectively limit the action of gamma transformation only on intensity component of colour images. In this case, colour distortion will be refrained. As the intensity component of images should be improved after enhancement and over-saturation in the processed images must be prevented. Therefore, the function used as scale parameter in the linear model should decrease monotonically. Meanwhile the reasonable range of scale parameter should be bigger than 1.0 and less than 2.0. In this case, if r represents the grayscale value of current pixel, S will be overflow easily. Then, we select 2.0 as the value of r and the range of should be between 0 and 1. Considering S is inversely proportional to the grayscale of the current pixel, should satisfy the following condition:
( ) f g
or f( )1
g
(10)
where g stands for the intensity component of the current pixel. For simplicity, we selected = f (−g) in this paper. The scale
It is easy to see that a smaller original DN value corresponds to a larger slope of transformed DN value in the new scale parameter. That is to say, the insufficient intensity is compensated and the gray difference between adjacent pixels is widened. Since the gray difference between adjacent pixels expresses the details of images, we multiply the scale parameter with the original image to sharpen the details of the “dark place”. Moreover, the maximum of the transformed DN value acquired by using the improved scale parameter is the same to the maximum of the original DN value, so the transformed DN value will not be overflow easily.
Unfortunately, the difference in gray value between adjacent pixels could be reduced at a larger original DN value. Then, the shift parameter should be added into the process. The shift parameter stores details of edge information. Adding the shift parameter could retain the details for images with sufficient intensity. Shift parameter is defined as:
=I–B*I (12)
where I represents the original intensity of colour image, and B
stands for the convolution kernel.
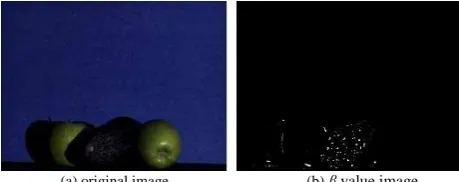
B was set as B3-spline kernel in LTM, and the test shows a good result. However, as analyzed in section 2.2, to suppress the variation in saturation, shift parameter should be as small as possible. The author did not compare the performance of B3-spline kernel with different smoothness in LTM. Therefore, we simply compare the performance of three B3-spline kernels with different smoothness in (13), and the test image used to compare the performance of different B3-spline kernels is shown in Fig.4 (a), the compared results are represented in
Table 1. Distribution of value by using B3-spline kernels
From Table.1 , it is clear to see that β values of B1 kernel is the smallest values in three group data, and β values of B1 kernel concentrate within the range of less than five. All these indicate that the shift parameter in B1 form can best meet the requirement for a small-enough β. Moreover, the restoration of the shift parameter of B1 can also meet the basic requirement. The detail information by using B1 as kernel can be seen in Fig.4.
(a) original image (b) value image
Figure 4. original image and β value image ISPRS Annals of the Photogrammetry, Remote Sensing and Spatial Information Sciences, Volume III-3, 2016
In summary, we select improved gamma transformation and B1 kernel to construct scale parameter and shift parameter.
3. METHOD Figure 5. Original and enhanced results
For the ordinary image from SFU image data set, the enhancement caused obvious colour distortion in MSRCR and LTM, as shown in Fig.5. However, the proposed method restored vivid colour, rich details, and obtained a good visual effect.
To obtain quantitative evaluation, we used luminance (L) [8], contrast (C) [8], hue (H) [13], saturation (S) [13], and EME [1] to evaluate the results. The indices are defined as follows.
|gRe( , )i j gori( , ) |i j respectively. c represents a small constant to avoid dividing by
zero; In experiments, we utilized 8*8 blocks and c =0.0001. The evaluation results are shown in Tables 2 and Table 3.
ALGORITHM/
Table 2. Evaluation of results on the image from SFU
Tables 2 show that the C value of IEM is bigger than those of the MSRCR and LTM methods. This result suggests that IEM is more effective in improving the contrast. The H and S of IEM in Table 2 are 1.1% and 0.96% of those of MSRCR, and 14.75% and 7.75% of those of LTM. These results indicate that IEM is superior in maintaining colour information, while the MSRCR and LTM methods could generate more colour distortion than IEM. All indicators show that IEM performs better than the other enhancement methods.
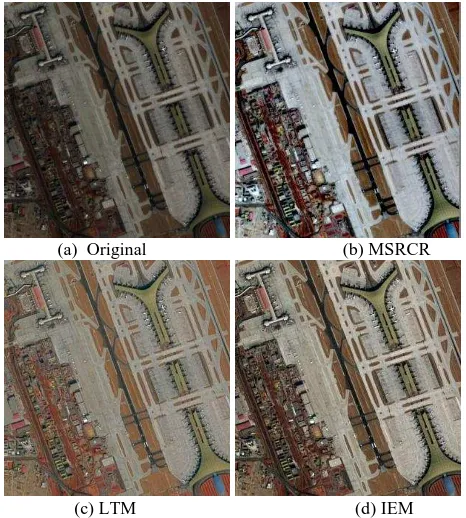
As presented above, IEM performs well for the ordinary colour images. However, its performance for remotely sensed images, which are more complex and diverse, should be also assessed. To validate the IEM for remotely sensed images, we evaluated a colour image of Beijing Capital Airport acquired by the Chinese ZY02C satellite which was launched on December 22, 2011. The satellite is used to survey land resources. Limited by the sensitivity range in a single channel of the multi-spectral camera of ZY02C satellite, insufficient light becomes the main problem for object recognition. Therefore, the colour images must be enhanced prior to interpretation. The experimental results are shown in Fig.6. We find that the MSRCR method clearly whitens the airport road, and the LTM method reddens the entire image.
(a) Original (b) MSRCR
(c) LTM (d) IEM Figure 6. Original and enhanced results ISPRS Annals of the Photogrammetry, Remote Sensing and Spatial Information Sciences, Volume III-3, 2016
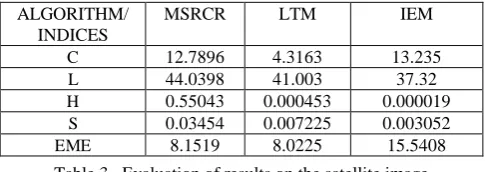
ALGORITHM/ INDICES
MSRCR LTM IEM
C 12.7896 4.3163 13.235
L 44.0398 41.003 37.32
H 0.55043 0.000453 0.000019
S 0.03454 0.007225 0.003052
EME 8.1519 8.0225 15.5408
Table 3. Evaluation of results on the satellite image
As shown in Table 3, the C and EME values of IEM are bigger than those of the MSRCR and LTM methods. This suggests that IEM can also effectively improve the detailed information of remote sensing image. The H and S of IEM are only 0.00003% and 8.8% of the values of MSRCR, and 4.2% and 42.3% of the values of the LTM methods. This indicates that more colour information is retained by IEM during the colour enhancement process. Although the L value of IEM is slightly smaller than that of MSRCR, it does not affect the overall visual effect.
4. CONCLUSION
In this paper, we present a novel method for colour enhancement techniques, which was successfully applied to colour images of simple objects taken with an ordinary camera and large coverage of complicated objects obtained by a satellite. Gamma transformation is improved in the proposed method, which widens the gray difference and highlights the details in dark areas. The shift parameter restores high-frequency information to prevent the loss of detail information in bright areas. The proposed method can preserve the colour information and enhance the visibility of local details well. It produces better results than previous methods.
REFERENCES
Lee E., Kim S., and Kang W., 2013. Contrast enhancement using dominant brightness level analysis and adaptive intensity transformation for remote sensing images. IEEE Geoscience and Remote Sensing Letters, 10(1), pp.62-66.
Lee D. H., Yang J. Y., and Seo D. C., 2011. Image restoration of the asymmetric Point Spread Function of a high resolution remote sensing satellite with time-delayed integration. Advances in Space Research, 47(4), pp. 690-701,.
Fonseca L. M. G., Prasad G. S. D., and Mascarenhas N. D. A., 1993. Combined Interpolation Restoration of Land-sat Images through FIR Filter Design Techniques. International Journal of Remote Sensing, 14(13), pp. 2547-2561.
Panagiotakis C., Kokinou E. and Sarris A., 2011. Curvilinear Structure Enhancement and Detection in Geophysical Images. IEEE Geoscience and Remote Sensing, 49(6), pp. 2040-2048.
Meylan L., Susstrunk S., 2006. High dynamic range image rendering with a retinex-based adaptive filter. IEEE Transaction on Image Process, 15(9), pp. 2820 -2830.
Land E., 1986. An alternative technique for the computation of the designator in the retinex theory of color vision. in Proc. Nat. Acad. Sci., 83(10), pp: 3078–3080.
Brainard D. H. and Wandell B. A., 1986. Analysis of the retinex theory of color vision. Optical Society, 3(10), pp. 1651-1661.
Jobson D. J., Rahman Z., and Woodell G. A., 1997. Properties and performance of a center/ surround retinex. IEEE Transaction on Image Process, 6(3), pp. 451–462.
Demirel H., Ozcinar C. and Anbarjafari G., 2010. Satellite image contrast enhancement using discrete wavelet transform and singular value decomposition. IEEE Geoscience and Remote Sensing Letter, 7(2), pp. 333-337.
Rahman Z., Jobson D. J., and Woodell G. A., 1996. Multi-scale retinex for color image enhancement. International conference on image processing, 3 , pp. 1003-1006.
Jobson D. J., Rahman Z., and Woodell G. A., 1997. A multi-scale retinex for bridging the gap between color images and the human observation of scenes. IEEE Transaction on Image Process, 6(7), pp. 965–976.
Rahman Z., Jobson D. J., and Woodell G. A., 2004. Retinex processing for automatic image enhancement. Journal of Electronic Imaging, 13(1), pp. 100–110.
Liu J., Shao Z., and Chen Q., 2011. Color constancy enhancement under poor illumination. Optic Letter, 36(24), pp. 4821–4823.
Tu T., Su S., and Shyu H. C., 2001. A new look at IHS-like image fusion methods. Information fusion, 1(2), pp. 177–186. ISPRS Annals of the Photogrammetry, Remote Sensing and Spatial Information Sciences, Volume III-3, 2016