SPATIAL AND TEMPORAL ANALYSIS OF HUMAN MOVEMENTS AND
APPLICATIONS FOR DISASTER RESPONSE MANAGEMENT
UTILIZING CELL PHONE USAGE DATA
M. Yasumiishi a*, C. S. Renschler a, T. E. Bittner a a
Dept. of Geography, University at Buffalo – The State University of New York, Buffalo, New York, U.S.A. [email protected]
KEY WORDS: GIS, Human Movements, Disaster, Emergency Response, Mobile Data
ABSTRACT:
As cell phone usage becomes a norm in our daily lives, analysis and application of the data has become part of various research fields. This study focuses on the application of cell phone usage data to disaster response management. Cell phones work as a communication link between emergency responders and victims during and after a major disaster. This study recognizes that there are two kinds of disasters, one with an advance warning, and one without an advance warning. Different movement distance between a day with a blizzard (advanced warning) and a normal weather day was identified. In the scenario of a day with an extreme event without advanced warning (earthquake), factors that alter the phone users' movements were analyzed. Lastly, combining both cases, a conceptual model of human movement factors is proposed. Human movements consist of four factors that are push factors, movement-altering factors, derived attributes and constraint factors. Considering each category of factors in case of emergency, it should be necessary that we prepare different kinds of emergency response plans depending on the characteristics of a disaster.
* Corresponding author
1. INTRODUCTION
1.1 Background
In 2014, 90 % of adults in the United States owned a cell phone (PewResearchCenter, 2014). It is becoming more common that many Americans own only cell phones and don't own the traditional landline phones (CDC, 2013). The more prevalent cell phones become, the more it is expected to be robust and reliable especially when the users need emergency assistance.
However, following the 2011 Tohoku-oki Earthquake and Tsunami, cell phone service was disrupted for days because of provider-side infrastructure damage and power outages (Japan Ministry of Internal Affairs and Communications, 2011). We observe similar incidents around the world after major disasters in which people are trying to charge their cell phones by using portable generators to connect with their loved ones.
This study was motivated to improve the effectiveness of response to such situations. To prepare for an event when cell phones, which are vital in locating victims, are not functional, can we use past-recorded cell phone usage data to delineate human movement patterns and apply this knowledge to locate victims?
1.2 Literature Review
Geography is not only about two-dimensional locations. People move and the movement involves a flow of time. Hägerstrand (1982) introduced the concept of 'path and projects' and analyzed how the movements of residents in a small town were determined by their status in the society and their daily projects. It's been 33 years since his paper, 'DIORAMA, PATH AND PROJECT', was
published. His paper paved the way for the field called 'time geography'. In recent years, a massive volume of digital data ('big data'), including cell phone usage data, has become part of important resource for the advancement of the field.
Cell phone data research evolved from simply trying to identify a precise location from a GPS and network access data to visualization of mass data and trajectory analysis. Andrienko et al. (2011b) systematically summarized the elements of movement analysis (position records, trajectory, characteristics of movement, spatio-temporal relations, dynamic attributes) and the steps of visualization (event extraction, determination of relevant places, aggregation of events and trajectories, and analysis). Then they demonstrated the visualizations using GPS traffic data.
Gonzalez et al. (2008) calculated a single spatial probability distribution from mobile phone data using a statistical approach and determined that 'inherent similarity in travel patterns could impact all phenomena driven by human mobility', indicating that there are underlying attributes for human movements and the movements might be predictable. Now the research has progressed to movement pattern analysis using such as people's work area profiles and time windows (Phithakkitnukoon et al., 2012).
Gonzalez et al. indicated in their paper that the similarity of people's movement is crucial for critical situations such as emergency response. This paper will go further and investigate the underlying attributes of the similarity as well as dissimilarity by dissecting cell phone usage data on a population level as well as an individual level.
2. OBJECTIVES OF THIS STUDY
2.1 Identify or Predict People's Locations
FEMA (Federal Emergency Management Agency) identifies three stages of activities (pre-incident, incident, post-incident) and five means (prevention, preparedness, response, recovery, mitigation) (FEMA, 2006). This study focuses on incident and response.
The incident (at the time of a disaster) and response (the period immediately follows a disaster) phases are the crucial times for emergency response teams to save lives. For the response teams to provide necessary supplies, shelter and transportation systems to victims, communication systems must work to identify victims' locations. However, during and after Hurricane Sandy in 2012, an average of 25 % of the cell sites in the area, which affected by Sandy, lost service and the reports issued by Verizon indicate that 300 central offices were affected (Kwasinski, 2013).
In the wake of the strong earthquake and tsunami, which hit northeast coast of Japan in 2011, about 15,000 cell phone base stations were interrupted. The day following the disaster, the peak of base station interruptions occurred and it took about ten days until the number of interrupted towers reduced to under 2,000 (Japan Ministry of Internal Affairs and Communications, 2011).
The main objective of this study is to determine how we can apply our knowledge of people's movement patterns when communication systems are lost, or, the systems are not adequately working to identify or predict victims' locations during and after a disaster.
2.2 Two Types of Disasters
When we talk about 'disaster', we tend to omit the fact that there are two kinds of disasters: a disaster with a warning and a disaster without a warning. Weather events such as blizzards or extreme heat are examples of disasters with an advance warning. Earthquakes or nuclear accidents are examples of the disasters without an advance warning. In this study, we will examine what factors related to human movements need to be considered in each type of disaster.
2.3 Individual and Population
Emergency management imposes a unique challenge to human movement analysis. In analysis utilizing a large number of data (so called 'big data' including cell phone usage data), a popular method is that the data is analyzed as a whole, in other words, in its aggregated form. This is understandable considering that one of the strengths of big data is its massive volume.
A challenge in emergency management is that one individual, one location point, does count as it represents a person who might need help. Investigating how individual cell phone data relates to population data is another objective of this study.
2.4 Cell Phone Usage Data as Resource
Disaster response has been identified as an area in which the GIS (Geographic Information Systems) as well as mobile phone data can contribute (Goodchild, 2008). The computation and
visualization power of GIS, and, the rich data which cell phones provide, is a dream combination for these critical times when we need to know people's locations and movements.
Despite the potential value of cell phone usage data, the data contains some drawbacks such as sparseness, inconsistency, and intervals (Andrienko and Andrienko, 2011c) that will be detailed in the following sections. Due to those characteristics, depending on the way we analyze the data, it could present different pictures of the movement patterns.
So should we utilize big data only in aggregated form? Can we rely and trust the analysis of big data when, in fact, its base data is collected arbitrarily? This study will look at the potential ways to analyze and utilize cell phone usage data.
3. DATA
The cell phone usage data was provided by the PhoneLab: A Large Programmable Smartphone Testbed of the Computer and Engineering Department, the University at Buffalo (https://www.phone-lab.org/) in March 2014. The original data package includes the phone usage data of 256 users and the data collection time range spans from 2012 through February 2014.
The PhoneLab is a smartphone platform testbed sponsored by the National Science Foundation and Sprint. Users, who signed up with the project, pay a small monthly fee and are provided with a Google Nexus 5 smartphone (Android OS). Users agree for their phone usage data to be collected and used for research purposes. Registered users are students or faculty of the University at Buffalo. This indicates that the user demography is skewed in terms of age, industry, destinations and so on. The user background is taken into consideration in the following analysis.
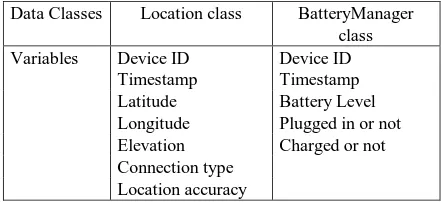
The data includes location (latitude, longitude) and other attributes (Table 1). Personal information such as name, address, phone number, gender, age, workplace are not collected. Each phone device is identified by a random number.
The original data consists of two separate collections of data, one is location data collected by Android API Location class, the other is battery data collected by Android API BatteryManager class. The reference geographic coordinate is WGS84.
Since this is an ongoing project, this preliminary data and analysis only pertain to the Location class. Data and analysis derived from the BatteryManager class will not be reported in this paper.
Data Classes Location class BatteryManager class
Table 1. Data elements captured in each class (showing only the categories relevant to this study)
4. METHODS
4.1 Dates and Time Window Selection
As a first step, two days were selected for movement pattern comparison between a day with a disaster with an advance warning and a normal weather day. Since there was no actual disaster during the data capturing period, a severe weather day, Tuesday January 7th, 2014, was instead selected. On January 7th, 2014, the Buffalo area experienced a blizzard and a travel ban was issued by more than one town in the area (News 4 WIVB Buffalo, 2014). The other date is Tuesday January 28th, 2014 which was a typical winter day without extreme weather conditions.
January 7th was during winter break and January 28th was the second day of spring semester. If the weather had been similar, this selection indicates underlying condition differences. However, considering that the blizzard was severe and schools would have closed, one may consider the fact that January 7th was during spring break didn't create an obstacle in comparison.
For disaster without an advance warning, we compared only movement patterns on a normal weather day at four different times of day. Four time stamps: 7:30 a.m. (morning commute), 11:00 a.m. (class/lunch time), 14:00 p.m. (class time) and 18:00 p.m. (evening commute) were selected. One can assume that a major disaster such as a strong earthquake hit during one of the time windows.
Figure 1. Methods flow description
Out of the 256 user data, 72 users were found to have data readings on both January 7th and January 28th. The 72 users' captured data was screened next. Due to the sparse nature of cell phone usage data, some users were dropped due to limited hours of data reading. Among 72 users, 34 users' data was found to have been captured on both days throughout the days. This study utilizes the 34 users' data.
Please note that the steps to narrow down the sample size decreased the data reading consistency. Comparison of the number of data readings of each user on January 7th and January 28th resulted in Pearson's correlation coefficient 0.485 for 72 users and 0.258 for 34 users.(1) For this study, we accepted the sparseness of the data as a characteristic of cell phone usage data to pursue our objective of examining the relationship of individual and population cell phone data. The total number of
(1)
Pearson's correlation coefficient ranges from -1(negative correlation) to +1(positive correlation) and 0 is not linearly related (Rogerson, 2010) .
location points of the 34 users on January 7th is 14,371 points. The total number of location points of the 34 users on January 28th is 24,786 points.
Since cell phone usage data is not captured steadily like a clock, it is impossible to capture data of all users at the same exact timestamp. To solve this issue, the time window method was applied. Specifically, a location reading for each user with the closest timestamp to the set four timestamps was selected.
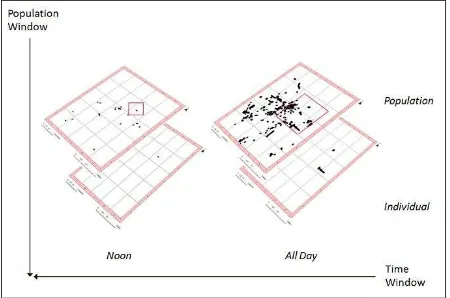
Figure 2 describes the composition of cell phone usage data and the data extract windows along the population axis (population - individual) and the time window (range of time such as 'all day' - a point of time such as 'noon').
Figure 2. Windows of cell phone data analysis (Vertical axis: individual - population window. Horizontal axis: time window)
4.2 Movement Attributes Calculation
For the selected 34 users, movement distance was calculated from latitude and longitude of successive location readings. Speed and bearing were calculated from five latitude/longitude readings prior to each timestamp successively and the average values were calculated. People don't move in straight lines to their destinations; they turn at corners, stop at traffic lights, if they pass their destination they have to U-turn. That is the reason why average values were used instead of values from two latitude/longitude pairs. Using five points would allow us to include some direction adjustment points.
The location class of Android API does capture bearing information that is generated from the direction to which the phone is facing at the time of data capture. However, a person's moving direction and the direction the person's phone is facing don't always coincide. In this study, instead of using the phone facing bearing, bearing was calculated from successive latitude/longitude readings using the Haversine formula (Movable Type Ltd, 2014). This formula was used for calculating movement distance and speed as well.
4.3 Movement Pattern Analysis
4.3.1 A disaster with an advance warning: First, the
population movement distance on the blizzard day (January 7th) and the normal weather day (January 28th) were compared. For this study, we assumed that most of the population were aware that a blizzard was going to hit on that day and it would have created a major alteration in their daily routines and movements. Linear movement distance and longest movement distance
(bounding diameter) were calculated from all location readings of each user throughout each day and summed as population movement distance.
The result was examined to identify the factors that should be considered in response to a disaster with an advance warning.
4.3.2 A disaster without an advance warning: Next,
locations, speed and bearings of the users in the four time windows on January 28th were extracted and mapped. The user locations and bearings in one of the time windows, 7:30 a.m., are shown in Figure 3.
Assuming that all cell phone users lost their cell phone functionality at the time of disaster, Cell phone users, who were moving at the speed of 4 km (2.49 miles)/hour and above (faster than walking speed) were identified and their locations were moved (predicted) for 30 minutes based on their moving speeds and bearings. The moved points were compared with actual locations after about 30 minutes.
The results were examined for accuracy and errors. Human movements are influenced by various factors and it was anticipated that the moved (predicted) points and actual locations wouldn't coincide. The errors would indicate the factors affecting human movements.
Figure 3. 7:30 a.m. window showing user locations and bearings. The star is the U. at Buffalo campus location(2)
4.4 Conceptual Modelling and Application
The findings from 4.4 were used to construct a conceptual model of human movement factors that we ultimately will apply to emergency response.
5. RESULTS
5.1 A Disaster with an Advance Warning
Before moving onto results, one has to point out the accuracy variance of the captured location data. Cell phones use more than one method to get and send out location data. The connection type of this study included GPS and network and accuracy of location data varied. Each connection (data reading) gives location accuracy information in meters. GPS returns a very accurate location (meter in single digit accuracy). Accuracy of
(2) In this paper, boundaries and roads are removed from some of the
maps for privacy protection.
network connection varies from single digit to three digits in meters.
Because of this issue, the numbers indicated below need to be considered as rough estimates with overall standard deviation about 200 meters. Still, magnitude of difference is obvious.
On January 6th, 2014, NOAA issued a blizzard warning for Erie County, New York (includes Buffalo) and for several nearby counties at 5:23 p.m. effective through 6:00 p.m. on January 8th, 2014. Expected snow accumulation on January 7th was two to four inches. Visibility was expected to be near zero with whiteout conditions at times. A travel ban was issued on January 7th by more than one town in the Buffalo area and the travel bans were lifted in the evening on that day.
Comparison of the phone users' total linear movement distance on January 7th and 28th showed that the total movement distance of the whole population on the 28th was about 200% longer compared with the 7th.
Population Jan 7 (blizzard)
Jan 28 (normal weather)
% Change
Total linear movement distance
678.41 km (421.54 mi)
2,021.78 km (1,256.28 mi)
198.02 %
Longest movement
58.84 km (36.56 mi)
371.11 km (230.60 mi)
530.71%
distance
Table 2. Population total of linear movement distance
Comparison of the phone users' longest movement distance per day on January 7th and 28th showed that the longest movement distance of the whole population was about 500% longer on the 28th compared with the 7th.
Despite the severe weather warning and the travel bans, five out of 34 cell phone users (12%) moved farther than 3 km (1.86 miles).
Figure 4. Longest movement distance (bounding diameter) shown as circles (Left: Jan 7th, Right: Jan 28th)
5.2 A Disaster without an Advance Warning
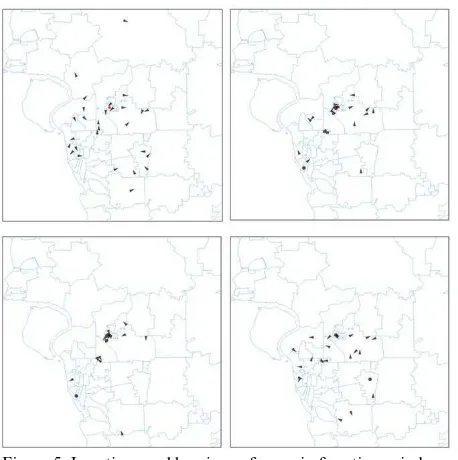
The cell phone user locations and bearings, which were extracted in 4.2 for four time windows, show that the users are converging from surrounding areas to the school/metro area in the morning
and dispersing in the evening (Figure 5). The demography of the users are limited to people related to the University at Buffalo, especially North Campus where the PhoneLab is located. However, the university is the fourth largest employer in the Buffalo area with about 7,000 employees (Erie County, New York, 2010) plus about 30,000 students (University at Buffalo, 2015). So we can consider that the demography represents not a small portion of the movements of the residents.
The locations of all users moving faster than 4 km (2.49 miles)/hour in each time window were moved to predicted locations after 30 minutes. Figure 6 shows the result of this step for each window. Two lines extending from points in circles are indicating the difference of moved (predicted) points and actual locations at approximately 30 minutes later.
Figure 5. Locations and bearings of users in four time windows (Top left: 7:30 a.m., Top right: 11:00 a.m.,
Bottom left: 14:00 p.m., Bottom right: 18:00 p.m.)
The comparison of linearly moved (predicted) points and actual locations revealed the overall direction of the points was in the same 180 degree plane. However, still a large degree/directional difference was observed. This difference tells us the factors which affect human movements - the movement which cannot be calculated from a linear mathematical calculation. Based on the examination of the errors, those factors were identified and they will be discussed in the DISCUSSION section.
Examining the results of 5.2, two observations stood out. The first observation was that people were rather stationary. Even during the morning and evening commute time, the cell phone users, who were moving faster than walking speed, was a minority of the group.
The other observation revealed was that the locations captured on cell phones were rather clustered. Heavy phone activities were captured in one area, then the heavy activity spot moved to the next spot as if jumping from island to island. Figure 7 shows the locations of four cell phone users throughout January 28th and their heavy phone activity spots.
Figure 6. Moved points and actual points comparison example (Top left: 7:30 a.m., Top right: 11:00 a.m., Bottom left: 14:00 p.m., Bottom right: 18:00 p.m.)
It appears that people use their cell phones extensively at one location then move to another location. While they are moving (usually driving or using public transportation), the frequency of cell phone activity declines and their locations are captured less frequently.
Figure 7. Locations of four cell phone users on Jan 28. Each symbol represents the same user locations.
6. DISCUSSION
6.1 Movement Distance
In the case of January 7th blizzard, a weather warning was broadcast on TV, radio and the Internet. Although the timing of lifting travel bans among towns varied, overall, the weather conditions were not suited for driving throughout the day. It was in the best interest for residents as well as local governments that the residents limit their travel to avoid accidents and injuries on the roads and to conserve the emergency response recourses that would be used to attend to such incidents.
In this study, because of protections of privacy, we are not able to contact the five cell phone users, who moved farther than 3 km (1.86 miles) on that day and ask them the reason why they were out on the roads. It is possible to consider that the user demography (college students who are active and sometimes reckless) is a special case and residents above 'college' age stayed at home. In any case, emergency management teams should anticipate that not all residents will comply with a travel ban.
The fact that the longest movement distance was about 500% longer on a normal weather day compared with the blizzard day presents a couple of points for emergency management teams to consider. Residents staying at one location or moving about in nearby neighbourhoods during a blizzard is okey with respect to avoiding accidents. However, they are confined in their own locations and their movements don't overlap (Figure 4). The challenge is to find a sick or elderly person needing help if they are sheltered in their own space. Providing resources (food, fuel, etc.) door-to-door to residents takes time and is often impossible in severe weather.
On the other hand, on a normal weather day, people move farther from one location to another, and usually farther away from their residence. People's movement overlaps on busy roads and in crowded areas (Figure 4). This pattern could be positive and negative if a disaster strikes without warning. A crowded place produces a large number of injured people or casualties in a small area. At the same time, there are many people and resources such as hospitals or fire stations around them which can rush to provide help. However, logistics for people far away from their residence will be challenging if transportation systems are interrupted and people require temporary shelter.
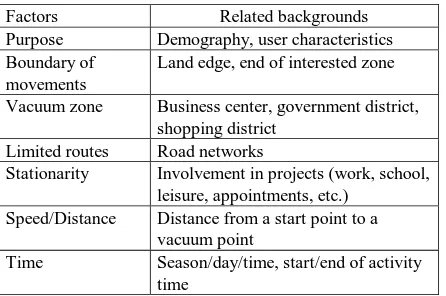
6.2 Movement Altering Factors
Based on examination of errors in Figure 6, some movement altering factors and their backgrounds are identified (Table 3). Please note that the list is not exhaustive.
Factors Related backgrounds
Purpose Demography, user characteristics Boundary of
movements
Land edge, end of interested zone
Vacuum zone Business center, government district, shopping district
Limited routes Road networks
Stationarity Involvement in projects (work, school, leisure, appointments, etc.)
Speed/Distance Distance from a start point to a vacuum point
Time Season/day/time, start/end of activity time
Table 3. Factors alter people's movements and their backgrounds
The first movement-altering factor is purpose. Unless people have motivation to move somewhere for a certain purpose (eg., attending a class), they remain stationary. This factor governs whether people move or not in the first place. The next movement-altering factor is physical boundaries. The boundaries include land edge and the end of the interested zone. Land edge is an important factor in an area like Buffalo where the west side is facing Lake Erie.
The end of interested zone indicates that there is a zone in which people stay for a certain purpose. If people are associated with a university, they remain in the zone with the school, classmates' apartments, dining spots, etc. Among various zones, a certain zone swallows a large number of the population in the area ('vacuum' zone). The vacuum zone employs or attracts a large portion of the residents (although not all of them) for a certain purpose such as business, shopping, dining, study, leisure and so on. In case of this study, the University at Buffalo and the surrounding shopping and dining areas are the vacuum zone of the cell phone users (Figure 7).
Figure 7. Vacuum zone, interested zones and points, and routes
However, people are not able to take arbitrary routes to a vacuum zone. They follow limited road networks or walking paths to move to and from the vacuum zone. The speed on the routes is affected by the distance between a start point (residence) and a vacuum zone (or other purpose point). In the U.S. road system, the farther people have to move, the road types change from city roads with speed limits such as 35 miles per hour to a freeway with speed limits such as 65 miles per hour. The future change of speed is hard to predict from current or past moving speed unless we can determine how far the person is going to move.
Another movement altering factor is stationarity that is mentioned above. Movement has a contrasting side of not moving or being still. If there is no reason to move, people would stay put. Once people reach the zones of their purpose, they engage in activities specific to the zone for a certain duration required for that activity. Lastly, these factors are affected or regulated by time - in the morning, in the afternoon on a weekday, weekend, in which month (season) and so on.
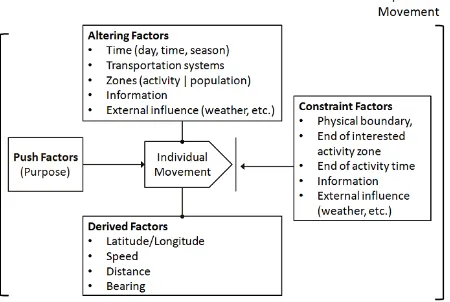
This study is ongoing and it is a little early to present a final, definite conceptual model. In the following paragraphs we present a possible model at this moment that can be applied to emergency management (Figure 8).
7. APPLICATION
As an example of application, we would like to demonstrate the thought process on each event.
On January 7th, 2014, a weather warning and travel ban didn't work for some cell phone users because they had push factors which made them decide to go out in the blizzard. Information such as weather, news and road conditions might have altered their usual routes but they didn't refrain from moving. So what pushed them? Was it job, taking care of family members, obtaining food, or just curiosity? How can we restrict such movement if it is really necessary?
Figure 8. Human movement factors
What if a strong earthquake hit on January 28th at 2:45 p.m.? The cell phone users who had push factors (school) are mostly in their interest zone (school) and are staying in the zone. The other users who didn't have push factors (no classes) are probably staying in their residence zone or going out due to other push factors (meeting friends, shopping, etc.). Those push factors would have moved them to non-school zones. However, it can be assumed that they are moving to a zone close to the school zone (meeting school friends) or to a vacuum zone (downtown, etc.).
Figure 9 shows that in the 2:00 p.m. window on the 28th, user locations are clustered in school zones, residential areas close to the north campus and in the downtown area. However, if the earthquake hit during morning commute, the user locations display different patterns (Figure 5. Top left).
Figure 9. Cell phone user locations in 2:00 pm window
If cell phone users lost their communication functionality after the earthquake, depending on the regional demography and day and time, their locations would be first guessed by determining if
the time is transit time or stationary time. If it's stationary time, their staying zones would be assumed by demography. If they are in transit time, on the way to or from a vacuum zone would be the highly populated route. Then other movement altering factors would be considered such as: 1) Is it possible that they receive information from other sources? 2) What physical boundaries or obstructions are constraining their movements? 3) If their movements are not constrained physically, how fast and how far can they move?
8. CONCLUSION
The first objective of this study was to determine how we can apply our knowledge of people's movement patterns to identify or predict victims' locations when communication systems are lost or not adequately working during a disaster. According to what we found so far, that it is very hard to predict people's exact locations using only numerical attributes. However, analyzing cell phone data gives us a glimpse of human movement patterns based on their purpose, movement altering factors and constraint factors. Once we understand those factors, this will help us design different patterns of emergency response according to the movement altering factors.
The second objective was to examine two types of disasters, one with an advance warning and one without an advance warning. As seen in the previous sections, it is clear that the two scenarios impose different issues and require different strategies in emergency response.
The third objective of this study was to analyze the relationship of individual cell phone data and population cell phone data. We found during this study, that trying to narrow down the number of samples based on set criteria decreases the correlation of data readings between users and between data readings on different days of the same user. However, to deduce factors that affect human movements, if we ignore the individual data, we might miss important factors affecting each individual's movement. In the case of big data, it is hard to inspect every individual data (in respect to time, technology, human resources and costs). So at this moment, we can only conclude that individual data is actually an important ingredient of big data and we might need to find a way that enables us to look at both big and small pictures within the data.
The forth objective of this study was to determine the characteristics and potential of cell phone data for emergency response. As already mentioned, cell phone data has some imperfect data characteristics such as inconsistency and sparseness. However, the imperfectness or shortcomings of the data actually provides us insight into how our movements are affected by numerous factors in our lives. After all, our life doesn't consist of perfectly scheduled, repeated courses of action.
Since this study is ongoing, one has to understand that some of the results, conclusion and the human movement factor concept in this paper require further analysis. Still, the results so far have given us important insight about cell phone data and human movements. More refined results in the near future are likely to will help improve the effectiveness of emergency response.
ACKNOWLEDGEMENTS
We would like to thank Dr. Geoffrey Challen and Dr. Karthik Dantu at the University at Buffalo PhoneLab for providing the cell phone usage data for this research project.
REFERENCES
Andrienko, G., Andrienko, N., Bak, P., Keim, D., Kisilevich, S., and Wrobel, S., 2011a. A conceptual framework and taxonomy of techniques for analyzing movement. Journal of Visual Languages & Computing, 22(3), pp. 213-232.
Andrienko, G., Andrienko, N., Hurter, C., Rinzivillo, S., and Wrobel, S., 2011b. From movement tracks through events to places: Extracting and characterizing significant places from mobility data. Visual Analytics Science and Technology (VAST), 2011 IEEE Conference on, IEEE, pp. 161-170.
Andrienko, N. and Andrienko, G., 2011c. Spatial generalization and aggregation of massive movement data. Visualization and Computer Graphics, IEEE Transactions on, 17(2), pp. 205-219.
CDC (Center for Disease Control and Prevention), 2013. Wireless Substitution: Early Release of Estimates from the National Health Interview Survey, January - June 2013, http://www.cdc.gov/nchs/data/nhis/earlyrelease/wireless201312. pdf. (Accessed 28 April, 2015).
Dodge, S., Weibel, R. and Forootan, E., 2009. Revealing the physics of movement: Comparing the similarity of movement characteristics of different types of moving objects. Computers, Environment and Urban Systems, 33(6), pp. 419-434.
Erie County, New York, 2010. Erie County (New York) Government, http://www2.erie.gov/index.php?q=erie-county-overview. (Accessed 28 April, 2015).
Gonzalez, M. C., Hidalgo, C. A., and Barabasi, A. L., 2008. Understanding individual human mobility patterns. Nature, 453(7196), pp. 779-782.
Goodchild, M. F., 2006. GIS and disasters: Planning for catastrophe. Computers, Environment and Urban Systems, 30(3), pp. 227-229.
Guo, H., Wang, Z., Yu, B., Zhao, H., and Yuan, X., 2001. TripVista: Triple perspective visual trajectory analytics and its application on microscopic traffic data at a road intersection. Pacific Visualization Symposium (PacificVis), 2011 IEEE, pp. 163-170. IEEE.
Hägerstrand, T., 1982. Diorama, path and project. Tijdschrift voor economische en sociale geografie, 73(6), pp. 323-339.
Japan Ministry of Internal Affairs and Communications, 2011. Damages Following Higashi-Nihon Great Earthquake in the Telecommunications Industry and the State of Recovery, http://www.soumu.go.jp/main_content/000117341.pdf (in Japanese). (Accessed 1 March, 2013).
Kwasinski, A., 2013. Lessons from field damage assessments about communication networks power supply and infrastructure performance during natural disasters with a focus on Hurricane sandy. FCC Workshop Network Resiliency, Brooklyn, NY, USA.
Lindell, M. K., Perry, R. W., Prater, C., and Nicholson, W. C., 2006. Fundamentals of emergency management. Federal Emergency Management Agency, Washington, D.C., USA.
Movable Type Ltd, n.d., Great circle distance between 2 points, http://www.movable-type.co.uk/scripts/gis-faq-5.1.html. (Accessed 1 December, 2014).
News 4 WIVB Buffalo, 2014. News 4 WIVB Buffalo Facebook, https://www.facebook.com/news4buffalo/posts/
10152161185275505. (Accessed 28 April, 2015).
Pew Research Center, 2014. Mobile Technology Fact Sheet, http://www.pewinternet.org/fact-sheets/mobile-technology-fact-sheet/. (Accessed 28 April, 2015).
Phithakkitnukoon, S., Horanont, T., Di Lorenzo, G., Shibasaki, R., and Ratti, C., 2010. Activity-aware map: Identifying human daily activity pattern using mobile phone data. Human Behavior Understanding, Springer Berlin Heidelberg, pp. 14-25.
Phithakkitnukoon, S., Smoreda, Z., and Olivier, P., 2012. Socio-geography of human mobility: A study using longitudinal mobile phone data. PloS one, 7(6), e39253.
Ratsameethammawong, P. and Kasemsan, M. K., 2010. Mobile Phone Location Tracking by the Combination of GPS, Wi-Fi and Cell Location Technology. Communications of the IBIMA 2010.
Renschler, C. S., Frazier, A. E., Arendt, L. A., Cimellaro, G. P., Reinhorn, A. M., and Bruneau, M., 2010. Developing the “PEOPLES” resilience framework for defining and measuring disaster resilience at the community scale. Proceedings of the 9th US national and 10th Canadian conference on earthquake engineering (9USN/10CCEE), Toronto, Canada.
Rogerson, P. A., 2010. Statistical methods for geography: a student's guide. Sage, London, UK.
The State University of New York at Buffalo, 2015. About UB, http://www.admissions.buffalo.edu/aboutub/index.php.
(Accessed 30 April, 2015).
Timpf, S., 1998. Hierarchical structures in map series. Diss. Technical University Vienna.
Tsai, C., Chen, C., Chiang, W., and Lin, M., 2008. Application of geographic information system to the allocation of disaster shelters via fuzzy models. Engineering Computations: International Journal for Computer Aided Engineering and Software, 25(1), pp. 86-100.
Yan, Z., Jose M., Parent, C., and Spaccapietra, S., 2008. Trajectory ontologies and queries. Transactions in GIS, 12(s1), pp. 75-91.