VGI QUALITY CONTROL
C.C. Fonte a, *, L. Bastin b, G. Foody c, T. Kellenbergerd, N. Kerle e, P. Mooney r, A.-M. Olteanu-Raimond g, L. See h
a
Department of Mathematics, University of Coimbra / INESC Coimbra, Coimbra, Portugal – cfonte@mat.uc.pt b
School of Engineering and Applied Science, Aston University, Birmingham, UK – l.bastin@aston.ac.uk c School of Geography, University of Nottingham, Nottingham, UK – giles.foody@nottingham.ac.uk d
Federal Office of Topography swisstopo, Seftigenstrasse 264, 3084 Wabern, Switzerland – tobias.kellenberger@swisstopo.ch e
Faculty of Geo-Information Science and Earth Observation, University of Twente, Enschede, The Netherlands – n.kerle@utwente.nl
f
Department of Computer Science, Maynooth University, Maynooth, Ireland – p.mooney@nuim.ie g
IGN France, COGIT Laboratory, 73 Avenue de Paris, 94160 Saint-Mandé, France – ana-maria.raimond@ign.fr
h Ecosystems Services and Management Program, International Institute for Applied Systems Analysis (IIASA), Schlossplatz 1, 2361
Laxenburg, Austria - see@iiiasa.ac.at
Commission II, WG II/4
KEY WORDS: Volunteered Geographic Information (VGI), Data Quality, National Mapping Agency (NMA), Crowd-sourcing,
Citizen Science
ABSTRACT:
This paper presents a framework for considering quality control of volunteered geographic information (VGI). Different issues need to be considered during the conception, acquisition and post-acquisition phases of VGI creation. This includes items such as collecting metadata on the volunteer, providing suitable training, giving corrective feedback during the mapping process and use of control data, among others. Two examples of VGI data collection are then considered with respect to this quality control framework, i.e. VGI data collection by National Mapping Agencies and by the most recent Geo-Wiki tool, a game called Cropland Capture. Although good practices are beginning to emerge, there is still the need for the development and sharing of best practice, especially if VGI is to be integrated with authoritative map products or used for calibration and/or validation of land cover in the future.
1. INTRODUCTION
The ease of geolocation through mobile phones and the ability to create and share online maps and georeferenced photographs have resulted in a phenomenon known as Volunteered Geographic Information (VGI) (Goodchild, 2007). VGI encompasses a vast range of citizen-contributed geographic data, and some very different forms of contributor engagement, from actively mapping spatial features in OpenStreetMap (OSM) to sharing holiday photos in Flickr. As new low cost sensors become available to measure environmental variables such as atmospheric temperature, air quality, and soil moisture, VGI has the potential to play a considerable role in environmental monitoring and the collection of in-situ data (Connors et al., 2012). However, concerns over data quality remain one of the main barriers to use of VGI in authoritative databases (Flanagin and Metzger, 2008; Coleman, 2013).
Currently little guidance is available on VGI quality and its assessment in general. Typically, the quality assessment of VGI is carried out by comparing VGI with external reference data – generally in the form of authoritative data such as national topographic maps. Most studies of quality assessment for VGI have focussed on OSM, especially with regard to the data’s positional accuracy (Haklay, 2010; Haklay et al., 2010; Neis et al., 2011; Canavosio-Zuzelski et al., 2013), completeness (Haklay, 2010; Neis et al., 2011; Hecht et al., 2013) semantic accuracy (Fan et al., 2014) and currency (Jokar Arsanjani et al., 2013). Few studies have focused on intrinsic quality assessment, which is necessary to assess VGI data quality in the absence of an external authoritative reference (Barron et al., 2014), perhaps because of the lack of consistent information
about contributors, their skills, protocols by which VGI were collected, or the goals of the VGI projects. Information on these factors is necessary if we hope to assess the quality of VGI data by analysing the data itself (see also Brooking and Hunter, 2011).
With the aim of heading towards the development of better guidance, this paper presents a framework for enriching the quality of VGI. The framework considers different aspects that should be addressed during different phases of VGI creation, namely conception, acquisition and post-acquisition. We then consider two different types of VGI interfaces; the first are portals for VGI data collection by National Mapping Authorities (NMAs) while the second one is a gamified version of Geo-Wiki called Cropland Capture. In both cases the types of VGI collected are analysed as well as the procedures implemented for data collection and quality assessment.
2. FRAMEWORK FOR QUALITY CONTROL
The control of VGI quality may be performed at several stages of VGI creation, and the approaches used depend upon the data and metadata available, and on the protocols used for data collection. We propose a framework that considers different aspects of quality control across three main phases of VGI data collection: the conception phase; the acquisition phase; and the post-acquisition phase. The methodologies applicable at the acquisition phase, and to some extent also at the post-acquisition phase, are highly dependent on the conception phase.
2.1 Conception phase
Instructions and training given to the contributors
Degree of redundancy allowed (or required) for the contributed data
Availability of control or ‘gold standard’ data
Procedures to make the contributed VGI accessible to the crowd (if any)
Collected metadata.
A project to collect VGI needs to determine the desirable profile of the contributors. Either all citizens may be allowed to contribute, or there may be a selection of contributors based on reputation, experience or credentials, such as membership of a citizen group or organisation (Wehn et al., 2015). In projects such as the Degree Confluence Project (http://confluence.org/) or Wikimapia (http://wikimapia.org) all citizens can contribute. However, several studies have assessed the suitability of different types of volunteers for different mapping jobs. Volunteers tend to be particularly useful when it comes to using local knowledge, which can lead to highly accurate and current local map results, sometimes providing information with quality even higher than the one provided by experts (See et al., 2013). For base mapping of roads, buildings etc., such as the mapping in OSM using satellite images or aerial photographs, local knowledge is less relevant. Therefore, rapidly generated maps of disaster hotspots such as Port-au-Prince can be characterised by high accuracy provided that the imagery used is up-to-date. However, in the case of speciality mapping, for example recording partial damage to buildings which is not visible from remote sensing, the situation differs. The value of remote damage mapping using image data, as was central to the volunteer-based GEO-CAN damage assessment following the 2010 Haiti earthquake, remains questionable (Kerle, 2015; Kerle and Hoffman, 2013). In such cases, volunteers present in the disaster area are still very useful in providing intelligence, e.g. via Ushahidi (Barbier et al., 2012).
An important aspect, which is highly related to the contributors’ profile, is the training and instructions that are provided to the volunteers, since they directly influence the information creation process and data quality (Ghosh et al., 2011). The type of instructions made available, and their appropriate level of detail, needs to be carefully considered. Too much detail can demotivate the volunteers, since using the instructions may require too much effort, or indeed confuse them. Conversely, insufficiently detailed instructions may leave the contributors with a lack of information; therefore they may not contribute as expected. More research, led by the Human Factors community, is needed to understand how optimal instruction and training materials can be created (Kerle and Hoffman, 2013).
Additional resources may also be made available to the contributor that can be used during the acquisition phase. Some types of projects offer the possibility of providing real-time support to the volunteers, including corrective feedback provided by experts, which would increase the likelihood of collecting high quality information (Bearden, 2007; Jiguet, 2009; Deguines et al., 2012). However, this is unlikely to be possible for the great majority of VGI projects. Alternatively,
discussion forums may enable discussions between the volunteers, and eventually the contribution of experts when that becomes relevant. With this in mind, there is currently ongoing work by some of the authors of this paper into the development of VGI data collection protocols. This includes protocols for the collection of vector-based data and photography-based data by VGI projects.
If repeated inputs for the same item of information are allowed, or if control data are available, then cross-checking procedures may be used, both in the acquisition and the post-acquisition phases. The inputs from different contributors can also be modelled to highlight the relative skills of the contributors on different parts of the task. For example, contributors labelling land cover evident in remotely sensed imagery may be accurate on some classes but not all (Foody et al., 2013). Knowledge of this may allow volunteers to be selected or filtered such that emphasis is focused on those known to be accurate on the classes of greatest interest.
Another aspect that is associated with the creation of some VGI projects is the selection of procedures to make the contributed data available to the crowd. Many citizen science projects see this as their duty, and it is a vital means of maintaining the engagement and commitment of volunteers. Bearden (2007) records how volunteer contributors of spatial updates for the USGS would feel if no feedback would be shown rapidly: they ‘…would become alienated when they realized that their meticulous work would not be used in the foreseeable future’. Sharing contributed data with the crowd may be done in real time, enabling all volunteers to see the data created by other volunteers in near-real-time. A near-real-time approach is problematic where replicated observations are required by the protocol to achieve consensus or certainty – the visibility of existing data may demotivate those users who wish to feel that their contribution is unique, and it may bias new observations. On the other hand, where the aim is to leverage the power of a volunteer cohort to improve data quality, and where the assumption is that this will lead to a steady increase in quality, a near-real-time approach allows the crowd to make corrections on the available data. Alternatively, the data may be made available after some type of quality control is performed, either at the acquisition or post-acquisition phases.
The collection of metadata is another fundamental aspect related to data quality. Technical metadata such as device type and time of observation can often be automatically acquired, and may allow some inference as to the likely quality of an observation (for example, if a particular type of device has a known level of locational accuracy). Information about the contribution process (for example, the time taken by the volunteer to perform a certain task) can often be harvested through recording facilities designed into a client or website. Information about the volunteers themselves (e.g., age, location, education, expertise in the subject area) must be more explicitly requested and again this must be designed in at the conception stage. All these types of metadata may be combined in a number of ways to assess data quality.
Restrictions may also be imposed on the volunteers’ contributions. For example, a range of acceptable answers may be defined and automated methods may be used to determine whether the contributions are feasible. Similarly, the geographical context associated with contributed data may be used to check or filter data based on its general plausibility (Goodchild and Li, 2012).
2.2 Acquisition and post-acquisition phases
During the acquisition and post-acquisition phases, several types of procedures can be used to improve the quality of the collected data (Table 1), and the choice of procedure is dependent on the system conception.
Phase Aspects that may contribute to quality control Acquisition Collection of metadata
Collection of volunteers’ confidence Real-time quality control procedures and
corrective feedback
Ease of use of the VGI portal or website Post-acquisition Assessment of contributor’s credibility
Assessment of VGI reliability
Quality control performed by the crowd or selected volunteers
Quality control performed by experts Table 1. Quality control measures to consider in the acquisition
and post-acquisition phases of VGI production.
Some quality control procedures can be applied either when the data are collected (in near-real time) or after the data collection has been completed. For example, if multiple contributions for the same item of information are available, checking mechanisms to assess the reliability of the contribution may be implemented using majority rules (Haklay et al., 2010), which are based on the assumption that it is more likely that the majority of contributors is correct. Latent class modelling has also been tested to indicate the accuracy of each volunteer (Foody et al., 2015). These types of approach can be applied either during the acquisition phase or afterwards.
Another approach is to apply corrective feedback, either generated automatically by comparing VGI to a limited benchmark training set, or generated by an expert in real-time during the acquisition phase. This can be used by volunteers to correct specific obvious errors (by learning over time), but also for overall quality improvement, while also allowing for the reliability of a given volunteer to be assessed (either during acquisition or post-acquisition).
Another type of potentially useful information is the volunteer’s own confidence in the information they created, which needs to be collected at the acquisition phase. This degree of confidence can provide valuable information about the degree of subjectivity or difficulty associated with a particular set of data, or may be used to weight several contributions, if majority rules are used. Such an approach has been used in Geo-Wiki in the post-acquisition phase to filter the data for quality before they were used in subsequent research (Fritz et al., 2013).
During the post-acquisition phase traditional methods for controlling data quality, mainly related to the positional, thematic and completeness aspects, can be used. For example, confusion matrices can be generated or data matching between vector features can be undertaken by experts, comparing the VGI with authoritative data such as topographic data or in-situ data collected from professional surveys. However, the particular characteristics of VGI raise difficulties with these approaches, since there are usually fewer, if any, strict protocols for data collection. Authoritative data generally have a single accepted level of detail across the coverage, very precise rules on selection (e.g. buildings having less than 20m2 are not captured) and geometric capture (e.g. the capture fits the outer
perimeter of the building) and a well-defined list of possible attributes. In contrast, VGI can be highly heterogeneous so that completeness varies depending on location and scale. In addition, discrepancies between VGI and reference data can potentially stem from the fact that the VGI could be more current (and therefore, for many purposes, more ‘correct’) than the reference data. Therefore, for any detailed assessment of contributors’ credibility and contribution reliability, the control data should be not only correct but also cotemporaneous with the contributions, unless the phenomenon or feature under consideration changes very rarely.
Finally, the quality of VGI contributions has been linked to the ease of use of the website or portal (Newman et al., 2010), which is an area that might be investigated through a questionnaire during the acquisition phase and then analysed post-acquisition so that changes in the conceptual design can be implemented.
3. APPLICATION OF THE FRAMEWORK
Two types of VGI interfaces are considered in this paper for the application of the presented framework. The first one concerns websites and web-based applications for VGI capture for supplementing or updating the spatial databases of NMAs. The second examines quality issues in the context of the latest Geo-Wiki data collection tool called Cropland Capture.
3.1 VGI collected by NMAs
As part of COST Action TD1202 activities - a survey conducted from December 2013 to February 2014 and recent meetings (February 2015 and March 2014) involving representatives of many European NMAs - the workflows and processes by which VGI was being managed or introduced were discussed. In this section a preliminary analysis of the presented framework is made in terms of experiences of NMAs in VGI collection, based on the data gathered in the aforementioned activities.
3.1.1 Collected data
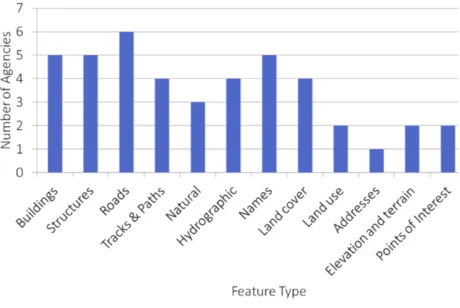
Of the 26 NMAs from Europe that responded to the survey or had participated in the COST workshops, only thirteen had experiences with VGI. Figure 1 illustrates the nature of the VGI recorded by the NMAs.
Figure 1. Feature types recorded by NMAs through VGI
Ten NMAs have organised their own VGI collection processes whilst three agencies harvested and used data collected by OSM ISPRS Annals of the Photogrammetry, Remote Sensing and Spatial Information Sciences, Volume II-3/W5, 2015
or GeoNames (GeoNames, 2014). All NMAs mentioned that VGI has been used for change detection, error reporting and the generation of new content.
3.1.2 VGI collection procedures of NMAs
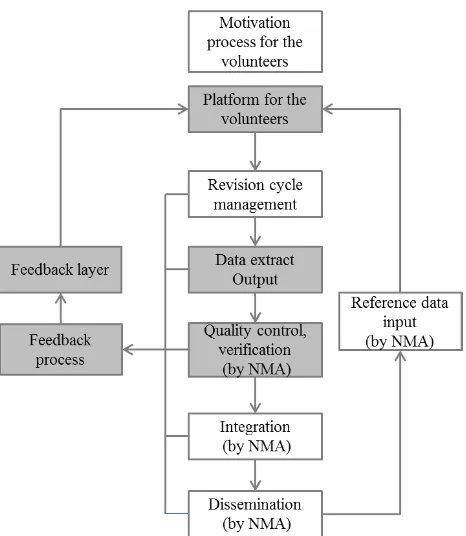
A detailed analysis of the protocols for VGI collection and quality assessment is still to be performed. However, it was identified that NMA protocols defined to collect authoritative data were universally seen as too detailed and complex to be used by the crowd. This means that protocols defined by the NMAs to assess the quality of authoritative data cannot be re-used for VGI either, since the collection process is not the same. A typical workflow illustrating the acquisition and post-acquisition phase in terms of experiences of NMAs with VGI is shown in Figure 2. Gray boxes can be viewed as good practices for NMAs engaged with VGI or which plan to get involved in VGI data collection in the near future. What seems important for most of the NMAs is to ensure that the feedback flow is visible and to manage quality control in order to guarantee the quality of the contributions.
The availability of contributor support (instructions, web-based discussion forums, etc.) could be very useful in the acquisition of VGI. It was identified that this could also lead to better uniformity, completeness and homogeneity in geographic space, since otherwise there is the possibility that certain areas (rural areas, areas with socio-economic issues, areas where legal boundaries are difficult to ascertain, etc.) will be completely missed or overlooked by contributors, as there is a tendency for VGI to be more popular in urban and populated areas, producing spatially biased VGI.
In general NMAs do not know much about the volunteers that provide VGI, and therefore usually no contributors’ profiles are specified. NMAs showed an interest in getting to know their VGI audience better; many NMAs believe that if they understand who the contributors are and become involved with specific citizen groups or communities, this would increase their confidence in the collected VGI.
As indicated in section 3.1, all NMAs that collect VGI reported that they use it for change detection and error reporting of the official information. For this aim no control data or ‘gold standard’ data are available, since the aim is actually to identify deficiencies in the authoritative data. Due to the objective of the VGI collected by these authorities, all NMAs reported that quality control of all collected VGI is necessary and must be performed by experts within the NMAs. Self-checking or self-validation by the crowd is the only procedure that cannot be considered as acceptable by NMAs. However, the NMAs found that, in general, there are few bad contributions in their VGI data collection programmes. Many NMAs found that more than 80% of citizen contributions are actually useful and can be used, which often correspond to small contributions or changes submitted by citizens, but which also corresponded to the largest amount of work required to validate and then implement the changes.
The quality control procedures implemented in NMAs vary by NMA. Each NMA has its own policy and direction on this issue. Some NMAs allow the VGI to flow into the same data processing workflows as expert-collected data, while other NMAs have developed separate parallel data processing workflows.
Figure 2. Typical workflow to collect VGI data by NMAs
Establishing workflows for processing VGI data within the NMA was identified as one of the most important issues in VGI data collection. One of the concerns of NMAs is the amount of VGI collected. If redundancy is allowed, since all VGI collected by NMAs needs to be checked by experts, an overload of information may became easily useless due to the amount of work required for its validation. Therefore, repeated contributions of the same event are not usually desirable, since in general no automated filtering procedures are implemented. One way that may demotivate repeated contributions is to make the contributed VGI available to the crowd in real-time or near real-time, enabling citizens to see what was already reported.
In the post-acquisition phase, one of the most important findings was that NMAs identified the need to report or highlight the use of VGI in their updated or corrected spatial products quickly after receiving the contributions. Otherwise citizens may become demotivated and less likely to contribute again if they cannot see any tangible use or benefit from the data that they contributed.
Establishment of processes and interfaces to the submission of VGI from citizens is a considerable task. A NMA must balance the requirements for robust spatial data collection with easy-to-use and intuitive easy-to-user interfaces that are suitable for web-based environments. Therefore, the analysis of the quality of VGI collected in relation to portal design and implemented protocols is desirable.
3.2 VGI collected by Geo-Wiki
Geo-Wiki is a crowdsourcing platform that asks volunteers to examine satellite imagery from Google Earth and determine the land cover type in a given area as well as other related questions, e.g. size of agricultural fields, degree of visible human impact, etc. (See et al., 2015). In addition to the original Geo-Wiki interface developed in 2009, there have been several branches that have dealt either with a specific land cover type, ISPRS Annals of the Photogrammetry, Remote Sensing and Spatial Information Sciences, Volume II-3/W5, 2015
e.g. Biomass Geo-Wiki (Schepaschenko et al., 2012), or a specific purpose, e.g. Competition Geo-Wiki. This latter branch was developed specifically to launch crowdsourcing campaigns and collect land cover data for the development of new land cover products and the validation of existing products. After running six campaigns, considerable experience was gained, which was then applied to the latest Geo-Wiki tool, called Cropland Capture (See et al., 2014). Cropland Capture is a completely gamified version of Geo-Wiki in which volunteers were asked whether they could see evidence of cropland in a delineated area drawn on a satellite image or from looking at a photograph. This section applies the framework to this application and raises issues related to how quality control could be improved.
3.2.1 Conception
Even though Geo-Wiki was designed to allow any volunteer to participate, in the first six Geo-Wiki campaigns the majority of volunteers were either remote sensing / land cover experts or students recruited through this network. To try to create a campaign that would appeal to a wider audience, a gamification approach was used, corresponding to the Cropland Capture game, which was designed for a mobile environment, in addition to a browser. A leader board and weekly prizes are available, to motivate the participants. Media outreach was also used as a way of reaching the widest possible audience.
The information collected about the participants is split into mandatory and non-mandatory information. The data that are always collected include: account information (username and password) and e-mail. The users are asked to provide additional data when they register for a Geo-Wiki account, which includes first name, last name, home town, country of residence and profession (where the allowable answers are: Remote Sensing/Land Cover; Higher Education; Administration; Service Sector; and Other). However, as these fields are not mandatory, some users leave them blank. Moreover, if the players downloaded the game from an app store (regardless of operating system), then registration required only email, username and password.
In the cases where additional data were collected about the volunteers, whether local knowledge has any influence on quality will be analyzed, using the Home Town data collected. This analysis is still ongoing but initial results suggest that proximity to the area being classified appears to have little influence when analysed globally. Regarding the expertise of the volunteers, in contrast to previous Geo-Wiki competitions where the majority was experts in remote sensing or land cover, only 5% of the players were experts (profession of Remote Sensing/Land Cover), rising to 25% if including volunteers in higher education. Thus, the game succeeded in attracting a broader audience than previous Geo-Wiki competitions.
Regarding the instructions for the volunteers, since the game was designed to be as intuitive as possible, very few instructions or training resources were provided. When the game launches, users are shown how the game works through a simple animation. Some examples of cropland are then highlighted on satellite imagery so that users can learn to identify different patterns of cropland. A contact email was listed to allow users to query issues related to the game and to provide feedback as the game ran.
In previous Geo-Wiki competitions, since the aim was to maximize data collection over a wide geographical coverage, a small degree of redundancy was allowed (e.g. 2 to 3 classifications of the same location). In Cropland Capture, a much greater degree of redundancy was built into the game in order that each classification would have an associated frequency distribution of answers, and confidence could then be determined. Users cannot choose the location for classification during the game. Instead the game guides users to a certain location randomly, revealing only the country in which the area for interpretation is situated, as information.
Unlike previous Geo-Wiki competitions, there were no controls or ‘gold standard’ data used during the running of the game. Instead, majority agreement was employed. Thus, the first time a new image appeared in the game, users were correct, regardless of the answer they gave. Then as more classifications were gathered for this image, correctness was determined by whether the user agreed with the majority. If correct, users scored one point; if wrong, users lost one point. Initial images were given only to those players who had the most previous correct answers in the past, to avoid having initially wrong classifications.
In terms of data accessibility to the crowd, during the time when the game was active, there was no option to see the answers or the profile of others as the game was played. This is mainly due to the goal-driven nature of the game, i.e. to collect as many points as possible through correctly classifying the images. However, as for previous Geo-Wiki competitions, the data will be openly accessible in the near future for other purposes, such as research, from www.geo-wiki.org as Excel spreadsheets or in CSV format.
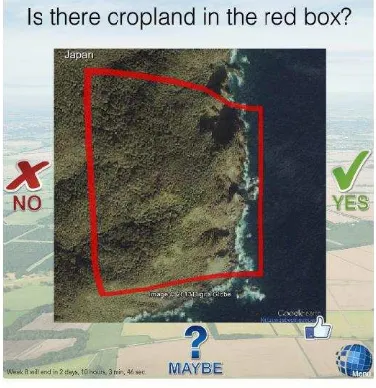
With each image interpretation, which consists is answering if cropland is present, not present, or maybe present (i.e. yes, no or maybe – see Figure 3), the following metadata are collected: an image classification number; a user identification number; the date and time of the classification; whether the answer was correct in relation to the majority; and the device used by the player, i.e. browser, tablet, smartphone and the operating system (Android or Apple). Each image classification number has an associated location, the resolution of the pixel for interpretation (in the case of satellite imagery), or a photograph identification number, which is linked back to the source, e.g. the Degree Confluence project identifier.
Figure 3. The Cropland Capture interface ISPRS Annals of the Photogrammetry, Remote Sensing and Spatial Information Sciences, Volume II-3/W5, 2015
3.2.2 Acquisition / Post acquisition
During the time the game was active, approximately 3,000 players played the game over a 6 month period. From these just under 40% of users had registered via the Geo-Wiki browser version while the remaining went via an app store, providing only the mandatory information about the user. Of those who did register via Geo-Wiki, around 20% left the non-mandatory information blank. Considering that the registration process is not onerous, making more of the information mandatory is one option that should be considered as the data may be of use in quality assessment.
No information was specifically collected on the ease of use of the platform. Players did provide feedback about the game via email but no particular comments were received regarding the app itself. During the game users suggested that, based on user location, users should be given images in their neighboring area, which would enable the use of local knowledge. However, it was not possible to implement this user recommendation keyboard is used, was actually the most efficient data collection mechanism overall, where roughly 36% of all the classifications were collected in this way.
A particular type of volunteer confidence was collected during the game since players could answer ‘maybe’ when unsure
Two types of real-time quality control were available during the game. Although majority agreement does not ensure correct classifications 100% of the time, it does provide some basis for confidence in the crowd, especially in those situations where majority agreement was very high. Players received one form of simple feedback through playing the game, i.e. correct answers were awarded a point and incorrect answers resulted in loss of one point. Players could therefore see which types of images resulted in wrong interpretations. Although there was no specific feedback provided as to why the images were incorrectly classified, this mechanism does allow players to learn over time. A second type of real-time quality control was introduced half way through the running of the game based on feedback received from a player. This player was an expert in cropland and argued that they had lost points when they were sure the images contained cropland. A mechanism was therefore added in which the answers could be challenged. If the challenger was correct and the majority was wrong, then the player was awarded five bonus points. However, if the challenger was wrong, they were provided with corrective feedback, i.e. an explanation of the interpretation of the image by the experts and five points were removed.
In the post-acquisition phase, a further initial assessment of quality control was undertaken (Salk et al., 2015). The results showed that overall accuracy was 94.4% when comparing individual user ratings against the majority agreement. Moreover, as the game progressed and players classified more images, the agreement with the majority increased. This implies that an element of learning took place during the game, i.e. players became more familiar with recognizing cropland or its absence. As an experiment, a series of control or ‘gold standard’ images were then created post-acquisition. These images were selected based on a range of difficulties as guided by the majority agreement, i.e. from images with complete agreement to those where the crowd was divided. The results showed agreement with the experts that varied from 5 to 93%, indicating that majority agreement alone is not a perfect indicator of correctness. The main lesson from the game was that controls are needed at runtime, both for learning and to better control for overall quality. This lesson is currently being implemented in the next game called Picture Pile, which will be launched in the summer of 2015.
4. CONCLUSIONS
This paper presented a framework for assessing the quality of VGI, which highlights different issues that need to be considered during the conception, acquisition and post-acquisition phases of VGI creation. Among others, these include making a careful match between the correct type of volunteer for a given mapping job, collecting metadata on the volunteer and the specific mapping contribution, providing suitable training and instructions prior to the commencement of the mapping, providing corrective feedback during the mapping, continuous generation, update and use of control data, active quality control measures (either by other volunteers or by experts), and easy-to-use and well-designed mapping portals or websites. Data collection of VGI by NMAs was then considered, in particular the types of data collection processes that are currently employed. An analysis of the last Geo-Wiki tool to be developed was then analysed with respect to the proposed framework. These two examples illustrate that platforms with different aims may require very different approaches, but some common needs can be identified, such as the collection of metadata about the volunteers and the need to perform quality control, even though this can be done in very different ways according to fitness-for-purpose.
We can conclude that tentative steps are being taken to address quality issues and that good practices are beginning to emerge. It is hoped that work on the topics discussed in this paper will continue to help ensure that the full potential of VGI for environmental monitoring and integration with authoritative mapping is realised. 2012, Maximizing benefits from crowdsourced data, Computational and Mathematical Organization Theory, 18, 257-279.
Barron, C., Neis, P. and Zipf, A. (2014), A Comprehensive Framework for Intrinsic OpenStreetMap Quality Analysis. Transactions in GIS, 18: 877–895. doi: 10.1111/tgis.12073.
Bearden, M.J. (2007), The National Map Corps. Workshop on Volunteered Geographic Information, University of California at Santa Barbara, Dec 13-14. Available at http://www.ncgia.ucsb.edu/projects/vgi/docs/position/Bearden_ paper.pdf. (Last accessed 10 April 2014)
Brooking, C., and Hunter, J.: Reputation-aware filtering services for citizen science data, IEEE Seventh International Conference on e-Science Workshops (eScienceW), 2011, 7-13,
Canavosio-Zuzelski, R., Agouris, P., and Doucette, P., 2013. A photogrammetric approach for assessing positional accuracy of OpenStreetMap© roads. ISPRS International Journal of Geo-Information, 2 (2), 276–301.
Coleman, D., 2013. Potential contributions and challenges of VGI for conventional topographic base-mapping programs. In: D. Sui, S. Elwood, and M. Goodchild, eds. Crowdsourcing Geographic Knowledge. Springer Netherlands, 245–263.
Connors, J.P., Lei, S., and Kelly, M., 2012. Citizen science in the age of neogeography: Utilizing volunteered geographic information for environmental monitoring. Annals of the Association of American Geographers, 102 (6), 1267–1289.
Deguines, N., Julliard, R., de Flores, M. and Fontaine, C., 2012. The Whereabouts of Flower Visitors: Contrasting Land-Use Preferences Revealed by a Country-Wide Survey Based on Citizen Science, PlosOne, DOI: 10.1371/journal.pone.0045822.
Fan, H., Zipf, A., Fu, Q. and Neis, P., 2014. Quality Assessment for Building Footprints Data on OpenStreetMap. International Journal of Geographical Information Science 28 (4): 700-719.
Flanagin, A. and Metzger, M., 2008. The credibility of volunteered geographic information. GeoJournal, 72, 137–148.
Foody, G. M. et al., 2013. Assessing the accuracy of volunteered geographic information arising from multiple contributors to an internet based collaborative project. Transactions in GIS 17, pp. 847-860.
Foody, G. M., L. See, S. Fritz, M. Van der Velde, C. Perger, C. Schill, D. S. Boyd, and A. Comber, 2005. Accurate attribute mapping from volunteered geographic information: issues of volunteer quantity and quality. The Cartographic Journal.
Fritz, S., See, L., van der Velde, M., Nalepa, R.A., Perger, C., Schill, C., McCallum, I., Schepaschenko, D., Kraxner, F., Cai, X., Zhang, X., Ortner, S., Hazarika, R., Cipriani, A., Di Bella, C., Rabia, A.H., Garcia, A., Vakolyuk, M., Singha, K., Beget, M.E., Erasmi, S., Albrecht, F., Shaw, B., and Obersteiner, M., 2013. Downgrading recent estimates of land available for biofuel production. Environmental Science & Technology, 47 (3), 1688–1694.
GeoNames 201. GeoNames vailable at URL http://www.geonames.org/
Ghosh, S., Huyck, C. K., Greene, M., Gill, S. P., Bevington, J., Svekla, W., DesRoches, R., and Eguchi, R. T., 2011, Crowdsourcing for rapid damage assessment: the Global Earth
Observation Catastrophe Assessment Network (GEO-CAN), Earthquake Spectra, 27, S179-S198.
Goodchild, M.F., 2007. Citizens as sensors: the world of volunteered geography. GeoJournal, 69 (4), 211–221.
Goodchild, M. F., and Li, L., 2012. Assuring the quality of volunteered geographic information. Spatial statistics, 1, pp. 110-120.
Haklay, M., 2010. How good is volunteered geographical information? A comparative study of OpenStreetMap and Ordnance Survey datasets. Environment and Planning B: Planning and Design, 37, 682–703.
Haklay, M., Basiouka, S., Antoniou, V., and Ather, A., 2010. How many volunteers does it take to map an area well? The validity of Linus’ Law to volunteered geographic information. The Cartographic Journal, 47 (4), 315–322.
Hecht, R., Kunze, C., and Hahmann, S., 2013. Measuring completeness of building footprints in OpenStreetMap over space and time. ISPRS International Journal of Geo-Information, 2 (4), 1066–1091.
Jiguet, F., 2009. Method learning caused a first-time observer effect in a newly started breeding bird survey. Bird Study. 56(2): 253–258.
Jokar Arsanjani, J., Helbich, M., Bakillah, M., and Loos, L., 2013. The emergence and evolution of OpenStreetMap: a cellular automata approach. International Journal of Digital Earth, 1–15.
Kerle, N.: Disaster mapping by citizens is limited, Nature, 517, 438-438, 2015.
Kerle, N., and Hoffman, R. R., 2013, Collaborative damage mapping for emergency response: the role of Cognitive Systems Engineering, Natural Hazards and Earth System Sciences, 13, 97-113.
Neis, P., Zielstra, D., and Zipf, A., 2011. The street network evolution of crowdsourced maps: OpenStreetMap in Germany 2007–2011. Future Internet, 4 (4), 1–21.
Newman, G., Zimmerman, D., Crall, A., Laituri, M., Graham, J., and Stapel, L., 2010, User-friendly web mapping: lessons from a citizen science website, International Journal of Geographic Information Science, 24, 1851-1869.
Salk, C.F., Sturn, T., See, L., Fritz, S., and Perger, C., 2015. Assessing quality of volunteer crowdsourcing contributions: lessons from the Cropland Capture game. International Journal of Digital Earth.
Schepaschenko, D., See, L., McCallum, I., Schill, C., Perger, C., Baccini, A., Gallaun, H., Kindermann, G., Kraxner, F., Saatchi, S., Obersteiner, M., Santoro, M., Schmullius, C., Shvidenko, A., and Schepaschenko, M., 2012. Observing Forest Biomass Globally. Earthzine.
See L., Comber A., Salk C., Fritz S., van der Velde M, et al., 2013. Comparing the Quality of Crowdsourced Data Contributed by Expert and Non-Experts. PLoS ONE 8(7): e69958.
See, L., Fritz, S., Perger, C., Schill, C., McCallum, I., Schepaschenko, D., Duerauer, M., Sturn, T., Karner, M., Kraxner, F., and Obersteiner, M., 2015. Harnessing the power of volunteers, the internet and Google Earth to collect and validate global spatial information using Geo-Wiki. Technological Forecasting and Social Change.
See, L., Sturn, T., Perger, C., Fritz, S., McCallum, I., and Salk, C., 2014. Cropland Capture: A gaming approach to improve global land cover. In: 17th AGILE International Conference on Geographic Information Science. Castellon, Spain.
Sturn, T., Wimmer, M., Salk, C., Perger, C., See, L., and Fritz, S., 2015. Cropland Capture – A game for improving global cropland maps. Presented at the Foundation of Digital Games Conference (FDG 2015), Pacific Grove CA.
Wehn, U., Rusca, M., Evers, J., & Lanfranchi, V. (2015). Participation in flood risk management and the potential of citizen observatories: A governance analysis. Environmental Science & Policy, 48, 225–236.