WIMUAS: DEVELOPING A TOOL TO REVIEW WILDLIFE DATA FROM VARIOUS
UAS FLIGHT PLANS
J. Linchant a, *, S. Lhoest a, S. Quevauvillers a, J. Semeki b, P. Lejeune a, C. Vermeulen a,
a
Dept. BIOSE, Gembloux Agro-Bio Tech, University of Liège, 2 Passage des Déportés, 5030 Gembloux, Belgium – [email protected], [email protected], (samuel.quevauvillers, p.lejeune, cvermeulen)@ulg.ac.be b
Département des Eaux et Forêts, Faculté de Gestion des Ressources Naturelles Renouvelables, Université de Kisangani, BP 2012, Kisangani, Democratic Republic of Congo – [email protected]
KEY WORDS: UAS, drone, wildlife inventory, detection, data processing, sampling area, flight plan
ABSTRACT:
To get around UAS limitations and propose a viable solution for wildlife monitoring, the development of new inventory methods is needed. However, most authors use the classic systematic transect method as data processing and statistics are easier. We thus created an application to process data from every type of flight plan and tohelp detect and compare observations on large datasets. WiMUAS is a small software compatible with the open-source QGIS© that allows the creation of visual maps compatible with geographical information systems based on telemetry data and payload parameters to estimate the covered area. The application also has a slider for animal detection that allows multiple observers to record and compare their results for accurate counts. We then tested it on data from a trial realized on savannah animal populations in Democratic Republic of Congo using the Falcon UAS. We created a new type of flight plan, a rosette-shaped design that can be covered in three flights,.and repeated it twice. More than 5000 images were collected during the six flights. Image projection gives an area of 12,4 km2 for the first trial and of 12,1 km2 for the second. The mean sampling rate for both test is 6,1 %. Observers spotted buffaloes, hippos, warthogs and various antelopes with different success over an average rate of 8 images reviewed per minute. Resulting densities observed by the three observers are similar for each test (coefficient of variation 6,9 and 8,6 % respectively) but mean densities vary a lot between the two trials (23,8 and 6,5 animals/km2 respectively).
1. INTRODUCTION
Regular, standardized animal population inventories are considered a wildlife management key to help monitor and preserve these populations (Jachmann, 2001). Because of all the difficulties inherent in classical manned aerial surveys, civil Unmanned Aerial Systems (UAS) open a door to new solutions (Vermeulen et al., 2013). The emerging technology, being safer, non-intrusive, potentially less costly in terms of material and logistics, and having a high spatial and temporal resolution, has triggered interest in the wildlife monitoring community. UAS could be especially useful in difficult areas such as developing countries facing heavy threats against their environment (Martin et al., 2012; Watts et al., 2010).
Nevertheless, a long road remains before UAS become a viable alternative to replace typical field methods. Indeed, small UAS have some major constraints such as low endurance and range, sensor resolution, and the huge amount of data to be reviewed. These limitations will rapidly force researchers to develop new protocols and sampling plans to collect and review wildlife data. UAS has the great advantage of providing accurate flight parameter files and permanent data such as photos and videos. However, without easy and fast methods to review and analyse the huge datasets and provide accurate statistics, UAS will not be viable for efficient wildlife survey (Linchant et al., In press).
In most cases and particularly in large areas such as African savannahs, aerial transect surveys with light aircrafts remain the best alternative to count large animals (Jachmann, 2001). Since endurance and range are two of the main constraints of UAS, an efficient inventory method must take that into account to minimize useless run-arounds. Indeed, a lot of energy and flight time are lost in turns where no valuable data are usually
taken. Finding suitable take-off sites may also be difficult as it is often necessary to use open high grounds to get the best communication with the UAV. The time needed to go on site and to set-up the material is another constraint. It is thus important to limit the number of take-off sites and use them at their best. Small UAV often having less than two hours of endurance, several flights per day could then be done from one starting point to maximize efficiency. Therefore, the classic transect method may not be the most appropriate. Indeed, a lot of flight time is used just travelling between transects. Strindberg & Buckland (2004) proposed a zigzag transects method to avoid wasting that time during traditional inventories. However, the problem of limited sites and time lost to come back after completing the flight plan remains.
Most drones offer different possibilities for various and more complex flight plans, but processing of the acquired data and accurate statistics are not always available. To date, more researchers therefore stayed to the worldwide used, proven transect inventory plans, acknowledging the need for a better solution (Linchant et al., In press).
Another constraint is the sensor resolution and the sampling area. Digital surveys such as drone surveys cover less surface compared to human observations. Indeed, sensors usually cover a very narrow band strip when aerial visual surveys can cover large strips. This results in a lower sampling rate compare to visual surveys and differences in abundance estimates. Buckland et al. (2012) compared digital still and video method with visual method and obtained much higher estimates with digital method. This raises the question of whether those estimations are comparable. If digital surveys are to replace classic visual surveys, it is important that they can be compared in order to assess trend in populations. Two strategies are then possible: (i) working with unbiased estimations directly The International Archives of the Photogrammetry, Remote Sensing and Spatial Information Sciences, Volume XL-3/W3, 2015
comparable from both methods, or (ii) calibrating the approaches with a correction factor. These considerations are also valid if different flight plan types are used. New methods and statistics then appear as completely necessary.
The last important drawback for the use of UAS is the large datasets acquired with every flight as reviewing all those data after every mission is time consuming. Accurate, fast estimations of animal populations are needed to take measures to preserve populations. A few authors developed automatic detection procedures with success but they mainly focused on highly contrasting gregarious animals such as wading birds (Abd-Elrahman et al., 2005; Chabot & Bird, 2012; Grendzdörffer, 2013). Automatic detection of other animals in more various environments is more complicated and few attempts have been made to use automatic recognition. Bolger et al. (2012) have developed an application for automatic recognition of animals in the case of mark-recapture surveys based on skin-color patterns. Some commercial companies such as Wipsea (www.wipseas.com) now also offer to develop algorithms for animal detection on aerial photos but successes remain anecdotic and often focus on one particular species. To our knowledge, there is no software or extensions of software dedicated to the automatic or manual processing or analysis of data from complete aerial wildlife surveys in tropical regions. At most, one can find some GIS functions for preparing sampling plans (www.qgis.org). The closest that can be found in conservation is SMART software that allows the collection, the storage and the analysis of data related to conservation activities or collected by law enforcement patrols (http://smartconservationtools.org/).
In this study, we assessed two main challenges, the evaluation of the surface covered during a flight and thus the sampling area with a new type of flight plan (a rosette-shaped plan), and efficient animal detection on thousands of photos. To overcome those challenges we developed a small application working with the open-source QGIS© software to treat the data from UAS wildlife inventories. We then tested it on data from a trial realized on savannah animal populations in Democratic Republic of Congo. The application starts with the selection of photos and detection of animals to the flight parameters analysis and the estimation of covered areas, providing visual maps compatible with geographical information systems (GIS).
2. MATERIAL AND METHOD 2.1 Data acquisition
2.1.1 Study area: We ran this test in the Garamba complex of protected areas situated in North-Eastern Democratic Republic of Congo, at the border with South Sudan. This complex of protected areas is composed of Garamba National Park which has a superficie of 5130 km2 and its three surrounding hunting reserves, Gangala Na Bodio, Mondo Missa, and Azande, which have a total of 9664 km2 (Figure 1). The park, located in the transition area between the Guineo-Congolese and the Guineo-Sudanese endemism centers, is covered by a mosaic of grass and tree savannahs, while dry forests and riverine forests cover the hunting reserves. Savannahs are dominated by Hyparrhenia and Loudetia spp. with Kigelia africana and Vitex donniana representing most of the tree layer. Rain season goes from March to November and a short dry season is observed between December and February.
We collected a first dataset of wildlife inventory images in the
open savannahs of Garamba National Park. The park is home for some of the last populations of endangered species in Congo such as elephants (Loxodonta africana), giraffes (Giraffa camelopardalis congoensis), buffaloes (Syncerus caffer), lions (Panthera leo), and various antelopes.
The trial took place in the course of September and October 2014, in the late rain season, when the grass is already high.
Figure 1. Study area, Garamba complex of protected areas at the border of South Sudan. The national park alone is more than
5000 km2of open savannah
2.1.2 Platform and sensor: We used the Falcon UAS, to collect the images (Photo 2). This small fixed-wing is electrically powered, has a wingspan of 2,5 m and weights 6 kg. It has an endurance of around 1h and an average speed of 50 km/h. The small UAV (unmanned aerial vehicle) is equipped with the autopilot APM©, and flight plans and control of the plane are managed from the ground control station with the open source software Mission Planner©. Data transmission range through digital radio link is around 10 km in an open space with no obstacles such as tall trees and hills. Past that distance the UAV can fly on autopilot but no flight monitoring is possible and flight information are not transmitted. Take-off is performed with a bungee and landing is either on the belly or with a parachute.
Photo 2. Falcon UAV, an electric-powered fixed-wing of 2,5 m wingspan
For this test the drone was equipped with a Sony Nex7 digital still camera (24 MP) and two small video cameras with direct retransmission for situation during flight. The payload is not mounted on a gimbal and photo orientation is therefore related to the plane.
2.1.3 Flight plans: Since endurance and range are the main constraints for UAS-based surveys, we decided to minimize the flight time lost between effective strips during the inventory and take advantage of its maximal range and suitable take-off site. We therefore decided to set up a new inventory sampling plan the shape of rosettes (“flower” flight plan) centred in one point. Indeed, a rosette pattern intuitively appears as the most efficient design as the UAV always start from the take-off point and the entire strip covered from there is considered valid data for the inventory. It also allows the UAV to fly to its maximal range in every direction and the different “petals” of the rosette can be systematically dispersed. Rosette shapes are also easy to create and only a few waypoints are necessary for the UAV to follow the design. This is a major advantage considering the time needed to create the flight plan. Transects, even zigzag transects, or other various designs such as concentric circles, always include some flight time to reach a start point or come back at landing site. They also require the creation of more waypoints. Moreover, systematic transects are limited by the circular shape of the communication range.
One Falcon flight can cover around 40 km of effective flight (with time saved for climbing and landing) and previous trials showed that three flights can be done safely per day. We thus proposed a rosette with 6 petales (each being a triangle of 20 km) separated by 30° angles and included in a 8 km radius circular area. Two petals are covered by flight for a total inventory of 120 km (Figure 3). The 8 km radius allows a safety zone from the maximal communication range to provide prevent loss of communication in case of reduced capabilities due to small obstacles.
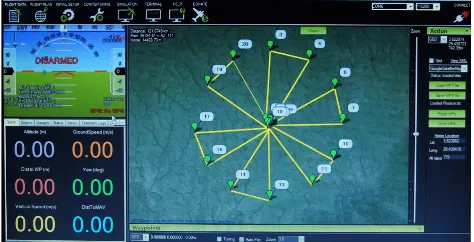
Figure 3. Rosette flight plan designed on Mission Planner©
The trial was repeated twice over the same area at an average flight altitude of 100 m as it was previously assessed a good compromise between detection and covered band. The overlap between photos was respectively 60 % and 80%.
2.2 Data processing
The next challenge was to analyse and process all the data acquired during the flights. We then developed a small application functioning as a plugin of the open source QGIS© software called WiMUAS (standing for Wildlife Monitoring with UAS). The development criteria were the possibility to have an application allowing both the introduction and management of all the flight parameters and their repercussion
on the sampling estimation, as well as the quick manual detection of observations on the images by different observers and the resulting statistics.
3. RESULTS
3.1 Flight parameters and sampled surface estimation Six flights were performed in two half days in order to complete one complete flight plan per morning. The flight parameters (position, roll, pitch, yaw) are recorded in a telemetry log file on the ground control station by Mission Planner© during the flight and can be recovered from the control station. Photos were downloaded from the camera after each flight.
When opened, WiMUAS software will first display a list of all flights with general information such as flight time, weather conditions, and camera settings, recorded by the operator. The operator can add a new flight and manually write that information, or double-click to open an existent flight. When double-clicking, a flight window opens with all the information and the possibility to enter the access link to the flight data (Figure 4). WiMUAS requires all data from one flight to be grouped in one file (log files, photos, other interesting documents). From that window, users can chose to create a polygon shapefile of the sampling area using the telemetry parameters recovered by Mission Planner© or to access the animal detection slider.
Figure 4. Flight window used to include information about the flight (weather conditions, camera settings, flight time, …).
Access links to data and log files must be provided in the window. Buttons on the bottom right side open feature detection
and shapefile creation of the sampling area.
To create the shapefile of the sampling area, WiMUAS needs a location file (text file) associating every photo with the UAV geographical position and yow, pitch, roll parameters during the flight. That location file can be created using the georeferencing tool provided by Mission Planner©. The software pairs the times marked in the telemetry file and on the photos as far as the time offset between the two blocks of data is correctly estimated. WiMUAS then uses the positions and angles of all photos to project them into a polygon shapefile based on the flight altitude.
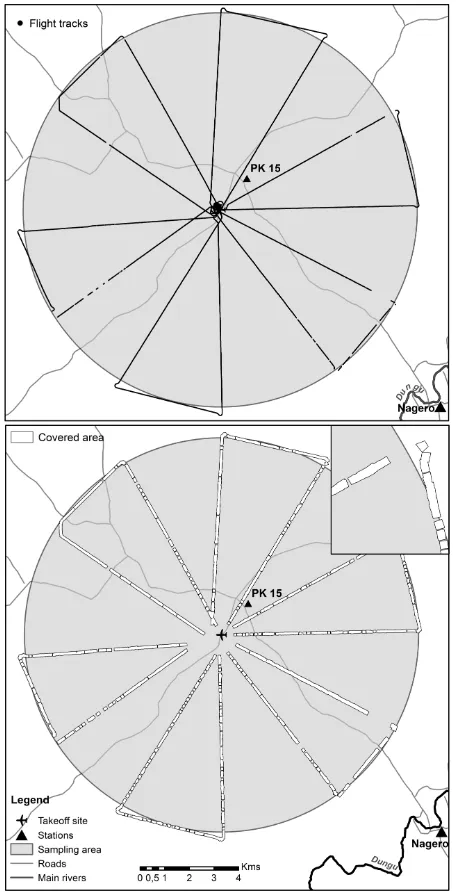
More than 5000 images were collected during the six flights. Every photo associated with a geographical position and thus flight parameters are labelled in a resulting location text file. Since we used a fixed camera trigger distance, photos have been taken along the complete flight, including take-off and landing. We used the location file to project all the photos positions in a waypoints layer in QGIS (Figure 5, top). Images acquired outside the UAV planned flight line were then discarded manually (landing and take-off circling and climbing) to keep only images that would then be reviewed for animal detection. A total of more than 4700 images remained (see Table 6).
Figure 5. Top: UAV flight tracks for the first inventory trial. Each flight covers two triangles, starting with the North direction. Bottom: area covered by the first inventory obtained
by projecting and merging image footprints after discarding take-off and landing parts
A new location text file was then extracted for the selected images and placed in the general data file. From there the plugin took the relay. Once given the correct location the application can recover the text file with the images position and yaw, pitch
and roll parameters. The operator has to input the average flight altitude used during the mission and the sensor size. It then generates the projection of all image footprints with the expected deformations and merged them to generate the output map in a shapefile format that can be displayed in GIS (Figure 5, bottom). The projections combined for the complete sampling plan at an average flight altitude of 100 m gave a net area of 12,4 km2 for the first trial and of 12,1 km2 for the second.
Although a constant triggering distance with a strong overlap was set up, gaps, sometimes very long, can be observed. Two main reasons can explain this phenomenon. Only georeferenced images are taken into account, as no parameters are known to project the others. Also, the triggering of the camera was not always effective and images were not always taken following the demanded overlap.
Flights Trial 1 Trial 2
F 1 F 2 F 3 F1 F 2 F 3
Flight time (min) 50 45 45 50 45 50 Total photos taken 784 622 587 1300 993 1087 Photos discarded 136 90 71 130 80 179 Photos considered
for detection 648 532 516 1170 913 908
Blurry photos 3 2 3 15 7 3
Table 6. Number of photos taken during each flight and photo remaining after take-off and landing parts have been discarded.
Number of blurry photos amongst the photos considered for animal detection
The overall mean sampling rate for both trials considering a circular sampling area of 201 km2 around the inventory plan is 6,1 %. Figure 1 shows the influence of the 8 km radius circle in the park.
3.2 Observation detection
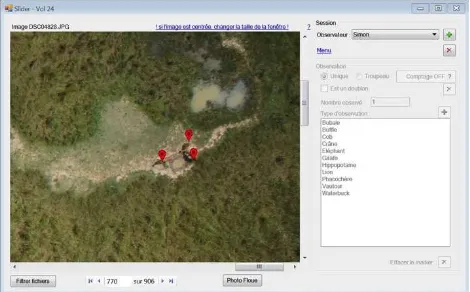
For flights where photos were taken for the purpose of wildlife inventory, we created a simple slider with a point and click tool within the same application and accessible from the flight sheet. The tool window (Figure 7) is composed on the left by the slider where every image can be reviewed with the possibility of zooming in and out for more precision. Every observer can open his own session by simply scrolling down the top right menu to find his name or add it and the observations he makes are then stored in his database. A filter allows the observers to review only the photos used to produce the surface covered map by loading the text file containing the list of georeferenced photos. A button on the bottom of the window can be used to mark blurry photos and moved them into a dedicated file. Observations are marked by double-clicking on the screen and observation types (species here) are available in a pre-existent library or can be added on the right side of the window. Single observations each has a red dot on it and group observations allows the observers to mark only once the type of observation before pointing all the objects with orange dots and have the total count made by the application. For photos with important overlap or recognizable groups, the double-counting box can be check to provide it to be in the final count. Observers can come back anytime on their selection to modify it. Finally, a comparative report can be generated for all observers, assessing the global count per type of observation and listing by number the photos where differences exist between observers. The list The International Archives of the Photogrammetry, Remote Sensing and Spatial Information Sciences, Volume XL-3/W3, 2015
of difference can then be reviewed and errors or missed objects reallocated after discussion, giving new count.
Figure 7. Three kobs marked by observer 3 using the detection and count tool. Each observer has his own set of observations
and can add it by simply double-clicking on the photo
Three observers reviewed the six flights and results of their observations totalized for each complete inventory are displayed in Table 8. They spotted buffaloes, hippos, warthogs and various antelopes with different success over an average rate of 8 images reviewed per minute. Resulting mean densities vary a lot between the two trials (23,8 and 6,5 animals/km2 respectively) but stay close enough for the three observers for each (coefficient of variation 6,9 and 8,6% respectively). After revision of all the differences, a new, more accurate count was produced that gives densities of 25,0 and 8,2 animals/km2.
Species Trial 1 Trial 2
Table 8. Comparative results of the detection by species for each trial and total once the differences between observers have
been verified and observations reallocated
4. DISCUSSION AND PERSPECTIVES 4.1 Data processing
Using the flight parameters associated with photos allows a more accurate surface estimation than simply assessing a fixed average bandwidth for the complete flight line. Indeed, the camera can be tilted, leading to distorted footprints. By automatically creating a shapefile from the georeferenced images, the application gives an easy, quick way to know the surface really covered by every flight. Lisein et al. (2013a) already proved that method to be accurate enough for that purpose. Furthermore, this method works easily for every type of flight plan and sensors. The gaps provoked by the photos that
were not matched during georeferencing can be a problem as they are a loss of information. However, with a good flight only a few are normally missing. The big gaps that occurred during our missions come from the use of telemetry log files, which are only recording on the control station when the communication important. Digital elevation models derived from moderate resolution sensors such as STRM may be integrated to the flight plan to adapt flying altitude and moderate the effect of topography or as an input in the application to reduce inaccuracies. Flight planning also needs to be created with more precision to avoid overshoot in the sampling plan (see Figure 5, top) and error in the estimation of sampling rate. Loading pre-prepared waypoints in Mission Planner© could do it.
The use of a slider with a simple point and click tool is very efficient and faster than manual counting to record and compute observations. The possibility to compare the different counts within the application to merge them can also reduce the errors and give more accurate final results. However, some improvements are still needed. The method used to review the differences requires a user to i) come back to each photos of the list, ii) switch between observers to see what they missed, and iii) write down by hand the corrections. This could be easily fixed by showing for all photos with observations the results of every observer by transparency so differences are easy to spot. Changing the observations could then be done in a copy of the database and directly treated by the application to show the final count.
Shapefiles of projected animals points are also to be developed as knowing the position of observations is very important for a lot of studies and for management. Georeferenced animal observation could then be used with habitat maps for example.
The concept of such a tool could also be extended to other applications to review large set of aerial images. With the possibility of easily creating shapfiles by clicking on photos in a slider, a lot of objects could be detected. The delineation or identification of tree crowns for example (Lisein et al., In press) could beneficiate from that sort of plugin. It could also be used to compare results from different observers and generate maps. But forestry data mostly consist in large populations and applications consist more in photogrammetric measurement of height and volume and generating canopy model (Lisein et al. 2013b). Nevertheless, this plugin is mainly about wildlife inventory and conservation and functionalities remain turned in that direction.
4.2 Inventory results
Detection differences between observers are important but not always highly visible as they tend to compensate each other in the global count. The possibility of comparing them is interesting but the dataset is too small to conclude significant statistics. Nonetheless, interesting trends are observed and lowest and highest detection rates are always performed by the same observer. This can be explained by the difference of training between them. Observers used to work with the images and to aerial count in that particular environment are expected to provide better results. Finally, the strong variation in densities between the two trials can be explained by several reasons. Wildlife in Garamba is scarce and therefore spreads The International Archives of the Photogrammetry, Remote Sensing and Spatial Information Sciences, Volume XL-3/W3, 2015
and moves in vast areas. Animals can be in totally different parts of the park between two inventories, and the small groups risk to be completely missed by the narrow transects. The low sampling rate is also a main issue and allows a lot more variations. More repetitions and several sampling plan (“flowers”) spread across the park are needed to compute more accurate statistics and develop a better estimation method.
5. CONCLUSION
By automating important steps in the process, our application proved to be useful to gain time when reviewing the huge datasets acquired by UAS inventories. Moreover, it can be used to review wildlife data from various sampling methods and flight plans since the simple processes are common to all UAV surveys. The application combined with a new sampling methods gave interesting results and opens perspectives for the use of UAV in wildlife census. Larger scale inventories are needed to collect enough data and adapt specific statistics.
ACKNOWLEDGEMENTS
The authors would like to thank the European Union (EU), the Center for International Forestry Research (CIFOR) and the Forest and Climate Change in Congo project (FCCC) as well as R&SD for granting and supporting this study. Special thanks also to the ICCN and African Park Network teams involved in the protection and management of Garamba National Park (DRC) for their support and help. Thanks also to our observers for their dutiful work on the data.
REFERENCES
Abd-Elrahman, A., Pearlstine, L., & Percival, F., 2005. Development of pattern recognition algorithm for automatic bird detection from unmanned aerialvehicle imagery. Surveying and Land Information Science, 65, pp. 37-45.
Buckland, S.T., Burt, M.L., Rexstad, E., Mellor, M., Williams, A.E., & Woodward, R., 2012. Aerial surveys of seabirds: the advent of digital methods. Journal of Applied Ecology, 49, pp. 960-967.
Bolger, D.T.., Morrison, T.A., Vance, B., Lee, D. & Farid, H., 2012. A computer-assisted system for photographic mark-recapture analysis. Methods in Ecology and Evolution, 3, pp. 813-822.
Chabot, D., & Bird, D.M., 2012. Evaluation of an off-the-shelf unmanned aircraft system for surveying flocks of geese. Waterbirds, 35, pp. 170-174.
Grenzdörffer, G.J., 2013. UAS-based automatic bird count of a common gull colony. In: The International Archives of the Photogrammetry, Remote Sensing and Spatial Information Sciences, ISPRS Inter-Commission Working Group I/V Autonomous Navigation, 36:1.
Jachmann, H., 1991. Estimating abundance of African wildlife: An aid to adaptive management. Kluwer Academic Publications, Boston, MA, USA.
Linchant, J., Lisein, J., Semeki, J., Lejeune, P., & Vermeulen, C., In press. Are UAS the future of wildlife monitoring? A review of accomplishments and challenges.. Mammal Review, accepted.
Lisein, J., Linchant, J., Lejeune, P., Bouché, P., & Vermeulen, C., 2013a. Aerial surveys using an unmanned aerial system (UAS): Comparison of different methods for estimating the surface area of sampling strips. Tropical Conservation Science, 6, pp. 506-520.
Lisein, J., Pierrot-Deseilligny, M., Bonnet, S., & Lejeune, P., 2013b. A photogrammetric workflow for the creation of a forest canopy height model from small unmanned aerial system imagery. Forests, 4(4), pp. 922-944.
Lisein, J., Michez, A., Claessens, H. & Lejeune, P., In press. Discrimination of deciduous tree species from time series on unmanned aerial system imagery. PLoS ONE, accepted.
Martin, D., Edwards, H.H., Burgess, M.A., Percival, H.F., Fagan, D.E., Gardner, B.E., Ortega-Ortiz, J.G., Ifju, P.G., Evers, B.S., & Rambo, T.J., 2012. Estimating distribution of hidden objects with drones: from tennis balls to manatees. PLoS ONE, 7:e38882.
Strindberg, S., & Buckland, S.T., 2004. Zigzag survey designs in line transect sampling. Journal of Agricultural, Biological and Environmental Statistics. 9, pp. 443-461.
Vermeulen, C., Lejeune, P., Lisein, J., Sawadogo, P., & Bouché, P., 2013. Unmanned aerial survey of elephants. PLoS ONE, 8:e54700.
Watts, A.C., Perry, J.H., Smith, S.E., Burgess, M.A., Wilkinson, B.E., Szantoi, Z., Ifju, P.G., & Percival, H.F., 2010 Small unmanned aircraft systems for low-altitude aerial surveys. The Journal of Wildlife Management, 74, pp. 614-619.