Botanical composition, soil and forage quality under different
management regimes in Russian grasslands
E.A. Mikhailova
a,∗, R.B. Bryant
a, D.J.R. Cherney
b, C.J. Post
a, I.I. Vassenev
c aDepartment of Crop and Soil Sciences, Cornell University, 905 Bradfield Hall, Ithaca, NY 14853, USAbDepartment of Animal Sciences, Cornell University, 327 Morrison Hall, Ithaca, NY 14853, USA cRussian Institute of Agronomy and Soil Erosion Control, K. Marx St., 70B, Kursk 305021, Russia
Received 11 June 1999; received in revised form 25 January 2000; accepted 10 February 2000
Abstract
Little is known on how management of Russian native grasslands affects botanical composition, soil and forage properties. Three fields were sampled in the V.V. Alekhin Central-Chernozem Biosphere State Reserve in the Kursk region of Russia: a native grassland (not cultivated for at least 300 years), a grazed/hay field with 4 years of annual harvest followed by 1 year of rest (periodically-cut grazed/hay field), and a yearly-cut grazed/hay field. Soil samples were collected from the top 10 cm and analyzed. Plant species were identified at the sampling sites and this plant material was used to determine total elemental analysis of forage, crude protein (CP), neutral detergent fiber (NDF), acid detergent fiber (ADF), in vitro true digestibility (IVTD) and lignin concentrations. Above-ground live and dead plant material and roots were analyzed for C, N and lignin. Soil sample analysis showed that fields were comparable in terms of soil chemical and physical properties. SOC and N contents were not statistically different in the native and yearly grazed/hay fields. Soil bulk density significantly increased as a result of utilization, from 0.80±0.09 Mg m−3for the native grassland to 0.97±0.06 Mg m−3for the yearly grazed/hay field. A total of 107 different plant species were recorded at the three fields. There were changes in plant composition among the fields. The native grassland field had the least number of plant species (41) followed by the yearly-cut grazed/hay field (68), and the periodically-cut grazed/hay field (87). There was a greater proportion of grass species (20%) in the native grassland field. Dead plant biomass and roots from the grazed/hay fields were higher in N and lignin concentrations. Forage mineral concentration was highest in the periodically-cut hay field. No significant differences were observed in terms of forage properties. © 2000 Elsevier Science B.V. All rights reserved.
Keywords: Native grasslands; Botanical composition; Soil quality; Forage quality; Russia
1. Introduction
Native grasslands are a unique part of the world ecosystem and it is important to preserve and maintain the genetic and ecological integrity of native
ecosys-∗Corresponding author. Tel.:+1-607-255-5414; fax:+1-607-255-2644.
E-mail address: [email protected] (E.A. Mikhailova)
tems (Richards et al., 1997). Changing social and eco-nomic values in Russia are leading to policies that seek to maximize profits obtained from agricultural land. Very often, grasslands are associated with fertile soils, and are therefore converted into high-value cash crop systems. This trend is predominant in the Kursk region of Russia, where vast areas are managed for wheat, sugar beet, sunflower and alfalfa production. These crops supplant native grasslands, thereby destroying
native ecosystems. It is estimated that there are not more than 70 plant species spread over 1440 million ha of presently cultivated landscape in the world (Al-tieri, 1999), a sharp contrast with the diversity of plant species found within 1 m2of a native grassland in the Kursk region of Russia, which can contain as many as 77 plant species (Alekhin, 1934). Tilman (1999) ar-gues that greater plant biodiversity leads to a greater stability in the ecosystems using a long-term study in Minnesota grasslands.
Conversion of native grassland to cropland with-out adequate fertilization usually leads to deteriora-tion in soil properties (Ponomareva and Nikolaeva, 1965; Afanasyeva, 1966; Mikhailova et al., 2000). Mikhailova et al. (2000) showed that cultivation of chernozems in the Kursk region of Russia can lead to SOC and N losses well beyond the plow layer (0–30 cm), down to 80 cm in a continuously cropped field and down to 130 cm in a continuously fallow field. This finding implies that the CO2 emission
from the chernozem soils as a result of cultivation may be much higher than predicted by some esti-mates. Studies on the soil biota of these grassland ecosystems showed that soil macrofauna biodiversity decreased in the following sequence: native grass-land>periodically-cut grazed/hay field>pasture>barley field>long-term continuous fallow (Pokarzhevskij et al., 1989; Pokarzhevskii and Krivolutskii, 1997).
Managing native grasslands for pasture or hay col-lection can maintain some of their unique botanical composition, soil quality and minimize CO2emission
from this soil type as a result of cultivation. There is ample data to suggest that limited harvesting, by an-imal or mechanical means, has beneficial effects on grassland ecology. Bekker et al. (1997) in a study of 38 grassland sites in western Europe concluded that lack of management resulted in the loss of grassland species from both the vegetation and the soil seed bank due to invasion of woodland species. Renzhong and Ripley (1997) also noted that species diversity was greatest at an intermediate grazing intensity and least in lightly managed areas of Leymus chinensis grass-land on the Songnen plain of northeastern China. Both of these studies indicate, however, that over-grazing or intensive management resulted in degradation of grasslands. The effects of grazing and hay collection on soil organic C and N are less understood. A review of a world-wide 236-site data set on effects of grazing
on soil and vegetation found no clear relationship be-tween species composition, root biomass, SOC and N (Milchunas and Lauenroth, 1993). These inconclusive findings demonstrate the complexity of interactions in grassland ecosystems.
The viability of native grasslands can be sustained by providing an economic incentive for keeping these lands intact or under limited utilization. The ex-ceptional botanical richness of these sites (Alekhin, 1934) has not been ignored by Kursk entrepreneurs, who have been using plants collected from the native grasslands to produce an alcoholic balsam named ‘Streletskaya Steppe’. Local farmers use these na-tive grasslands as pasture and hay collection fields. High positive correlation between nutritional quali-ties of pasture and milk products has been found in other parts of the world (Licitra et al., 1997), where botanical richness is comparable to that found in the grasslands of the Kursk region of Russia. The char-acterization of pastures by species, forage and soil quality can be used to evaluate potential economic uses (for example, production of unique milk and cheese products) of the native grasslands.
This research encompasses a field study in the V.V. Alekhin Central-Chernozem Biosphere State Reserve in the Kursk region of Russia. The study addresses the following questions: (i) How does plant composition change with different management regimes in native grasslands? and (ii) How does management of native grasslands affect soil and forage properties?
2. Materials and methods
2.1. Field sites
The Streletskyi section of the V.V. Alekhin Central-Chernozem Biosphere State Reserve of Rus-sia is located approximately 18 km south of the city of Kursk (51◦N 36◦E) (Vinogradov, 1984). Three fields were sampled in the summer of 1998. These sites are about 264 m above mean sea level (Ryabov, 1979).
2.1.1. Native grassland field
(Bromus riparius Rehm.), wild oats (Stipa pennata L.), narrow-leaved meadow grass (Poa angustifolia L.), intermediate wheatgrass (Elytrigia intermedia (Host) Nevski), meadow-sweet rose (Filipendula vul-garis Moench) and green strawberry (Fragaria viridis (Duch.). Soil organic carbon is derived dominantly from C-3 type plant species, as indicated by13C val-ues of−25‰(Mikhailova et al., 2000). Even though strictly protected from any human and domestic an-imal interference, this field is considered somewhat ‘artificial’ by the local botanists, who insist that peri-odic vegetation burning and wild animal grazing are ‘natural’ components of this system (Sobakinskih, pers. commun.).
2.1.2. Grazed/hay field with 4 years of annual harvest followed by 1 year rest (referred as periodically-cut grazed/hay field)
Originally native grassland, this field has been used for hay collection for at least 50 years. From 1981 until 1990, hay was harvested for 3 years in a row followed by 1 year of rest. Since 1990, the field has been managed with 4 years of annual harvest fol-lowed by 1 year of rest. It is used as a pasture during the spring season (1 cow per hectare) and received no additional fertilization throughout its management history (Pokarzhevskii and Krivolutskii, 1997). This management regime was chosen by the Biosphere Re-serve to simulate closely the natural cycle of periodic vegetation burning and occasional animal presence. In this experiment, sampling occurred for the first year after rest.
2.1.3. Yearly-cut grazed/hay field
Originally a native grassland site, this field has been used for yearly hay collection for at least 50 years.
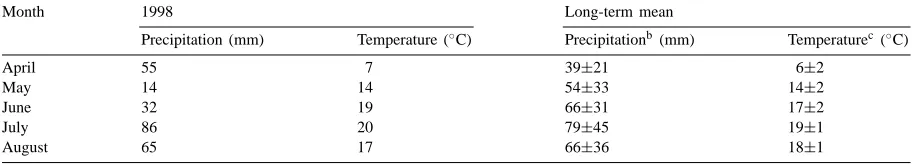
Table 1
Monthly precipitation and temperature values at the V.V. Alekhin Central-Chernozem Biosphere State Reservea
Month 1998 Long-term mean
Precipitation (mm) Temperature (◦C) Precipitationb (mm) Temperaturec(◦C)
April 55 7 39±21 6±2
May 14 14 54±33 14±2
June 32 19 66±31 17±2
July 86 20 79±45 19±1
August 65 17 66±36 18±1
aV.V. Alekhin Central-Chernozem Biosphere State Reserve, 1947–1998. b50-year average and standard deviation.
c47-year average and standard deviation.
It is used as a pasture during the spring season (1 cow per hectare), but receives no additional fertiliza-tion (Pokarzhevskii and Krivolutskii, 1997). Hay is harvested twice per year: at the end of June or the beginning of July, and in September (Mikhailova and Ivanov, 1977). According to long-term observations, the maximum number of flowering plants occurs at the end of June and this time is characterized by the high-est above-ground plant biomass, thus, determining the hay harvest period (Zmyhova, 1979).
The climate in the region is temperate, moderately cold with a mean annual precipitation of 587 mm and a mean annual air temperature of 5.4◦C (Alekhin, 1947–1997, V.V. Alekhin Central-Chernozem Bio-sphere State Reserve, 1947–1997). Table 1 shows the weather conditions during the growing season of 1998 and the long-term averages.
All sampled sites have soils developed on deep loess deposits. They are classified as fine-silty, mixed, frigid Pachic Hapludolls (Soil Survey Staff, 1998), corre-sponding to the highly carbonated chernozem, leached chernozem and faunal-pedoturbated chernozem com-plex in the Russian Soil Classification System.
2.2. Sampling procedure
fields. Two adjacent quadrats of 0.25 m2 each were placed at each of the eight sampling sites within the field, and plant species found within these areas were identified. Plant species names were verified and up-dated to accepted taxa when necessary according to Czerepanov (1995). Botanical descriptions were kept separate for the two quadrats within each site, but the plant samples were combined for further labora-tory analysis for two quadrats (total of 16 quadrats) for each of the sampling sites resulting in eight sam-ples per field. All plant material (including roots) was manually collected within the quadrats and separated into live plant material, dead plant biomass and roots. Samples were combined for further laboratory anal-ysis for two quadrates for each of the sampling sites resulting in eight samples of live plant material, dead plant material, and roots per field.
Soil samples were collected from 0–10 cm depth in-crement at each of the eight sampling sites and com-bined to form one composite soil sample representing each field. Bulk density measurements were done in the native grassland and yearly-cut grazed/hay fields.
2.3. Laboratory methods
Soil samples were air dried, manually crushed, and passed through a 2-mm mesh sieve. Particle-size distri-bution was determined for each sample by the pipette method after pretreating for carbonates and soluble salts with 1 M NaOAc (adjusted to pH 5), and removal of organic matter with 30% H2O2(Gee and Bauder,
1986). Oven-dry bulk densities were determined for each sampled site.
Soil pH was measured in a 1:1 soil/water suspension (McLean, 1982). Exchange acidity was determined us-ing BaCl2-triethanolamine buffered at pH 8
accord-ing to Method S1840 of the Cornell Nutrient Analysis Laboratory (CNAL) (Greweling and Peech, 1965). Ex-changeable cations were obtained with 1 M NH4OAc
at pH 7.0 using a Zero-Max E2 vacuum extractor as de-scribed in Method S2030 of the CNAL (McClenahan and Ferguson, 1989). Cation-exchange capacity was determined by summation of cations. Exchangeable Al was extracted with 1 M KCl and analyzed by the induc-tively coupled argon emission plasma (ICAEP), JY70 Type II using Method S2510 of the CNAL (McClena-han and Ferguson, 1989). Total N and soil organic C were determined by dry combustion-mass
spectrome-try using a Robo-prep-Tracemass system, Europa Sci-entific (Cheshire, UK). Total elemental analysis of soil by wet ash digestion (HNO3–HClO4) was performed
according to Ritter et al. (1978).
Plant samples were thoroughly mixed, dried at 60◦C for 72 h, and ground to a 1 mm particle size in a cyclone mill (Udy Corp., Fort Collins, CO) in prepa-ration for chemical analyses. Whole-plant N con-centration was determined by dry combustion-mass spectrometry using a Robo-prep-Tracemass system, Europa Scientific (Cheshire, UK). Samples (0.5 g) were analyzed sequentially for neutral detergent fiber (NDF), acid detergent fiber (ADF), and acid deter-gent lignin using procedures described by Van Soest et al. (1991), except that the filter bag technique was used with the ANKOM200/220fiber analyzer. Sodium sulfite and heat-stable a-amylase was used on all samples. In vitro true digestion (IVTD ) concentration was determined according to Cherney et al. (1997), using the rumen buffer fluid described by Marten and Barnes (1980) and using the Daisy II200/220 in vitro incubator and the ANKOM200/220 fiber analyzer. The buffer contained urea. Ruminal fluid inoculum was obtained from a nonlactating, rumen-fistulated Hol-stein cow, fed on a medium quality orchard grass hay diet for ad libitum intake. Samples (0.25 g) were incubated for 48 h at 39◦C, followed by treating the
undigested residue with neutral detergent. Total ele-mental analysis of forage was performed according to Greweling (1976). All measured concentrations are expressed on a dry matter basis.
All statistical calculations in this study were performed using the Minitab® statistical software program (Ryan and Joiner, 1994).
3. Results and discussion
Table 2
Selected soil physical properties in 0–10 cm of soila
Site Munsell color Particle-size distribution (%) Texture
class
Bulk density (Mg m−3)
Moist Dry Total sand Total silt Total clay CSi MSi Fsi >50mm 2–50mm <2mm 50–20mm 20–5mm 5–2mm
Native 10YR 2/1 10YR 3/1 2.0 66.8 31.2 22.9 38.1 5.8 sicl 0.80±0.09 ac 4-Cut, 1-rest 10YR 2/1 10YR 3/1 11.8 58.3 29.9 23.4 25.6 9.3 sicl NDb Yearly-cut 10YR 2/1 10YR 3/1 8.4 61.3 30.3 24.2 28.4 8.7 sicl 0.97±0.06 bc
aMeasurements were done on the composite sample. bND: Not determined.
cMean and standard deviation of replicate samples. Means followed by different lowercase letters within a column are significantly
different at p=0.05 Tukey’s W Procedure for multiple comparisons (Mikhailova et al., 2000).
Table 3
Selected soil chemical properties in 0–10 cm of soila
Site pHH2O Organic C (%) Total N (%)
NH4OAc extract KCl
extract Ca
(cmol kg−1)
Mg (cmol kg−1)
K (cmol kg−1)
Na (cmol kg−1)
Base saturated (%)
Al (cmol kg−1)
Exchange acidity (cmol kg−1)
CEC (cmol kg−1)
Native 5.8 5.53±0.27b 0.54±0.04b 21.25 3.21 0.483 0.148 66 2.50 13.61 38.01
4-Cut, 1-rest 6.4 6.88 0.65 23.97 3.48 0.542 0.357 72 2.10 13.09 39.22 Yearly-cut 6.6 5.55±0.77b 0.49±0.08b 25.29 3.44 0.260 0.368 77 1.00 12.04 38.18
aMeasurements were done on the composite sample.
bMean and standard deviation of five replicate samples (Mikhailova et al., 2000).
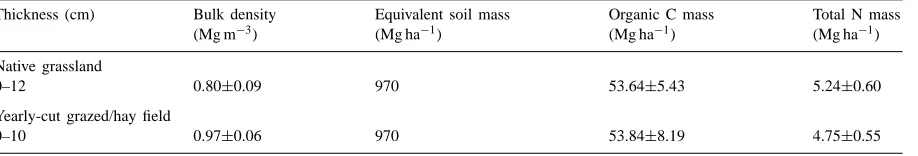
and yearly-cut grazed/hay field based on five replicate samples. Soil organic C and N contents were also compared using the ‘equivalent soil mass’ approach (Ellert and Bettany, 1995), taking into account an increase in bulk density in the yearly-cut grazed/hay field (Table 4). There were also no differences in SOC and N contents between native grassland and the yearly-cut grazed/hay field. The periodically-cut grazed/hay field showed higher concentrations of SOC and N, but these measurements were made on a composite sample and lack of standard deviation did not allow statistical comparison with other treatments. Reported data shows that 50 years of hay collection
Table 4
Soil organic C and N contents based on ‘equivalent soil mass’ in 0–10 cm of soil
Thickness (cm) Bulk density Equivalent soil mass Organic C mass Total N mass
(Mg m−3) (Mg ha−1) (Mg ha−1) (Mg ha−1)
Native grassland
0–12 0.80±0.09 970 53.64±5.43 5.24±0.60
Yearly-cut grazed/hay field
0–10 0.97±0.06 970 53.84±8.19 4.75±0.55
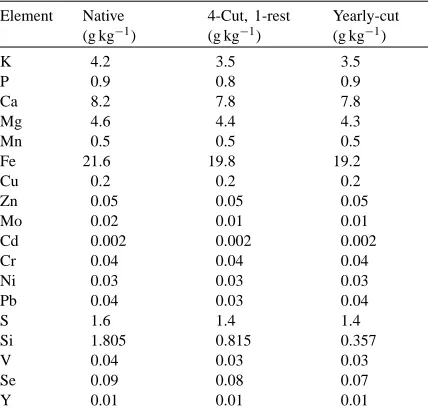
Table 5
Total elemental analysis of soil determined by wet ash digestion (HNO3–HClO4)a
Cd 0.002 0.002 0.002
Cr 0.04 0.04 0.04
Ni 0.03 0.03 0.03
Pb 0.04 0.03 0.04
S 1.6 1.4 1.4
Si 1.805 0.815 0.357
V 0.04 0.03 0.03
Se 0.09 0.08 0.07
Y 0.01 0.01 0.01
aMeasurements were done on the composite sample.
grazed/hay field has 50% less root biomass than the native grassland. Studies on rangeland soil carbon and nitrogen responses to grazing in Wyoming showed that 12 years of grazing increased the amounts of C and N in the surface soil (Schuman et al., 1999).
A total of 107 different plant species were recorded at the three fields in the summer of 1998. The native grassland field had the least number of plant species (41) followed by the yearly-cut grazed/hay field (68), and the periodically-cut grazed/hay field (87). Accord-ing to the classification of Raunkiaer (1934) (Table 6), most of the species at each of the sampling fields are
Table 6
The biological spectrum for three sampled sites according to Raunkiaer (1934)
Site Distribution of the species among the life forms (%)a
N C HC H HT TH T G
Native grassland 2 2 2 72 – – 5 17
4-Cut, 1-rest 1 2 1 79 – 2 6 9
Yearly-cut 1.5 1.5 1.5 79 3 1.5 3 9
aN: Nanophanerophytes; C: Chamaephytes; HC:
Hemicryptophyte-Nanophanerophyte; H: Hemicryptophytes; HT: Hemicryptophyte-Therophyte; TH: Therophyte-Hemicryptophyte; T: Therophytes; G: Geophytes.
hemi-cryptophytes (72–79%; plants that die back un-der conditions unfavorable for growth and propagate through buds at the ground level), followed by geo-phytes (9–17%; wintering buds are located in the soil) and therophytes (3–6%; annual plants, wintering as seeds). This distribution of life forms is common for meadows in Russia and western Europe (Rabotnov, 1974, p. 64). A decrease in proportion of geophytes at the native grassland field can be explained by soil compaction as a result of hay collection and grazing. Usually the number of geophytes is increasing with improved soil aeration (Rabotnov, 1974, p. 65).
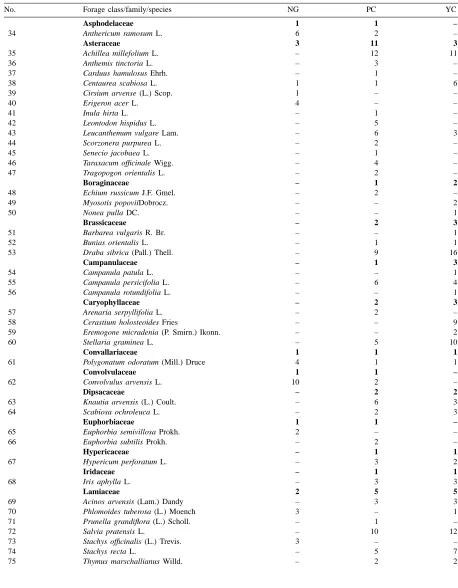
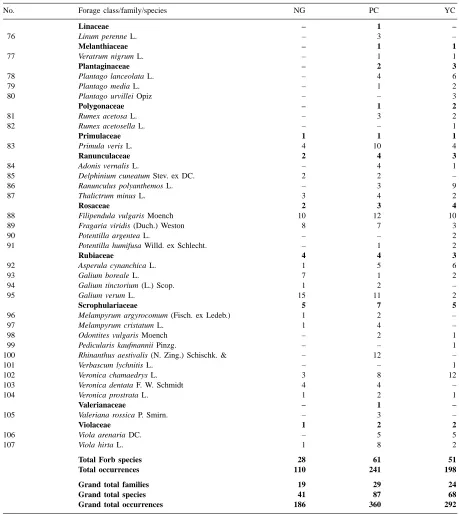
Tables 7 and 8 present a more detailed inventory of plants arranged by family and sampling site. The
Table 7
Botanical composition by family
No. Family Number of speciesa
NG 4C-1R YC
1 Alliaceae 1 1 1
2 Apiaceae 1 3 2
3 Asclepiadaceae 1 – –
4 Asparagaceae 1 – –
5 Asphodelaceae 1 1 –
6 Asteraceae 3 11 3
7 Boraginaceae – 1 2
8 Brassicaceae – 2 3
9 Campanulaceae – 1 3
10 Caryophyllaceae – 2 3
11 Convallariaceae 1 1 1
12 Convolvulaceae 1 1 –
13 Cyperaceae 1 2 1
14 Dipsacaceae – 2 2
15 Euphorbiaceae 1 1 –
16 Fabaceae 4 9 5
17 Hypericaceae – 1 1
18 Iridaceae – 1 1
19 Lamiaceae 2 5 5
20 Linaceae – 1 –
21 Melanthiaceae – 1 1
22 Plantaginaceae – 2 3
23 Poaceae 8 15 11
24 Polygonaceae – 1 2
25 Primulaceae 1 1 1
26 Ranunculaceae 2 4 3
27 Rosaceae 2 3 4
28 Rubiaceae 4 4 3
29 Scrophulariacea 5 7 5
30 Valerianaceae – 1 –
31 Violaceae 1 2 2
Total species 41 87 68
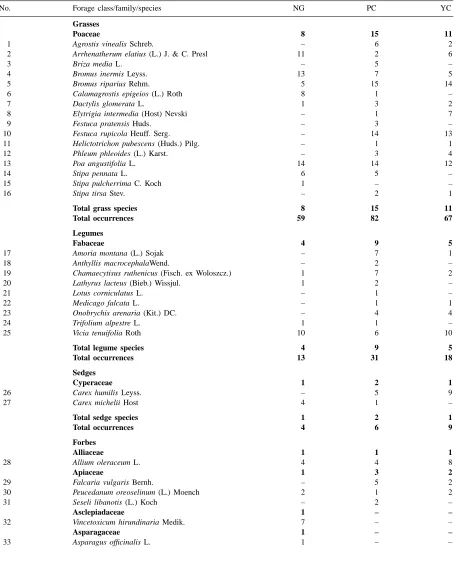
Table 8
Distribution of plants for three sampled fields classified by forage class, family and speciesa
No. Forage class/family/species NG PC YC
Grasses
Poaceae 8 15 11
1 Agrostis vinealis Schreb. – 6 2
2 Arrhenatherum elatius (L.) J. & C. Presl 11 2 6
3 Briza media L. – 5 –
4 Bromus inermis Leyss. 13 7 5
5 Bromus riparius Rehm. 5 15 14
6 Calamagrostis epigeios (L.) Roth 8 1 –
7 Dactylis glomerata L. 1 3 2
8 Elytrigia intermedia (Host) Nevski – 1 7
9 Festuca pratensis Huds. – 3 –
10 Festuca rupicola Heuff. Serg. – 14 13
11 Helictotrichon pubescens (Huds.) Pilg. – 1 1
12 Phleum phleoides (L.) Karst. – 3 4
13 Poa angustifolia L. 14 14 12
14 Stipa pennata L. 6 5 –
15 Stipa pulcherrima C. Koch 1 – –
16 Stipa tirsa Stev. – 2 1
Total grass species 8 15 11
Total occurrences 59 82 67
Legumes
Fabaceae 4 9 5
17 Amoria montana (L.) Sojak – 7 1
18 Anthyllis macrocephalaWend. – 2 –
19 Chamaecytisus ruthenicus (Fisch. ex Woloszcz.) 1 7 2
20 Lathyrus lacteus (Bieb.) Wissjul. 1 2 –
21 Lotus corniculatus L. – 1 –
22 Medicago falcata L. – 1 1
23 Onobrychis arenaria (Kit.) DC. – 4 4
24 Trifolium alpestre L. 1 1 –
25 Vicia tenuifolia Roth 10 6 10
Total legume species 4 9 5
Total occurrences 13 31 18
Sedges
Cyperaceae 1 2 1
26 Carex humilis Leyss. – 5 9
27 Carex michelii Host 4 1 –
Total sedge species 1 2 1
Total occurrences 4 6 9
Forbes
Alliaceae 1 1 1
28 Allium oleraceum L. 4 4 8
Apiaceae 1 3 2
29 Falcaria vulgaris Bernh. – 5 2
30 Peucedanum oreoselinum (L.) Moench 2 1 2
31 Seseli libanotis (L.) Koch – 2 –
Asclepiadaceae 1 – –
32 Vincetoxicum hirundinaria Medik. 7 – –
Asparagaceae 1 – –
Table 8 (Continued)
No. Forage class/family/species NG PC YC
Asphodelaceae 1 1 –
34 Anthericum ramosum L. 6 2 –
Asteraceae 3 11 3
35 Achillea millefolium L. – 12 11
36 Anthemis tinctoria L. – 3 –
37 Carduus hamulosus Ehrh. – 1 –
38 Centaurea scabiosa L. 1 1 6
39 Cirsium arvense (L.) Scop. 1 – –
40 Erigeron acer L. 4 – –
41 Inula hirta L. – 1 –
42 Leontodon hispidus L. – 5 –
43 Leucanthemum vulgare Lam. – 6 3
44 Scorzonera purpurea L. – 2 –
45 Senecio jacobaea L. – 1 –
46 Taraxacum officinale Wigg. – 4 –
47 Tragopogon orientalis L. – 2 –
Boraginaceae – 1 2
48 Echium russicum J.F. Gmel. – 2 –
49 Myosotis popoviiDobrocz. – – 2
50 Nonea pulla DC. – – 1
Brassicaceae – 2 3
51 Barbarea vulgaris R. Br. – – 1
52 Bunias orientalis L. – 1 1
53 Draba sibrica (Pall.) Thell. – 9 16
Campanulaceae – 1 3
54 Campanula patula L. – – 1
55 Campanula persicifolia L. – 6 4
56 Campanula rotundifolia L. – – 1
Caryophyllaceae – 2 3
57 Arenaria serpyllifolia L. – 2 –
58 Cerastium holosteoides Fries – – 9
59 Eremogone micradenia (P. Smirn.) Ikonn. – – 2
60 Stellaria graminea L. – 5 10
Convallariaceae 1 1 1
61 Polygonatum odoratum (Mill.) Druce 4 1 1
Convolvulaceae 1 1 –
62 Convolvulus arvensis L. 10 2 –
Dipsacaceae – 2 2
63 Knautia arvensis (L.) Coult. – 6 3
64 Scabiosa ochroleuca L. – 2 3
Euphorbiaceae 1 1 –
65 Euphorbia semivillosa Prokh. 2 – –
66 Euphorbia subtilis Prokh. – 2 –
Hypericaceae – 1 1
67 Hypericum perforatum L. – 3 2
Iridaceae – 1 1
68 Iris aphylla L. – 3 3
Lamiaceae 2 5 5
69 Acinos arvensis (Lam.) Dandy – 3 3
70 Phlomoides tuberosa (L.) Moench 3 – 1
71 Prunella grandiflora (L.) Scholl. – 1 –
72 Salvia pratensis L. – 10 12
73 Stachys officinalis (L.) Trevis. 3 – –
74 Stachys recta L. – 5 7
Table 8 (Continued)
No. Forage class/family/species NG PC YC
Linaceae – 1 –
76 Linum perenne L. – 3 –
Melanthiaceae – 1 1
77 Veratrum nigrum L. – 1 1
Plantaginaceae – 2 3
78 Plantago lanceolata L. – 4 6
79 Plantago media L. – 1 2
80 Plantago urvillei Opiz – – 3
Polygonaceae – 1 2
81 Rumex acetosa L. – 3 2
82 Rumex acetosella L. – – 1
Primulaceae 1 1 1
83 Primula veris L. 4 10 4
Ranunculaceae 2 4 3
84 Adonis vernalis L. – 4 1
85 Delphinium cuneatum Stev. ex DC. 2 2 –
86 Ranunculus polyanthemos L. – 3 9
87 Thalictrum minus L. 3 4 2
Rosaceae 2 3 4
88 Filipendula vulgaris Moench 10 12 10
89 Fragaria viridis (Duch.) Weston 8 7 3
90 Potentilla argentea L. – – 2
91 Potentilla humifusa Willd. ex Schlecht. – 1 2
Rubiaceae 4 4 3
92 Asperula cynanchica L. 1 5 6
93 Galium boreale L. 7 1 2
94 Galium tinctorium (L.) Scop. 1 2 –
95 Galium verum L. 15 11 2
Scrophulariaceae 5 7 5
96 Melampyrum argyrocomum (Fisch. ex Ledeb.) 1 2 –
97 Melampyrum cristatum L. 1 4 –
98 Odontites vulgaris Moench – 2 1
99 Pedicularis kaufmannii Pinzg. – – 1
100 Rhinanthus aestivalis (N. Zing.) Schischk. & – 12 –
101 Verbascum lychnitis L. – – 1
102 Veronica chamaedrys L. 3 8 12
103 Veronica dentata F. W. Schmidt 4 4 –
104 Veronica prostrata L. 1 2 1
Valerianaceae – 1 –
105 Valeriana rossica P. Smirn. – 3 –
Violaceae 1 2 2
106 Viola arenaria DC. – 5 5
107 Viola hirta L. 1 8 2
Total Forb species 28 61 51
Total occurrences 110 241 198
Grand total families 19 29 24
Grand total species 41 87 68
Grand total occurrences 186 360 292
most abundant species in the Poaceae family are Ar-rhenatheum elatius (L.) J. & C. Presl, Bromus inermis Leyss., Bromus riparius Rehm., Festuca rupicola Heuff. Serg., Poa angustifolia L. and Stipa pennata L. There was a decrease in number of occurrences of A. elatius (L.) J. & C. Presl, B. inermis Leyss., Calama-grostis epigeios (L.) Roth with the utilization of native grassland as a pasture and a hay source. These species have low rates of regeneration as a result of hay cut-ting and trampling (Rabotnov, 1974). In the Fabaceae family the most abundant species was Vicia tenuifolia Roth. Forbs were primarily represented by such fami-lies as Alliaceae [Allium oleraceum L.], Apiacea [Fal-caria vulgaris Bernh.], Aspholedaceae [Anthericum ramosum L.], Asteraceae [Achillea millefolium L.], Brassicaceae [Draba sibrica (Pall.) Thell.], Campanu-laceae [Campanula persicifolia L.], CaryophylCampanu-laceae [Stellaria graminea L.], Convolvulaceae [Convolvu-lus arvensis L.], Lamiaceae [Salvia pratensis L. and Stachys recta L.], Primulaceae [Primula veris L.], Roseacea [Filipendula vulgaris Moench and Fragaria viridis (Duch.) Weston], Rubiaceae [Galium verum L.], Scrophulariaceae [Veronica chamaedrys L.] and Violaceae [Viola arenaria DC. and Viola hirta L.].
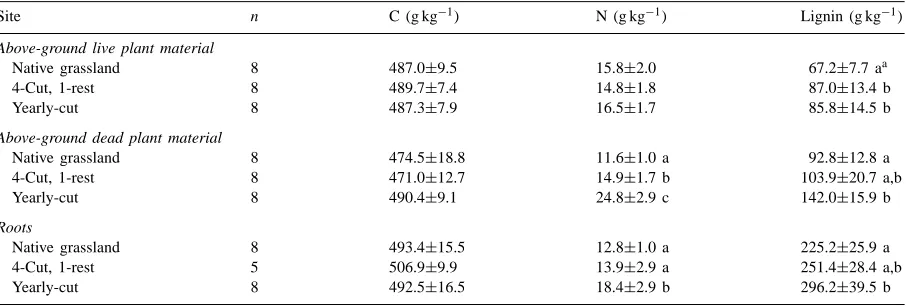
Table 9 compares C, N and lignin concentrations of above-ground plant biomass, above-ground dead plant biomass and roots. No statistical differences were found in terms of C concentrations among treatments. Nitrogen concentrations significantly in-creased in above-ground dead plant biomass and roots
Table 9
C, N and lignin concentrations in above-ground live and dead plant material and roots at three sampling sites
Site n C (g kg−1) N (g kg−1) Lignin (g kg−1)
Above-ground live plant material
Native grassland 8 487.0±9.5 15.8±2.0 67.2±7.7 aa
4-Cut, 1-rest 8 489.7±7.4 14.8±1.8 87.0±13.4 b
Yearly-cut 8 487.3±7.9 16.5±1.7 85.8±14.5 b
Above-ground dead plant material
Native grassland 8 474.5±18.8 11.6±1.0 a 92.8±12.8 a
4-Cut, 1-rest 8 471.0±12.7 14.9±1.7 b 103.9±20.7 a,b
Yearly-cut 8 490.4±9.1 24.8±2.9 c 142.0±15.9 b
Roots
Native grassland 8 493.4±15.5 12.8±1.0 a 225.2±25.9 a
4-Cut, 1-rest 5 506.9±9.9 13.9±2.9 a 251.4±28.4 a,b
Yearly-cut 8 492.5±16.5 18.4±2.9 b 296.2±39.5 b
aMean and standard deviation of replicate samples. Means followed by the same lowercase letter within a column are not significantly
different at p=0.05 Tukey’s W Procedure for multiple comparisons. Comparisons are only made within a type of plant material. Table 10
Plant composition by forage classa
Forage class Number of species. Percentage to total number of species in quadrats
Native grassland 4-Cut, 1-rest Yearly-cut
Grasses 8 20 15 17 11 16
Legumes 4 10 9 10 5 7
Sedges 1 2 2 2 1 1
Forbs 28 68 61 71 51 76
Total 41 100 87 100 68 100
aA total of 107 species were classified as grasses, legumes,
sedges and forbs.
in the periodically-cut and yearly-cut grazed/hay fields. There was a significant increase in lignin concentrations in the above-ground plant biomass, above-ground dead plant material and roots. Increase in lignin concentrations in the above-ground live plant biomass at the periodically-cut and yearly-cut grazed/hay fields can be explained by a substantial decrease in proportion of grasses, which are lower in lignin. These changes in C, N and lignin contents of various plant materials can have an impact on soil organic C and N concentrations in the long term.
proportion of forbs in the native grassland field. The same trend was recorded in terms of yields by Semenova-Tyan-Shanskaya (1966).
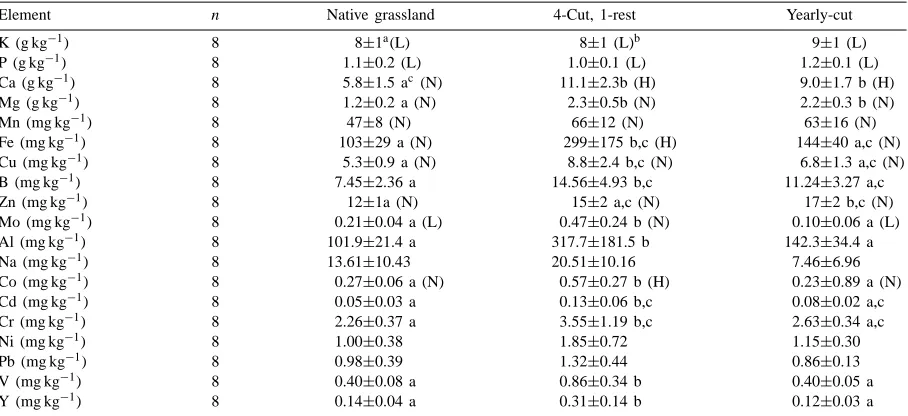
Table 11 compares the mineral concentrations of forage at the three sampled sites. Forage concentra-tions at all sites were low in potassium and phos-phorous according to the ranges of essential mineral contents of temperate pasture grasses given by Mc-Donald et al. (1995, p. 437). In terms of other essential minerals, most of their concentrations fell into the nor-mal or high ranges. The periodically-cut grazed/hay field generally had higher concentration of most of the minerals measured. This field also had the highest number of different plant species present, 87 out of 107 of total species found at all three sampling sites. The data suggests that there may be a slight shifting from monocotyledonous species to dicotyledonous species (Table 8). This shift may have resulted in ten-dency towards higher forage mineral concentrations in the fields with a cutting management, particularly the periodically-cut grazed/hay field. For example, Wilman and Derrick (1994) observed that Plantago lanceolata L., which is present in the cut fields, but
Table 11
Mineral composition of forage at three sampled fields
Element n Native grassland 4-Cut, 1-rest Yearly-cut
K (g kg−1) 8 8±1a(L) 8±1 (L)b 9±1 (L)
P (g kg−1) 8 1.1±0.2 (L) 1.0±0.1 (L) 1.2±0.1 (L)
Ca (g kg−1) 8 5.8±1.5 ac (N) 11.1±2.3b (H) 9.0±1.7 b (H)
Mg (g kg−1) 8 1.2±0.2 a (N) 2.3±0.5b (N) 2.2±0.3 b (N)
Mn (mg kg−1) 8 47±8 (N) 66±12 (N) 63±16 (N)
Fe (mg kg−1) 8 103±29 a (N) 299±175 b,c (H) 144±40 a,c (N)
Cu (mg kg−1) 8 5.3±0.9 a (N) 8.8±2.4 b,c (N) 6.8±1.3 a,c (N)
B (mg kg−1) 8 7.45±2.36 a 14.56±4.93 b,c 11.24±3.27 a,c
Zn (mg kg−1) 8 12±1a (N) 15±2 a,c (N) 17±2 b,c (N)
Mo (mg kg−1) 8 0.21±0.04 a (L) 0.47±0.24 b (N) 0.10±0.06 a (L)
Al (mg kg−1) 8 101.9±21.4 a 317.7±181.5 b 142.3±34.4 a
Na (mg kg−1) 8 13.61±10.43 20.51±10.16 7.46±6.96
Co (mg kg−1) 8 0.27±0.06 a (N) 0.57±0.27 b (H) 0.23±0.89 a (N)
Cd (mg kg−1) 8 0.05±0.03 a 0.13±0.06 b,c 0.08±0.02 a,c
Cr (mg kg−1) 8 2.26±0.37 a 3.55±1.19 b,c 2.63±0.34 a,c
Ni (mg kg−1) 8 1.00±0.38 1.85±0.72 1.15±0.30
Pb (mg kg−1) 8 0.98±0.39 1.32±0.44 0.86±0.13
V (mg kg−1) 8 0.40±0.08 a 0.86±0.34 b 0.40±0.05 a
Y (mg kg−1) 8 0.14±0.04 a 0.31±0.14 b 0.12±0.03 a
aMean and standard deviation of replicate samples.
bL: Low; N: Normal; H: High (McDonald et al., 1995, p. 437).
cMeans followed by the same lowercase letter within a row are not significantly different at p=0.05 Tukey’s W Procedure for multiple
comparisons.
Table 12
Crude protein (CP), neutral detergent fiber (NDF), acid detergent fiber (ADF), in vitro true digestibility (IVTD), and lignin concen-trations
Site n CP
(g kg−1)
NDF (g kg−1)
ADF (g kg−1)
IVTD (g kg−1)
Native 8 93.8±12.3a 654±38 385±13 661±45 4-Cut, 1-rest 8 87.2±10.4 655±45 410±27 661±45 Yearly-cut 8 97.8±9.9 677±33 425±23 620±51
aMean and standard deviation of replicate samples.
not in the native field, was higher in Mg and Ca than Lolium Perenne L., a perennial grass. Dicotyledons in general will have higher Mg and Ca concentrations than monocotyledons and this trend was observed in this study.
would most likely require some energy supplementa-tion, although these forages could provide a substantial portion of the ration for minimal cost. However, this conclusion is based on data collected in a relatively dry year, averaging only once in 4 years. Higher qual-ity can be expected in years with more typical weather conditions and time of forage harvest. Results suggest that the management schemes utilized at present are unlikely to affect forage quality as presented to the an-imal. Age at time of harvest is likely to have the most significant impact on forage quality, so these results were not unexpected (Cherney et al., 1993). The type of management systems used here would be consid-ered an extensive system, yet farmers get an economic benefit from these forages. Farmers pay nothing for the use of these grasslands during spring grazing and summer harvest.
4. Summary and conclusion
This study examined botanical composition, soil and forage quality of unique native Russian grass-lands under three management regimes. Although extensive research was done previously on the botan-ical composition of these grasslands, little was known about chemical composition of various plant materials (above-ground live plant biomass, above-ground dead plant biomass and roots), forage and soil properties under different management regimes. Results showed that utilization of native grasslands as a pasture and hay source leads to increased botanical variability, es-pecially with respect to forbs. Results also document an increase in the relative proportion of grasses in the native grasslands that are undisturbed, which agrees with earlier studies (Semenova-Tyan-Shanskaya, 1966).
Botanical changes had some impact on C, N and lignin composition of above-ground live and dead plant biomass and roots. There is an increase in N and lignin concentrations in the plant material collected at the grazed/hay fields.
Management regime has an influence on mineral composition of forages. Forage samples collected from the periodically-cut grazed/hay field had the highest mineral concentration. This management regime also yielded the greatest number of plant species, which may explain the rich mineral concentration. No
sig-nificant differences were found in forage properties in terms of crude protein and digestibility under different management regimes.
This research showed no significant deterioration in soil and forage properties as a result of 50-year utiliza-tion of the native grasslands as pastures and hay col-lection fields, except there was an increase in soil bulk at the grazed/hay collection field. There are changes in chemical composition of various plant material as a result of changes in botanical composition, but the long-term impact of these changes on the soil fertility is unclear. Preserving and managing native grasslands as a pasture or as botanically rich hay collection fields may, in fact, be a viable alternative to conversion of grasslands into high value cash crops. More work is needed to examine the variability of forage properties with time and different weather conditions.
Acknowledgements
The authors acknowledge the contributions of many people and organizations in Russia to this study. Thanks are expressed to the V.V. Alekhin Central-Chernozem Biosphere State Reserve, espe-cially N.A. Maleshin, N.I. Zolotuhin and O.S. Boiko, the Russian Institute of Agronomy and Soil Erosion Control in Kursk and its director, V.M. Volodin. The authors greatly appreciate field assistance by E.K. Daineko, V.D. Sobakinskih and Kathy Bryant. This research was supported by the Mario Einaudi Cen-ter for InCen-ternational Studies, the Cornell University Agricultural Experiment Station, Cornell University Biogeochemistry Minigrant and the Cornell Uni-versity Department of Soil, Crop, and Atmospheric Sciences. The authors thank Dr. J.W. Sturrock and the anonymous reviewers for their insightful comments.
References
Afanasyeva, E.A., 1966. Chernozemy Sredne-Russkoyi Vozvyshennosti (in Russian). Nauka, Moscow.
Alekhin, V.V., 1934. Tsentral’no-Chernozemnye Steppi (in Russian). Kommuna Publishers, Voronezh.
Alekhin, V.V., 1947–1997. Letopis’ Prirody. Central-Chernozem Biosphere State Reserve, Annual Scientific Reports, Vol. 1–63. Altieri, M.A., 1999. The ecological role of biodiversity in
Bekker, R.M., Verweij, G.L., Smith, R.E.N., Reine, R., Bakker, J.P., Schneider, S., 1997. Soil seed banks in European grasslands: does land use affect regeneration prospectives? J. Appl. Ecol. 34, 1293–1310.
Cherney, D.J.R., Cherney, J.H., Lucey, R.F., 1993. In vitro digestion kinetics and quality of perennial grasses as influenced by maturity. J. Dairy Sci. 76, 790–797.
Cherney, D.J.R., Traxler, M.J., Robertson, J.B., 1997. Use of Ankom fiber determination systems to determine digestibility. In: NIRS Forage and Feed Testing Consortium, Annual Conference and Software Training Session, February 19–20, 1997, Madison, WI.
Czerepanov, S.K., 1995. Vascular Plants of Russia and Adjacent States (the Former USSR). Cambridge University Press, Cambridge.
Ellert, B.H., Bettany, J.R., 1995. Calculation of organic matter and nutrients stored in soils under contrasting management regimes. Can. J. Soil Sci. 75, 529–538.
Gee, G.W., Bauder, J.W., 1986. Particle-size analysis. In: Klute, A. (Ed.), Methods of Soil Analysis. Part 1, 2nd Edition. Agron. Monogr. 9, ASA and SSSA, Madison, WI, pp. 383–411. Greweling, T., Peech, M., 1965. Chemical Soil Tests. Cornell
University Agricultural Experiment Station, New York State College of Agriculture, Ithaca, NY, Bulletin 960, pp. 33–35.
Greweling, T., 1976. Dry Ashing. Cornell University Agricultural Experiment Station, Search Bulletin, Vol. 6, No. 8.
Licitra, G., Carpino, S., Schadt, I., Avondo, M., Barresi, S., 1997. Forage quality of naitive pastures in a Mediterranean area. Animal Feed Sci. Technol. 69, 315–328.
Maleshin, N.A., Zolotuhin, N.I., 1994. Central-Chernozem Biosphere State Reserve named after Professor V.V. Alekhin. Part 1. World of Plants (in English). KMK Scientific Press.
Marten, G.C., Barnes, R.F., 1980. Prediction of energy digestibility of forages with in vitro rumen fermentation and fungal enzyme systems. In: Pigden, W.J., Balch, C.C., Graham, M. (Eds.). Standardization of Analytical Methodology for Feeds. Int. Devel. Res. Ctr., Ottawa, ON, Canada, p. 61.
McClenahan, M.C., Ferguson, G.A., 1989. Methods for Soil, Plant, and Water analysis. Cornell University Nutrient Analysis Laboratory, Department of Agronomy, Cornell University, Ithaca, NY.
McDonald, P., Edwards, R.A., Greenhalgh, J.F.D., Morgan, C.A., 1995. Animal Nutrition, 5th Edition. Longman, Wiley, New York.
Mc Lean, E.O., 1982. Soil pH and lime requirement. In: Page, A.L. (Ed.), Methods of Soil Analysis. Part 2, 2nd Edition. Agron. Monogr. 9, ASA and SSSA, Madison, WI, pp. 199–224. Mikhailova, N.F., Ivanov, V.D., 1977. Productivnost’ plakornyh
uchastkov Streletskoyi steppi v zavisimosti ot vneshnih uslovyi (in Russian). In: Trudy Tsentral’no-Chernozemnogo gosudarstvennogo zapovednika, Vol. 8. pp. 14–22.
Mikhailova, E.A., Bryant, R.B., Vassenev, I.I., Schwager, S.D. ,Post, C.J., 2000. Cultivation effects on soil organic carbon and total nitrogen at depth in the Russian Chernozem. Soil Sci. Soc. Am. J., in press.
Milchunas, D.G., Lauenroth, W.K., 1993. Quantitative effects of grazing on vegetation and soils over a global range of environments. Ecol. Monogr. 63 (4), 327–366.
National Research Council, 1989a. Nutrient Requirements of Dairy Cattle. National Academy Press, Washington, DC, 157 pp. National Research Council, 1989b. Nutrient Requirements of
Horses. National Academy Press, Washington, DC, 157 pp. Pokarzhevskij, A.D., Zaboev, D.P., Gordienko, S.A., Bohac, J.,
Gusev, A.A., 1989. Biogenic turnover of matter, soil biota and problems of agroecosystem development. Agric. Ecosys. Environ. 27, 281–291.
Pokarzhevskii, A.D., Krivolutskii, D.A., 1997. Problems of estimating and maintaining biodiversity of soil biota in natural and agroecosystems: a case study of chernozem soil. Agric. Ecosys. Environ. 62, 127–133.
Ponomareva, P.V., Nikolaeva, T.A., 1965. Soderzhanye i sostav gumusa v chernozemah Streletskoyi steppi pod raznymi ugod’yami (in Russian). In: Trudy Tsentral’no-Chernozemnogo gosudarstvennogo zapovednika, Vol. 8. pp. 209–235. Rabotnov, T.A., 1974. Lugovedenie (in Russian). Moscow State
University.
Raunkiaer, C., 1934. The Life Forms of Plants and Statistical Plant Geography. Oxford University Press, Oxford (Carter, Fausboll, Tansley; Trans.).
Renzhong, W., Ripley, E.A., 1997. Effects of grazing on a Leymus chinensis grassland on the Songnen plain of north-eastern China. J. Arid Environ. 36, 307–318.
Richards, R.T., Chambers, J.C., Ross, C., 1997. Use of native plants on federal lands: policy and practice. J. Range Manage. 51, 625–632.
Ritter, C.J., Bergman, S.C., Cothern, C.R., Zamierowski, E.E., 1978. Comparison of sample preparation techniques for atomic absorption analysis of sewage sludge and soil. Atomic Absorption Newslett. 17 (4).
Ryabov, V.A., 1979. Klimaticheskaya haracteristika Tsentral’no-Chernozemnogo zapovednika (in Russian.). In: Materialy statsyonarnogo izuchenya komponentov lesostepnyh zapovednyh biogeocenozov. Trudy Tsentral’no-Chernozemnogo gosudarstvennogo zapovednika, Vol. 12. Gidrometeoizdat, Leningrad, pp. 5–73.
Ryan, B.F., Joiner, B.L., 1994. Minitab Handbook, 3rd Edition. Duxbury Press, An Imprint of Wadsworth Publishing Company, Belmont, CA.
Schuman, G.E., Reeder, J.D., Manley, J.T., Hart, R.H., Manley, W.A., 1999. Impact of grazing management on the carbon and nitrogen balance of a mixed-grass rangeland. Ecol. Applications 9 (1), 65–71.
Semenova-Tyan-Shanskaya, A.M., 1966. Dynamika stepnoyi rastitel’nosti. Izdatel’stvo Nauka, Moskva-Leningrad. Soil Survey Staff, 1998. Keys to Soil Taxonomy, 8th Edition.
USDA-NRCS, Washington, DC.
Tilman, D., 1999. The ecological consequences of changes in biodiversity: a search for general principles. Ecology 80, 1455–1474.
Vinogradov, B.V., 1984. Aerospace studies of protected natural areas in the USSR. In: Conservation, Science and Society. Natural Resources Research, XXI, Vol. 2, UNESCO-UNEP, pp. 435–448.
Wilman, D., Derrick, R.W., 1994. Concentration and availability to sheep of N, P, K, Ca, Mg and Na in chickweed dandelion dock ribwort and spurrey, compared with perennial ryegrass. J. Agric. Sci. 122, 217–223.