A NOVEL APPROACH FOR EDGE DETECTION OF LOW CONTRAST SATELLITE
IMAGES
K. K. Singha,*, M. K. Bajpaia, R. K. Pandey b
a Computer Science & Engineering, Indian Institute of Information Technology, Design &Manufacturing Jabalpur, M.P., 482005 India - (koushlandras, mkbajpai)@iiitdmj.ac.in
b
Department of Mathematical Sciences, Indian Institute of Technology (BHU) Varanasi, U.P., 221005, [email protected]
KEY WORDS: Sobel Edge Detector, Fractional Order Differentiator, Chebyshev Polynomial based Approximation, Satellite Images.
ABSTRACT:
Discrimination between texture edges and geometrical edges is very difficult in low contrast images. Satellite images are low contrast images. It is important to extract the edges that are not clearly visible in case of Satellite images. The present work encompasses a new edge detection algorithm using newly constructed differentiator. Chebyshev polynomial based fractional order differentiator has been used for filtering operation on an image. High pass and Low pass filters are designed with the concept of Quadrature Mirror Filter (QMF). Pre-processing has been performed by using this filter. Sobel edge detection method has been applied on this pre-processed image. The algorithm has been tested with two different satellite images.
1. INTRODUCTION
Satellite images have texture and smoothness as a dominating features present in them. Smoothness properties of satellite images drive us to apply the low pass filtering operation that will extract the texture edges present in the images. Edge detection has been extensively analysed in computer vision and image processing field from last three decades but it has not yet been entirely solved. There is no universal detection algorithm present in literature which can detect all scales of edges, Multiscaling edge detection methods have been proposed in literature (Man, 1982), (Marrand, 1980), (Wotkin, 1983). A large set of filters exists in image processing. The detection of edges, corners and other two dimensional features have been obtained by convolving the original image with directional filters having different orientation, size and shape. Mathematical morphology, Markav fields, Derivatives based approach with linear filtering etc. are major approach for edge detection. Canny edge detection algorithm is an optimal edge detection based on derivatives of the Gaussian (Canny, 1986). The other popular algorithms for edge detections are Roberts method, Sobel method, Prewitt operators, Finite impulse response filters with large kernel such as Canny filter, First order recursive filters, Shen filter, Second order recursive filter, Deriche filter, first order derivative of Gaussian function etc. (Yuille, 1986), (Prewitt, 1970), (Canny J, 1986), (Deriche, 1990), (Shen J, 1992). Deriche et.al. has proposed a new algorithm that is more efficient in noise filtering as well as edge detection (Deriche, 1990).
Wavelet transform has been applied with canny edge detector
*Corresponding author
by Jie Hou et al (Jie, 2007). The other edge detection approaches that are popular among the researchers are differentiation based edge detection using logarithmic image processing (LIP) models , contrast-based methods, relaxation labeling techniques and anisotropic diffusion (Deng, 1998), (Johnson, 1990), (Iyengar, 1995), (Perona P, 1990).
Design of a fractional order differentiator based filter (FDD) is described in literature (Koushlendra, 2014). They have used Chebyshev polynomials for approximation of the filter function.
The present work encompasses design and development of an algorithm which uses a pre-processed image in Sobel edge detection algorithm. This pre-processing has been performed by using fractional order differentiator.
The structure of this paper is as follows. Section 2 discusses design of Chebyshev polynomial based fractional order filter. Section 3 describes newly designed algorithm for edge detection in low contrast images. Section 4 presents the details of experiments. Section 5 reports the results obtained from experiments. Section 6 describes the conclusions.
2. DESIGN OF FILTER
The detailed algorithm for design of fractional order differentiator is present in literature (Koushlendra, 2014). We are reproducing it here for better understanding.
Consider two higher order differentiable functions in as ( )
Y t and Y t( )which are observed function and original function respectively. The observed function can be written as
( ) ( ) ( )
Y t Y t t (1) here ( ) t is error. The present work encompasses smoothing of observed function by the use of nth order derivative, L point filtering window and n-degree polynomial approximation. The International Archives of the Photogrammetry, Remote Sensing and Spatial Information Sciences, Volume XL-3/W2, 2015
Any function Y t( ) can be obtained by polynomial expansion Equation (5) and (6) are used to solve equation (3). It will result
1 ˆ ( T ) T YTCT T T T YWY
(7) here Wdenotes window’s coefficient matrix. Smoothing can be performed by use of different window coefficient matrix. Riemann-Liouville fractional order derivative can be expressed as
The fractional order differentiator, corresponding to window coefficient matrix W, can be obtained by equation (8). Different properties of fractional order differentiation are applied on equation (7) and we will get (Oldham, K.B, 1974) and
The algorithm can be expressed as follow
Algorithm ( ,L n,)
Flow chart of the proposed algorithm has been shown in figure 1. The input image, I, has been normalized. The normalized image, In, has been processed with newly designed Chebyshev
polynomial based fractional order filter. The low pass filtering operation and high pass filtering operation has been performed on normalized image.
Image, Ilr, is the output image of low pass filtering operation followed by relaxation coefficient. The result of low pass filtering operation has been processed with relaxation coefficient. The relaxation coefficient varies from 0 to 2. Multiplication operation has been performed between output
( )
(
T)
Ti
W
a T T
T
Figure 1. Flow chart of algorithm
Algorithm 2
Proposed algorithm is as follow
Algorithm (IE
,
I, h0,
G0,
)Input: I, h0
,
G0,
I:
Input Image h0:
High pass filterG0
:
Low pass filter
:
Relaxation coefficient In:
Normalized imageInl
:
Filtered image with low pass filterInh
:
Filtered image with high pass filterI1
:
Intermediate ImageI'
:
Pre-processed ImageSobel ( ): Standard sobel edge detection algorithm Normalization ( ): Normalization of image
Output: IE
begin
In = Normalization (I ) Inh=h I0
(
n)
Inl = G I0
(
n)
Ilr
Inl I1
Ilr Inh IE
Sobel (I1)end
4. EXPERIMENTS
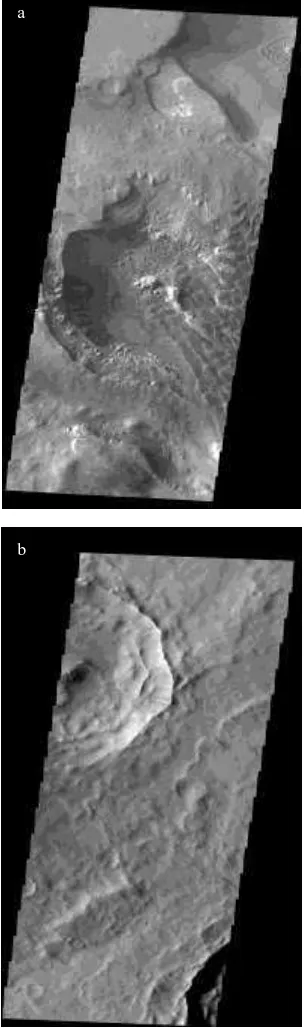
The proposed algorithm has been tested with two test images. Both satellite images are easily available in open domain (Photojournal, 2007). The images have smoothness properties as well as low contrast.
Figure 2. a) Test case 1 b) Test case 2 a
b
1 lr nh
I I I
Output Image
Relaxation on the image
,
lr nl
I I 0 2
Normalization,In
Input Image, I
Filter with High
pass FDD, Inh
Filter with Low pass FDD, Inl
Sobel Edge detector
5. RESULTS
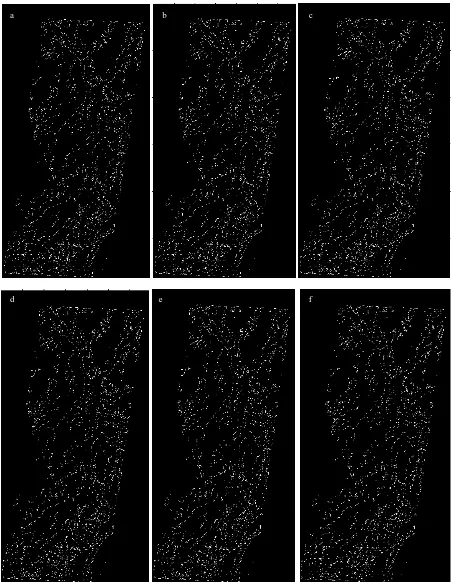
The algorithm has been tested on the images shown in Figure. 2(a) and 2(b). Figure 3 shows the results obtained by proposed algorithm for test case 1. Experiments have been performed at
0.29,L 9
for test case 1 and test case 2. Figure. 3(a),
3(b), 3(c), 3(d), 3(e) and 3(f) shows results obtained at different value of relaxation coefficient0.2, 0.7, 0.9, 1.3, 1.7and 1.9. It has been found that for lower value of relaxation coefficient we are able to extract edges accurately. .
Figure 3. Edges for test case 1 by proposed algorithm )a 0.2 b)0.7 )c 0.9 d)1.3 )e 1.7 f)1.9
Results obtained by proposed algorithm for test case 2 have been shown in Figure. 4. Order of differentiation and filter length for our experiment is 0.29 and 9, respectively. The
is0.2, 0.7, 0.9, 1.3, 1.7and 1.9. It clearly shows the edges are clearer for lower value of relaxation coefficient. Figure 5
a b c
d e f
respectively. Results clearly show that these methods are not giving satisfactory result for test case 1.
Figure 4. Edges for test case 2 by proposed algorithm at )a 0.2 )b 0.7 )c 0.9 d)1.3 )e 1.7 f)1.9
b c
a
d e f
.
Figure 6 shows the result obtained from the existing algorithms method respectively. Result of these methods clearly shows Figure 5. Edges for test case 1 by a) Prewitt method b) Sobel method c) Roberts method
Figure 6. Edges for test case 2 by a) Sobel method b) Roberts method c) Prewitt method
a b c
d e
a b c
6. CONCLUSIONS
It has been found that extracting edges in Satellite images having low contrast and smoothness properties is very difficult. The traditional masking based edge detection algorithms are not giving good results for these types of images. Design of new filter has play major part in proposed algorithm. The pre-processed input image followed by Sobel edge detector has been performing well. It has been observed that algorithm is performing well for lower values of relaxation coefficient.
REFERENCES
Canny, J., 1986. A Computational Approach to Edge Detection, IEEE Trans. Pattern Analysis and Machine Intelligence, 8 (6), pp. 679- 698. Chen, D., Chen,Y.Q., Xue, D., 2011. Digital fractional order Savitzky- Golay differentiator, IEEE Trans. on Circuits and Systems-II: Express Briefs, 58, pp. 758-762.
Deng, G., and Pinoli, J.C., 1998. Differentiation-based edge detection using the logarithmic image processing model, J. Math. Imaging vision 8 pp. 161–180.
detection”, 2007 International Conference on Wavelet Analysis and
Pattern Recognition, IEEE, USA, pp.1635-1637. http://photojournal.jpl.nasa.gov/catalog/PIA10300.
Iyengar, S.S. and Deng, W., 1995. An efficient edge detection algorithm using relaxation labeling technique, Pattern Recognition, 28 pp. 519–536.
Johnson, R.P., 1990. Contrast based edge detection, Pattern Recognition, 23, pp. 311–318.
Man, D., 1982.Vision. San Francisco, CA: Freeman.
Marrand, D. and Hildreth, E., 1980. Theory of Edge Detection, Proc. Roy. Soc. London, vol. B207, pp. 187-217.
Mitra, S.K., 2004. Digital Signal Processing: A computer based approach, McGraw-Hill India edition.
Oldham, K.B. and Spanier, J., 1974. Eds., The Fractional Calculus. New York: Academic.
Pandey R.K., Suman S., Singh Koushlendra K. and Singh O.P., 2014. An Approximate Method for Abel Inversion using Chebyshev Polynomials, Applied Mathematics and Computation, vol. 237, pp.120-132.
Perona, P., and Malik,J., 1990. Scale-space and edge detection using anisotropic diffusion, IEEE Trans. Pattern Anal. Mach. Intell. Vol. 12 pp. 629–639.
Prewitt, J.M.S., 1970. Object Enhancement and Extraction Picture Processing and Psychopictorics, B. Lipkin and A. Rosenfeld, eds., New York: Academic, pp. 75-149.
Podulubny, I., 1998. Fractional Differential Equation, Mathematics in Science & Engineering, Academic Press: California, USA.
Rivlin,T.J., 1974. The Chebyshev polynomials, John Wiley & Sons press.
Rosenfeld, A., and Thurston, M., 1971. Edge and curve detection for visual scene analysis, IEEE Trans. Cornput., vol. C-20, pp. 562-569. Shen, J, and Castan, S., 1992. An Optimal Linear Operator for Step Edge Detection Computer Vision Graphics Image Processing, vol. 54 no.2 , pp. 112-13.
Singh, K. K, Bajpai, M., K., and Pandey, R., K., 2014. Report on “A
Novel Approach for Enhancement of Geometric and Contrast Resolution Properties of Low Contrast Images”, IIITDMJ/CSE/2014/PGR0108.
Witkin, A. P., 1983. Scale-space filtering in Proc. IJCAI-8.
Yuille, A. L, and Poggio,T., 1986. Scaling theorems for zero-crossings IEEE Trans. Pattern Anal. Machine Intell., PAMI-8, pp. 15-25. The International Archives of the Photogrammetry, Remote Sensing and Spatial Information Sciences, Volume XL-3/W2, 2015