Ž .
Aquaculture 193 2001 155–178
www.elsevier.nlrlocateraqua-online
Integrated treatment of shrimp effluent by
sedimentation, oyster filtration and macroalgal
absorption: a laboratory scale study
A.B. Jones
a,b,), W.C. Dennison
a, N.P. Preston
ba
Department of Botany, The UniÕersity of Queensland, Brisbane, Qld 4072, Australia
b
C.S.I.R.O. Marine Research, CleÕeland, Qld 4163, Australia
Received 14 April 1999; accepted 25 July 2000
Abstract
Effluent water from shrimp ponds typically contains elevated concentrations of dissolved nutrients and suspended particulates compared to influent water. Attempts to improve effluent water quality using filter feeding bivalves and macroalgae to reduce nutrients have previously been hampered by the high concentration of clay particles typically found in untreated pond effluent. These particles inhibit feeding in bivalves and reduce photosynthesis in macroalgae by increasing effluent turbidity. In a small-scale laboratory study, the effectiveness of a three-stage effluent treatment system was investigated. In the first stage, reduction in particle concentration occurred through natural sedimentation. In the second stage, filtration by the Sydney rock oyster,
Ž .
Saccostrea commercialis Iredale and Roughley , further reduced the concentration of suspended
particulates, including inorganic particles, phytoplankton, bacteria, and their associated nutrients.
Ž .
In the final stage, the macroalga, Gracilaria edulis Gmelin Silva, absorbed dissolved nutrients. Pond effluent was collected from a commercial shrimp farm, taken to an indoor culture facility and was left to settle for 24 h. Subsamples of water were then transferred into laboratory tanks stocked with oysters and maintained for 24 h, and then transferred to tanks containing macroalgae
Ž . Ž .
for another 24 h. Total suspended solid TSS , chlorophyll a, total nitrogen N , total phosphorus
Ž . q y 3y
P , NH , NO , and PO4 3 4 , and bacterial numbers were compared before and after each treatment
Ž . Ž . Ž . Ž
at: 0 h initial ; 24 h after sedimentation ; 48 h after oyster filtration ; 72 h after macroalgal .
absorption . The combined effect of the sequential treatments resulted in significant reductions in the concentrations of all parameters measured. High rates of nutrient regeneration were observed
)Corresponding author. Department of Botany, The University of Queensland, Brisbane, Qld 4072, Australia. Tel.:q61-7-3365-4132; fax:q61-7-3365-7321.
Ž .
E-mail address: [email protected] A.B. Jones .
0044-8486r01r$ - see front matterq2001 Elsevier Science B.V. All rights reserved.
Ž .
in the control tanks, which did not contain oysters or macroalgae. Conversely, significant reductions in nutrients and suspended particulates after sedimentation and biological treatment
Ž
were observed. Overall, improvements in water quality final percentage of the initial
concentra-. Ž . Ž . Ž . qŽ . yŽ . 3y
tion were as follows: TSS 12% ; total N 28% ; total P 14% ; NH4 76% ; NO3 30% ; PO4
Ž35% ; bacteria. Ž30% ; and chlorophyll a. Ž0.7% . Despite the probability of considerable. differences in sedimentation, filtration and nutrient uptake rates when scaled to farm size, these results demonstrate that integrated treatment has the potential to significantly improve water quality of shrimp farm effluent.q2001 Elsevier Science B.V. All rights reserved.
Keywords: Biofiltration; Macroalgae; Oysters; Polyculture; Sedimentation; Shrimp effluent
1. Introduction
Quantitative comparisons of shrimp farm influent and effluent water have demon-strated that effluent can contain elevated concentrations of dissolved nutrients,
phyto-Ž
plankton, bacteria, and other suspended organic and inorganic solids Ziemann et al.,
.
1992 . The potential adverse environmental impacts from untreated effluent have raised
Ž
concerns about the sustainability of shrimp farming Phillips et al., 1993; Primavera,
.
1994 . This has prompted the search for cost-effective methods of improving effluent water quality prior to discharge into receiving waters.
Ž .
Traditional methods of wastewater sewage treatment are ineffective and
pro-Ž
hibitively expensive for application in treating shrimp pond effluent Hopkins et al.,
.
1995 . A potentially viable alternative is biological treatment of the effluent using
Ž
oysters and macroalgae to remove suspended particulates and nutrients Shpigel et al.,
.
1993 . The organic component of pond effluent can provide a rich source of food for
Ž .
bivalves Newell and Jordan, 1983 . Bivalves, such as oysters, can also facilitate the removal of fine inorganic matter from suspension by coagulating this material into
Ž
larger, more settleable particles and egesting them as pseudofaeces Tenore and
Dun-.
stan, 1973 .
Previous studies have shown that filtration by oysters can significantly reduce the
Ž . Ž .
concentrations of bacteria, phytoplankton, total nitrogen N and total phosphorus P ,
Ž .
and other suspended particles in shrimp pond effluent Jones and Preston, 1999 . However, if sediment loads are too high, oyster filtration can be reduced or cease
Ž .
completely Loosanoff and Tommers, 1948 . Other studies have observed the problems associated with a high concentration of suspended solids on the health of oysters
ŽHopkins et al., 1993 . These studies indicate the need to reduce the concentration of.
suspended particles by sedimentation prior to filtration by oysters.
Regular water exchange in shrimp ponds is required to maintain adequate water quality for optimal growth conditions. In particular, the toxic effects of high ammonia
Ž .
concentration on the shrimp Chien, 1992 can be a critical factor in determining water
Ž .
exchange rates Wajsbrot et al., 1989; Hopkins et al., 1993 . Although oysters can
Ž
reduce the concentration of some particulate and dissolved nutrients Manahan et al.,
. q
1982; Dame, 1996 , they can also increase the concentration of NH4 through excretion
( )
A.B. Jones et al.rAquaculture 193 2001 155–178 157
growth, 10% to gametes, 2% to byssal threads, with 50% lost as biodeposition and 27%
Ž .
as excretion Dame, 1996 .
Various species of macroalgae can rapidly assimilate large quantities of dissolved
q Ž
organic and inorganic nutrients, usually with a preference for NH4 e.g., D’Elia and
. Ž .
DeBoer, 1978; Harlin, 1978; Ryther et al., 1981 . Rhodophyta red macroalgae are particularly efficient at taking up nutrients rapidly and have mechanisms for storing
Ž .
large reserves of nutrients Vergara et al., 1993 . For example, the red macroalga
q Ž .
Gracilaria edulis rapidly assimilates NH4 Jones et al., 1996 , and another red macroalgae Kappaphycus alÕarezii has been effectively used to assimilate waste
Ž .
nitrogen from the pearl oysters Pinctada martensi Qian et al., 1996 .
In addition to improving the water quality of shrimp effluent water, macroalgae and oysters can provide an additional source of income for shrimp farmers. For example, trials into tank culture of Gracilaria chilensis supplied with salmon seawater effluent have demonstrated production rates of four times those in wild beds and up to double
Ž .
the agar content Retamales et al., 1994 . The incorporation of oysters and macroalgae into a polyculture system may provide the potential for additional income; however, the costs associated with culture and maintenance of these crops must be considered. These organisms have specific requirements for growth and the level of management may be comparable to the principal aquaculture species. For example, macroalgae require sufficient water flow and periodic harvesting to ensure rapid growth and nutrient removal, and oysters are subject to fouling by barnacles, tube worms and oyster spat, requiring cleaning before sale.
This study used controlled laboratory experiments to test the combined efficiency of a three-stage system for treating pond effluent. The water quality after sedimentation,
Ž .
filtration of particulates by oysters Saccostrea commercialis and absorption of
nutri-Ž .
ents by macroalgae G. edulis were assessed.
2. Materials and methods
2.1. Experimental design
Shrimp pond effluent was collected from a commercial Penaeus japonicus farm in Moreton Bay, Australia. The farm had a total of 8 ha of ponds and at the time of sampling, the shrimp biomass in the ponds was approximately 3 t hay1. Ninety five
Ž .
percent of the suspended particles in the effluent from this farm are small 2–4mm clay
Ž .
particles Jones et al., unpublished data . A 60-l water sample was collected from the
Ž
effluent channel and transported to the laboratory in a plastic drum 35-cm diameter=
.
60-cm height . In the laboratory, any settled particles in the sample were resuspended
Ž .
and 3 replicate 1-l samples were collected for analysis of total suspended solids TSS
Žand percent organic of particulates , chlorophyll a, bacterial concentration, total.
Ž . Ž . Ž q
Kjeldahl nitrogen TKN and total phosphorus TP , and dissolved N NH4 and
y y. Ž 3y. Ž
temper-.
ature, pH, salinity, dissolved oxygen, and turbidity were determined with a Horiba U-10
Ž .
water quality meter CA, USA . A 30-ml sample of water was collected in test tubes, incubated in the dark for 30 min and subsequently placed into a Turner Designs
Ž . Ž
Fluorometer 10-005 Sunyvale, CA, USA for determination of in vivo fluorescence as
.
a measure of chlorophyll a .
The effluent was left to settle in the dark for 24 h in the collection drum, with physico-chemical parameters, and in vivo fluorescence measured at over 24 h. The
Ž q y y.
remaining parameters, TKN, TP, dissolved N NH4 and NO3rNO2 , dissolved P
ŽPO3y., bacterial concentration, chlorophyll a and TSS were analysed after 24 h only.
4
Ž .
A sediment trap 23=15 cm was placed on the bottom of the drum to determine the
Ž .
amount of settled material per litre after 24 h and the percent organic content of the settled particles.
After 24 h, 10 l of the settled sample was drained into each of four, 11-l aerated tanks
Ž26=17=25 cm , one as a control with dead oyster shells , and three for replicate. Ž .
Ž .
oyster filtration treatments. Experimental tanks Fig. 1 were maintained at 20–238C and exposed to light on a 12:12 h lightrdark cycle using daylight fluorescent tubes which provided approximately 250 mmol quanta my2 sy1. The 11-l tanks were each stocked with 16 oysters with a mean wet weight of 40 g. Dead oyster shells were used in the control tanks to negate any effects on water flow and consequent differences in settling rates. Oysters were placed on plastic mesh, which was situated on top of the sediment
Ž
Fig. 1. Design of the integrated system for treatment of shrimp pond effluent and stocked with oysters 40 g S.
. Ž .
( )
A.B. Jones et al.rAquaculture 193 2001 155–178 159
trap. Physico-chemical parameters, and in vivo fluorescence, were measured from 24 to
Ž q y y.
48 h. The remaining parameters, TKN, TP, dissolved N NH4 and NO3rNO2 ,
Ž 3y.
dissolved P PO4 , bacterial concentration, chlorophyll a, TSS and sediment traps were analysed after 48 h.
After 24 h of oyster filtration, 5 l from each tank was drained into each of four more
Ž .
11-l aerated tanks, with one as a control empty , and three as replicate macroalgal
Ž . Ž .
absorption treatments 100-g wet weight of macroalgae per 5 l Fig. 1 . The water from the oyster control tank was transferred into the macroalgal control tank, and the water from the replicate oyster treatment tanks was transferred into the corresponding
macroal-Ž .
gal treatment tanks Fig. 1 . Both the oyster and macroalgal control tanks acted as controls for the combined biological treatment process using both the oysters and macroalgae. Consequently, the effluent in the macroalgal control tank contained higher concentrations of phytoplankton, bacteria and other suspended solids, because the
Ž q
oysters had not treated it yet. Physico-chemical parameters, dissolved N NH4 and
y y. Ž 3y.
NO3rNO2 , and dissolved P PO4 were measured from 48 to 72 h. The remaining parameters, TSS, TKN, TP, chlorophyll a, bacterial concentration and sediment traps were analysed after 72 h.
At the end of each 24-h period, three replicate 1-l samples were collected from each tank and filtered for chlorophyll a extraction, TSS calculation and the percent organic.
Ž q y y.
Subsamples were taken for TKN and TP, dissolved N NH4 and NO3rNO2 ,
Ž 3y.
dissolved P PO4 , and bacterial concentration. At all times excepting 0, 24, 48 and 72
Ž .
h, chlorophyll a and TSS were determined as in vivo fluorescence and turbidity NTU ,
Ž .
respectively. Preliminary analysis determined correlations "2 between in vivo
fluores-Ž .
cence and chlorophyll a to be 0.86, and between turbidity NTU and TSS to be 0.9. In vivo fluorescence measurements were converted to chlorophyll a concentration and turbidity measurements were converted to TSS for those periods of additional sampling at 15, 30 min, 1, 2, 3, 6 and 12 h.
The use of one replicate sample for the sedimentation and control tanks was considered sufficient based on the low variability in water quality parameters measured
Ž
between replicates during previous studies at the same shrimp farm Burford, 1997;
.
Jones and Preston, 1999 . Typically, the main variability in water quality of shrimp pond
Ž .
effluent is on a temporal scale both diel and seasonal variability .
2.2. Analytical procedures
Chlorophyll a was determined by filtering a known volume of water sample through Whatman GFrF filters, which were immediately frozen. Acetone extraction and calcula-tion of chlorophyll a concentracalcula-tion was performed using the methods of Clesceri et al.
Ž1989 and Parsons et al. 1989 .. Ž .
The filtrate collected from filtering for chlorophyll a analysis was collected in 120 ml polycarbonate containers and immediately frozen. NHq and NOyrNOy and PO3y
4 3 2 4
were determined by the NATA-accredited Queensland Health Analytical Services
Ž . Ž .
Laboratory QHASL in accordance with the methods of Clesceri et al. 1989 using a
Ž .
Ž .
Unfiltered samples for nutrient analysis total Kjeldahl nitrogen and total phosphorus were collected in 120 ml polycarbonate and immediately frozen. They were subse-quently analysed within 2 weeks by the QHASL in accordance with the methods of
Ž . Ž .
Clesceri et al. 1989 using a Skalar autoanalyser Norcross, GA, USA .
Ž .
TSS concentrations were determined using the methods of Clesceri et al. 1989 . A
Ž .
known volume of water was filtered onto a pre-weighed and pre-dried 1108C, 24 h Whatman GFrC glass fibre filter. The filter was then oven dried at 608C for 24 h and TSS calculated by comparing the initial and final weights. Volatile suspended solids were determined as loss on ignition by combusting samples in a muffle furnace for 12 h
Ž .
at 5258C Clesceri et al., 1989 .
Bacteria samples were preserved with 2% formalin and kept at 48C until analysis. A
Ž .
known volume 0.5–1 ml of sample was stained with acridine orange, filtered onto a
Ž .
stained Irgalan Black 2-mm poretics filter and mounted on a slide. Bacteria were
Ž .
counted using epifluorescence microscopy Hobbie, 1977 .
For oyster filtration and macroalgal absorption treatments, three replicate tanks were analysed and means and standard errors were calculated. Differences between treatments
Ž .
were tested for significance using one way analysis of variance ANOVA and Tukey’s Test for multiple comparison of means at a significance level of 0.05 using Minitab 12.1
Ž .
software State College, PA, USA .
3. Results
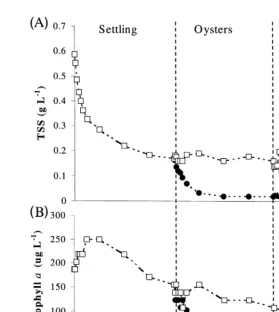
3.1. Chlorophyll a
Sedimentation reduced the mean chlorophyll a concentration from 180 to 130 mg ly1. In the oyster control, the concentration of chlorophyll a was further reduced from 130 to 100 mg ly1 due to continued settling. The reduction in the chlorophyll a concentration from 130 to 11 mg ly1
in the oyster treatment was significantly greater
ŽP-0.001 than the control. The concentration of chlorophyll a decreased from 100 to.
y1 Ž . y1
51mg l in the macroalgal control no macroalgae and from 11 to 1.5mg l in the
Ž
macroalgal treatment. These decreases indicate additional settling of phytoplankton Fig.
.
2B, Table 1 .
3.2. Suspended solids
The initial concentration of TSS was 0.60 g ly1. After sedimentation, the mean concentration was reduced to 0.17 g ly1. Oyster filtration further decreased the concentration to 0.02 g ly1. There was no change in the oyster control, indicating that material with a specific gravity greater than water had already settled out of suspension
Ž .
during the initial 24 h sedimentation period. There was no significant change P)0.05
Ž .
( )
A.B. Jones et al.rAquaculture 193 2001 155–178 161
Ž . Ž . Ž .
Fig. 2. Changes in total suspended solids A and phytoplankton biomass chlorophyll a ; B from sedimentation, oyster filtration and macroalgal absorption of shrimp pond effluent. Standard error bars have been plotted, but are too small to be visible.
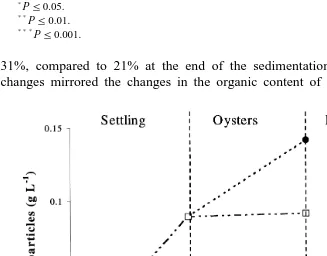
treatment, 0.42 g was collected vs. 0.02 g in the oyster control. This indicates significant
ŽP-0.001 biodeposition of faeces and pseudofaeces by the oysters Fig. 3 .. Ž .
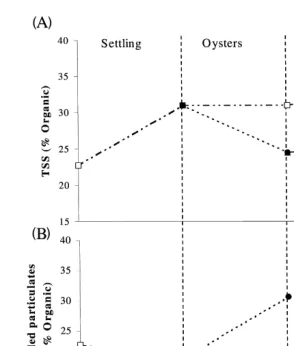
3.3. Organic content
In the first 24 h, sedimentation removed a greater proportion of inorganic particles than organic particles. The relative organic content of the remaining suspended solids increased from 23% to 31%. The organic content of the settled material collected in the sediment traps was 21%, which was lower than the initial water column content of 23%. Sedimentation in the oyster control tanks did not change the organic content. Oyster
Ž
filtration was more effective at removing organic material phytoplankton, bacteria and
.
Table 1
Final percentages of the initial and highest recorded concentrations of various water quality parameters of shrimp pond effluent after settling, filtration by oysters and filtration by macroalgae. Levels of significant difference from the initial and highest recorded concentrations are indicated
Percentage F-value Percentage F-value
Bacteria no. per l 30 107 30 107
) ) )
31%, compared to 21% at the end of the sedimentation treatment Fig. 4B . These
Ž
changes mirrored the changes in the organic content of the suspended particles Fig.
( )
A.B. Jones et al.rAquaculture 193 2001 155–178 163
Ž . Ž .
Fig. 4. Changes in the organic content of the A TSS and B settled particles in the shrimp pond effluent from sedimentation, oyster filtration and macroalgal absorption. Standard error bars have been plotted, but are too small to be visible.
.
4A . In the macroalgal treatment and control, the organic content of the suspended solids
Ž .
remained unchanged Fig. 4A .
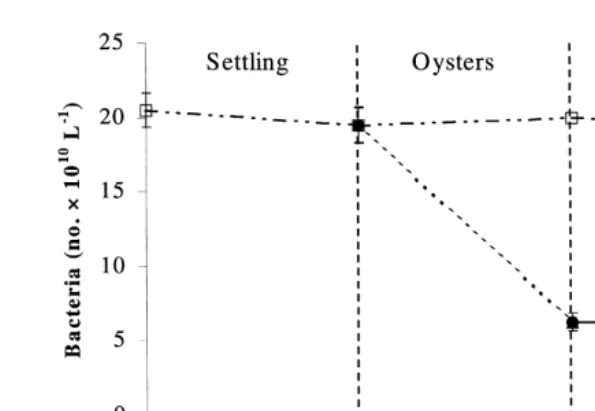
3.4. Bacteria
Ž .
During sedimentation, bacterial numbers did not change significantly P)0.05 ,
Ž .
whereas the oyster treatment significantly P-0.001 reduced the mean concentration
10 y1 Ž .
of bacteria from 19 to 6=10 l . There was no significant change P)0.05 in
Ž .
bacterial numbers in the macroalgal controls and treatments Fig. 5, Table 1 .
3.5. DissolÕed oxygen
Fig. 5. Changes in bacterial numbers of shrimp pond effluent from sedimentation, oyster filtration and macroalgal absorption.
or aeration, respiration by bacteria and plankton reduced the mean concentration to 2.6 mg ly1. Within 2 h of aeration being applied in the oyster tanks, the concentration of dissolved oxygen was up to 6.3 mg ly1. The concentration peaked at between 7 and 8
y1 Ž .
mg l in the macroalgal treatment and control tanks Fig. 6 .
( )
A.B. Jones et al.rAquaculture 193 2001 155–178 165
Ž . Ž .
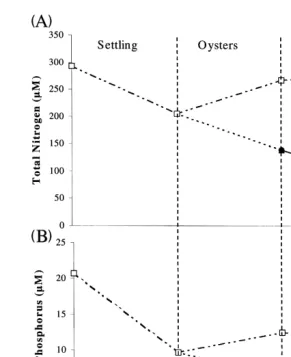
Fig. 7. Changes in water column total N A and P B concentrations of shrimp pond effluent from sedimentation, oyster filtration and macroalgal absorption. Standard error bars have been plotted, but are too small to be visible.
3.6. Total nitrogen
The sedimentation treatment reduced the mean concentration of total Kjeldahl
Ž .
nitrogen TKN from 290 to 205 mM. The oyster treatment further reduced the concentration to 138mM, while in the control the concentration increased to 266 mM. The macroalgal treatment reduced the concentration from 138 to 81mM, while in the
Ž .
control the concentration increased from 266 to 279mM Fig. 7A, Table 1 .
3.7. Total phosphorus
Ž .
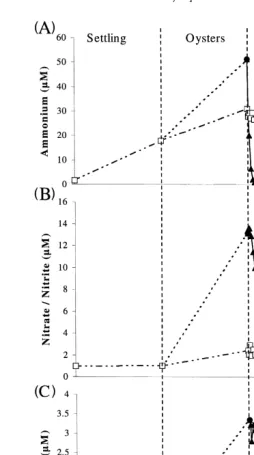
Fig. 8. Changes in water column NHq, NOy, PO3y concentrations of shrimp pond effluent from
sedimenta-4 3 4
tion, oyster filtration and macroalgal absorption. Standard error bars have been plotted, but are too small to be visible.
treatment reduced the concentration to 6.1 mM. The macroalgal control reduced the concentration from 12.5 to 11.5mM and the macroalgal treatment reduced the
concen-Ž .
( )
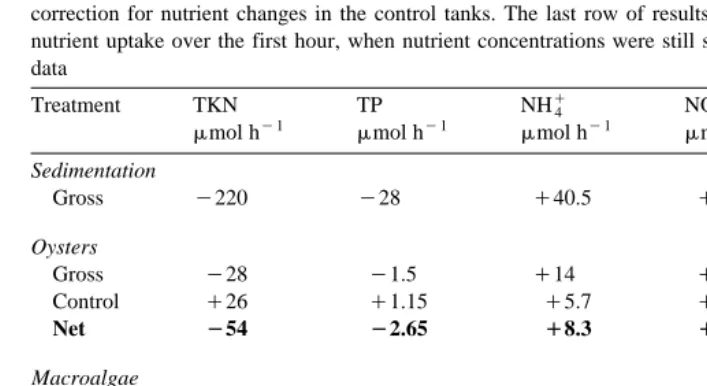
A.B. Jones et al.rAquaculture 193 2001 155–178 167 Table 2
Nutrient uptake and release rates for sedimentation, oyster filtration and macroalgal absorption. Negative symbols represent nutrient uptake and positive represent nutrient release. The top value for each treatment is
Ž .
the gross value, the middle value is the control and the bottom value in bold type is the net value after correction for nutrient changes in the control tanks. The last row of results represent the rates of macroalgal nutrient uptake over the first hour, when nutrient concentrations were still saturating uptake kinetics. ndsno data
The mean concentration of water column NHq increased during sedimentation from
4
1.7 to 18 mM due to regeneration. Regeneration rates were calculated as mmol hy1
Ž
based on the effluent volumes used during each treatment period i.e., 60 l for
.
sedimentation, 10 l for the oyster treatment, and 5 l for the macroalgal treatment . Thus, the observed rate of regeneration during sedimentation was 40.5mmol hy1, although this may have been substantially higher if the loss due to volatilisation and uptake by bacteria and phytoplankton was taken into account. The rate of NHq4 regeneration in the
Ž y1.
oyster control was considerably lower 5.7mmol h increasing from 18 to 29 mM. This was probably a result of the decrease in the concentration of TSS, thereby reducing the source of remineralisation. The mean NHq concentration in the oyster treatment
4
increased from 18 to 51mM. During the macroalgal treatment, the NHq concentration
4
Ž .
was reduced from 51 to 1.3mM to 1.0mM after 2 h . The uptake rate during the first
Ž . y1
hour when N concentrations were still saturating uptake kinetics was 225mmol h for the 100 g of macroalgae. The concentration of NHq in the macroalgal control
4
Ž .
decreased from 29 to 1.2mM, but at a much slower rate only to 26mM after 2 h than
Ž . q
in the macroalgal treatment Fig. 8A; Table 1 and Table 2 . The reduction in NH4 in the macroalgal control suggests volatilisation, nitrification or uptake by the high concentration of bacteria and phytoplankton. The dramatic reduction in NHq in the
peaked sometime during the oyster treatment and were already declining before transfer to the macroalgal control tanks.
3.9. Nitraternitrite
The mean concentration of NOy
rNOy was unchanged during the sedimentation
3 2
period, where the effluent was not aerated, but increased from 1.0 to 1.4 mM in the oyster control and from 1.0 to 13mM in the oyster treatment. There was no change in the NOyrNOy concentration in the macroalgal control, but the macroalgae in the
3 2
Ž .
treatment tanks significantly P-0.001 reduced the concentration from 13 to 0.3mM
ŽFig. 8B, Table 1 ..
3.10. Phosphate
Phosphate was also unchanged during sedimentation, but increased from 0.5 to 2mM in the oyster control and from 0.5 to 3.3 mM in the oyster treatment. The mean concentration in the macroalgal control decreased from 2 to 0.7 mM, and in the
Ž
macroalgal treatment the concentration of P decreased from 3.3 to 0.16 mM Fig. 8C,
.
Table 1 .
These reductions in PO43y equate to a removal rate of 0.66 mmol hy1 in the macroalgal treatment, while loss in the control was only 0.26mmol hy1. During the first hour of macroalgal filtration, the concentration of PO3y in the control decreased at a
4
greater rate than in the macroalgal treatment. This may have been due to the presence of significantly more phytoplankton and bacteria in the control tanks, because the control water had not been treated by the oysters. Consistent with the NHq, there was a
4
dramatic reduction in PO3y at the start of the macroalgal treatment. This suggests the
4
concentrations actually peaked sometime during the oyster treatment and were declining before transfer to the macroalgal control tanks.
3.11. Nutrient uptake rates and ratios
q Ž
During the macroalgal treatment, NH4 was taken up in the first 2 h hour 48 to hour
. y Ž . 3y Ž
50 , NO3 in the next 4 h from hour 50 to hour 54 , and PO4 over 10 h from hour 50
. 3y
to hour 60 . N in both forms was taken up at faster rates than PO4 .
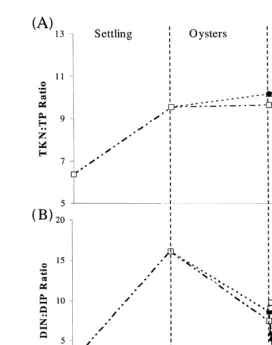
The TKNrTP ratio in the water column increased during sedimentation from 6.4 to 9.6, and then during oyster filtration from 9.6 to 10.2, probably due to adsorption of P to settling particulates. There was no change in the oyster control, but the macroalgal control showed a further increase to 10.9, and the macroalgal treatment increased to 12.6
ŽFig. 9A ..
The ratio of dissolved inorganic nitrogen to dissolved inorganic phosphorus
ŽDINrDIP increased from 2.6 to 16.2 during sedimentation, predominantly as a result.
of NHq remineralisation. During the oyster treatment and control, the ratio dropped to
4
( )
A.B. Jones et al.rAquaculture 193 2001 155–178 169
Ž .
Fig. 9. Changes in water column total NrP ratio A and dissolved inorganic nitrogen: dissolved inorganic
Ž .
phosphorus ratio; B of shrimp pond effluent from sedimentation, oyster filtration and macroalgal absorption. Standard error bars have been plotted, but are too small to be visible.
PO3y in the macroalgal control in the first 6 h, and the rapid uptake of NHq in the
4 4
Ž .
macroalgal treatment Fig. 9B .
4. Discussion
4.1. Water quality
exam-Ž .
ple, Shpigel et al. 1993 examined three separate regimes for treating fish pond effluent and concluded these could be more closely integrated. Our study advanced the concept to the point of laboratory tests to examine the combined efficiency of sedimentation, biofiltration by oysters and nutrient uptake by macroalgae.
The ability of a biofilter system to improve the quality of shrimp effluent is likely to vary depending on the initial water quality. The water quality of shrimp farm effluent depends on a number of factors, including pond soil type, quality of influent water, stage
Ž .
of growout season and management practices employed Ziemann et al., 1992 . Our study was conducted in November, early in the growout season when the concentration
q Ž . Ž .
of NH4 was relatively low 1.7mM , compared to later in the growout season 65mM
ŽJones et al., unpublished data . However, there were very high concentrations of TSS.
and phytoplankton in the effluent at the time of the study. The concentrations of TSS
Ž0.6 g ly1., chlorophyll a 180Ž mg ly1.and bacteria 20Ž =1010 ly1.were, respectively, 4.5, 5 and 10 times the values measured from the same shrimp farm in the previous
Ž .
growout season Jones and Preston, 1999 .
4.2. Sedimentation
Sedimentation of shrimp pond effluent was very effective at reducing the TSS load. The concentration was reduced to 12% of the initial concentration with proportionally more inorganic particles being removed from suspension. Additionally, there were
Ž .
significant P-0.05 reductions in TKN to 70%, TP to 47%, and chlorophyll a to 72% of the initial concentration. The results indicate that the majority of N in the effluent was associated with phytoplankton and bacteria, rather than being bound to readily settleable inorganic particles or detritus. In contrast to this, a relatively high proportion of the TP appeared to be associated with the readily settleable particles.
In this study, the rates of TKN removal by sedimentation and oyster filtration were
Ž .
not significantly different P)0.05 ; however, the rate of TSS removal was much slower during oyster filtration compared with sedimentation. This may be a result of
Ž . Ž .
higher N content in the small -5mm unsettleable particles Cripps, 1992 removed by the oysters. Alternatively, it may simply reflect relatively slow settlement rates of phytoplankton compared to TSS. Despite the reduction in TKN and TP during sedimen-tation, there was a marked increase in the concentration of NHq4 in the water column,
Ž
most likely due to mineralisation of particulate organic matter Briggs and Funge-Smith,
.
1993 .
Treatment for the removal of suspended solids must be adapted specifically for the target effluent. The size and density of the particles, along with the flow rates, surface
Ž .
area and retention time affects the efficiency of sedimentation Chien and Liao, 1995 . Effluent with high algal concentrations may require less sedimentation time, because the oysters can filter it more effectively.
4.3. Oyster filtration
Pre-sedimentation of suspended particles is highly beneficial to oyster filtration. In
Ž .
( )
A.B. Jones et al.rAquaculture 193 2001 155–178 171
may enhance the oysters’ ability to assimilate particulate nutrients, as well as filter and
Ž .
egest the smaller inorganic clay particles as pseudofaeces Loosanoff, 1949 . In the present study, the concentration of TSS was reduced from 0.6 to 0.17 g ly1 after sedimentation. However, even at this reduced concentration of suspended solids the oyster pumping rates may have been inhibited. For example, a concentration of 0.1 g ly1
Ž
has been observed to reduce the pumping rate of oysters by up to 87% Loosanoff and
.
Tommers, 1948 .
Ninety five percent of the suspended particulates in the effluent from this shrimp
Ž .
farm were 2–4 mm Jones et al., unpublished data . During filtration, oysters sort
Ž . Ž
particles by size, weight Yonge, 1926 and chemical composition Loosanoff, 1949;
.
Menzel, 1955 . Oysters preferentially ingest organic material, reject inorganic material,
Ž .
and preferentially ingest N rich over C rich particles Newell and Jordan, 1983 . Rejected material is expelled as pseudofaeces, and when food concentration exceeds the digestive capabilities of the gut, pseudofaeces may contain some digestible food.
In addition to rejecting small inorganic particles, oysters may facilitate removal of these particles from suspension by coagulating them into larger, more settleable particles before egestion as pseudofaeces. In addition to the fine inorganic particles, oysters filter small organic rich particles, such as bacteria and very small phytoplankton that would
Ž .
otherwise stay in suspension Loosanoff, 1949; Kautsky and Evans, 1987 . Oysters can filter particles as small as 1mm, although their efficiency in removing smaller particles
Ž1–3 mm is substantially lower than for larger particles Haven and Morales-Alamo,. Ž .
1970 .
The oysters removed large concentrations of phytoplankton, bacteria and other suspended solids from the water column, and produced faeces and pseudofaeces at a rate
Ž .y1 y1 Ž .y1
of 78 mg g dry wt. d . This rate is within the range of 66–246 mg g dry wt
y1 Ž
d observed for the Pacific oyster, Crassostrea gigas Boucher and Boucher-Rodoni,
.
1988 .
Decreases in TP were observed in the oyster treatment due to removal of particulate P
Žbacteria, phytoplankton and clay particles with adsorbed P at a rate greater than the.
inputs of PO3y. Shrimp pond effluent often contains a high proportion of small clay
4
Ž . Ž .
particles Hopkins et al., 1995 rich in phosphate Pomeroy et al., 1965 . Bacteria may compete with sediments for phosphate thereby maintaining the phosphate in the water
Ž . 3y
column Pomeroy et al., 1965 . The increase in PO4 and TP observed in the oyster control was probably due to sediment release and the greater increase in PO43y in the
Ž .
oyster treatment due to excretion by oysters Asmus et al., 1995 . Most of the P filtered 3y Ž
by oysters is converted to biodeposits, with 8% being released as PO4 Dame et al.,
. Ž .
1989 , and only 3% absorbed and converted into biomass Sornin et al., 1986 .
In this study, oyster filtration reduced the concentration of TKN to 28% and TP to 14% of the initial effluent concentration. These reductions represent an uptake ratio of 20:1. Based on the Redfield ratio of 16:1 in phytoplankton, the oysters were removing more N than expected. Furthermore, this is in contrast to the results of Dame et al.
Ž1989 who observed an N. rP uptake ratio by oysters C. gigas of 2:1. This disparityŽ .
high N content of shrimp feed pellets may be one of the sources responsible for elevating the NrP ratio taken up by the oysters.
During oyster filtration, there was a net decrease in the concentration of particulate nutrients, and a net increase in the concentration of dissolved inorganic nutrients. In addition to particulate matter, oysters can also take up dissolved organic and inorganic
Ž .
nutrients and dissolved organic matter DOM , such as dissolved free amino acids, from
Ž .
the water column Manahan et al., 1982; Dame, 1996 . In particular, oysters can assimilate PO3y directly from the water column for carbohydrate metabolism, energy
4
Ž .
transfer and shell deposition Pomeroy and Haskin, 1954 .
A net NHq excretion rate of 0.9mmol gy1 DW hy1, which is in the range described 4
Ž .
in the literature Boucher and Boucher-Rodoni, 1988 , was measured in the oyster treatment tanks. This takes into account inputs from regeneration, but does not incorpo-rate the losses to phytoplankton and bacterial uptake of NHq, volatilisation and
4
Ž
nitrification which may significantly enhance these rates Boucher and Boucher-Rodoni,
.
1988 .
4.4. Macroalgal absorption
G. edulis in this study achieved 87% of its total NHq4 uptake within the first hour. A
Ž .
similar rate 80% was observed for the red macroalga, K. alÕarezii, incubated in the
Ž .
nutrients excreted by the pearl oyster P. martensi Qian et al., 1996 . The initial rate of
q y1 Ž .
NH4 uptake in our study was 218mmol h per 100 g wet wt. Table 2 , which is very
Ž .
close to the rate observed by Qian et al. 1996 for 200-g wet wt. for K. alÕarezii, and is
Ž .
within the range observed for Gracilaria Rivers and Peckol, 1995 and other species of
Ž . y
macroalgae Taylor et al., 1998 . The NO3 uptake rates in this study, however, were considerably lower, with a maximum rate of 15%rh compared to 66%rh for the K.
q Ž .
alÕarezii. Low light and high concentrations of NH4 D’Elia and DeBoer, 1978 can
inhibit NOy uptake. The ability to assimilate NOy can also be species specific.
3 3
Consistent with the findings for G. edulis, uptake of NOyby UlÕa lactuca was found to
3
Ž . q y
be minimal Krom et al., 1995 . Preferential uptake of NH4 before NO3 is typical for
Ž .
most species of macroalgae and is consistent with the results of Oki and Fushimi 1992 who found that as the concentration of NHq4 decreased, the uptake rate of NOy3 increased.
In this study, the fastest rates of net uptake of NHq4, NOy3 and PO43y by macroalgae were 2.6, 2.5 and 2.2 times higher than the net oyster release rates, respectively. The net rate takes into account losses to phytoplankton and bacterial uptake, volatilisation and
Ž . q y
nitrification Table 2 . The proportion of NH4 to NO3 taken up by the macroalgae
q Ž .
varied, being 20:1 during the period of fastest uptake of NH4 uptake in the first hour , but only 1.6:1 over the entire 24 h. This overall rate is comparable to the oyster release rates of NHq and NOy, which were 1.9:1. The uptake of NHq and NOy by K.
4 3 4 3
Ž
alÕarezii was in similar proportions to the release rates of the pearl oyster Qian et al.,
.
1996 .
Ž . q y y
( )
A.B. Jones et al.rAquaculture 193 2001 155–178 173
Ž .
of nutrient limitation Gerloff and Krombholz, 1966; Jones et al., 1996 . This reduction in the DINrDIP ratio may have implications for water recirculation and downstream environmental impacts. Analysis of bioindicators downstream of shrimp farms has
q Ž .
indicated responses typical of high NH4 rich effluent Jones et al., unpublished data . Despite the rapid removal of N from the effluent, this uptake rate is substantially
Ž
lower than recorded literature values for other species of Gracilaria Friedlander and
.
Dawes, 1985; Peckol et al., 1994 , suggesting that removal rates could be improved. Nutrient removal efficiency of macroalgae may be improved with increased light,
Ž .
particularly for nitrate uptake Hanisak, 1979; Falkowski, 1983 , increased water flow to
Ž . Ž
reduce the boundary layer Wheeler, 1980 , and higher stocking densities Ugarte and
.
Santelices, 1992 . Our study was conducted indoors under experimental conditions. Under full solar radiation, photosynthetic rates could be considerably higher and nutrient uptake rates correspondingly higher. In a biological treatment pond, water flow rates would be determined by the physical volume of water being pumped through the pond and the water movement due to the action of paddlewheels or other aerators. In this study, the macroalgae were stocked at 2.3 kg my2, whereas maximum growth rates of
G. chilensis have been achieved by stocking at 4 kg my2 in winter and 8 kg my2 in
Ž .
summer Ugarte and Santelices, 1992 .
Given the low concentrations of NHq4 in the effluent from the shrimp farm at the
Ž .
time of the study early in the shrimp growout season , the total reduction in the concentration of NHq4 was lower than expected. The 24% reduction in NHq4 from 1.7 to 1.3mM may not be indicative of the real potential for this system to remove NHq. Due
4 to addition of NHqto the system through the decay of epiphytes and macroalgal tissue,
4
a concentration of approximately 1 mM may be the equilibrium point between uptake and input from decay. Based on the fast rates of uptake observed in this study, it can be expected that during the late phase of the growout season, when the concentrations of
q Ž . Ž .
NH4 are considerably higher up to 60 mM Jones et al., unpublished data , that overall removal efficiency will be considerably higher. Conversely, the macroalgae may reach a saturation threshold with no further ability to store nutrients. This may mean that further NHq could only be taken up at a rate proportional to growth.
4
The percent reductions by macroalgal nutrient absorption have been expressed as overall reductions from the initial concentration in the shrimp effluent. However,
Ž .
because remineralisation and oyster excretion significantly P-0.001 increased the concentration of NHq4, NOy3, and PO43y, the efficiency of nutrient removal can be expressed as a percentage of the concentration in the water received by the macroalgae. Based on these calculations, the concentrations of NHq4, NOy3 and PO43y were reduced
Ž .
to 2.3%, 2.2% and 4.8%, respectively Table 1 .
4.5. Nutrient regeneration
During sedimentation, the rate of NHq regeneration was 1.8 mmol my2 dayy1, 4
although this did not take into account loss of NHq by phytoplankton and bacterial
4
uptake, or by volatilisation. The NHq regeneration rate declined markedly after transfer
4
Ž . q
Kamiyama et al. 1997 , who observed increases in NH4 release during low dissolved oxygen conditions and NOy3 release under high dissolved oxygen conditions. The NHq4 regeneration rates during sedimentation were markedly lower than the sediment NHq4 release rates of between 8.4 and 18 mmol my2 dayy1 that have been recorded in fish
Ž . q
ponds Riise and Roos, 1997 . In our study, the NH4 uptake rate by the macroalgae was 118 mmol my2 dayy1. At this rate, the macroalgae would be able to remove up to 6.5
q Ž .
times the NH4 released from the fish ponds observed by Riise and Roos 1997 . During sedimentation when the concentration of dissolved oxygen was very low, there was no production of NOy, despite high amounts of NHq remineralisation. This is
3 4
Ž .
typical of anaerobic aquaculture ponds Blackburn et al., 1988 . Once under aerobic conditions in the aerated oyster controls, nitrification was observed, although rates were
Ž .
still very low. In the oyster treatment tanks, there was significant P-0.001 produc-tion of NOy, which is consistent with the nutrient release by the pearl oyster P. martensi
3
ŽQian et al., 1996 ..
q Ž . 3y
Oysters excrete NH , amino acids, urea, uric acid Hammen et al., 1966 and PO4 4
ŽPomeroy and Haskin, 1954; Dame, 1996; Dame et al., 1989 . The nitrogen release rates.
by the pearl oyster was 0.52mmol hy1 of NHq4 and 0.44 mmol hy1 of NOy3 per oyster
Ž . y1
Qian et al., 1996 , compared to 0.52 and 0.28 mmol h , respectively, for S.
commercialis in this study. It has been suggested that the observed NOy3rNOy2 release
Ž
from oysters is due to nitrifying bacteria in the digestive tract of the organism Saijo and
.
Mitamura, 1971; Boucher and Boucher-Rodoni, 1988 . There could also be free-living nitrifying bacteria in the water column, although there was only negligible production of NOy in the oyster and macroalgal control tanks.
3
The apparent enhancement of nitrification by the oysters resulted in more NOybeing
3 available for denitrification. By increasing the proportion of NOy–N relative to NHq–N,
3 4
bivalves such as oysters can enhance nitrificationrdenitrification coupling, promoting greater removal of N from the effluent. Rates of denitrification in mussel beds have been
Ž .
observed to be 21% greater than bare sediment Kasper et al., 1985 and combined with the mussel harvest, this represented a 68% greater loss of nitrogen than bare sediment.
Ž
Bivalves are known to significantly increase the rates of carbon deposition Doering
. Ž
and Oviatt, 1986; Doering et al., 1986 and the rates of benthic flux of DIN Doering et
. q
al., 1987 . Consequently, the sediment NH4 and organic N pools under bivalves are
Ž .
significantly higher than those in bare sediments Kasper et al., 1985 . Bivalves enhance movement of organic nitrogen to the sediments, where it decomposes. This
decomposi-q Ž . y y
tion in the aerobic surficial sediments yields NH4 remineralisation and NO3rNO2
Žnitrification and, in the deeper anaerobic sediments, NO. y is converted into N gas
3 2
Ždenitrification. ŽDame, 1996 . Stimulation of nitrification by oysters can result in more.
y q Ž .
NO3 present in the water, and less NH4 Boucher and Boucher-Rodoni, 1988 .
Ž . q
By stimulating nitrification, the oysters significantly P-0.001 reduced the NH :4 NOyrNOy ratio from 13:1 to 4:1. This has significant management implications,
3 2
especially in relation to the possibilities for recycling of treatment pond effluent back into the production ponds. Aeration and uptake by phytoplankton and bacteria in the macroalgal control tanks reduced the NHqrNOy ratio to 0.5:1. Although the ratio of
4 3
NHqrNOy was lower in the control, the total concentration of DIN was significantly
4 3
( )
A.B. Jones et al.rAquaculture 193 2001 155–178 175
Greater improvements in water quality may be possible by combining the oysters and macroalgae in the same treatment pond. Rapid uptake of the nutrients resulting from
Ž .
remineralisation of oyster biodeposits Kelly and Nixon, 1984 , may reduce potential stimulation of phytoplankton production. There may be a balance between nutrient enhanced phytoplankton productivity and the removal of phytoplankton biomass by
Ž .
oysters Zeitzschel, 1980 .
For co-culture of macroalgae and oysters to be successful, the growth requirements of each species need to be optimised. In particular, if the temperature, water flow rate, or light availability is not adequate for macroalgal growth, there may be more biomass decaying than being produced. This would result in a decline in water quality and
Ž .
consequently lower oyster growth rates Qian et al., 1996 .
5. Conclusions
The results from this study detail the ability of sedimentation, oysters and macroalgae to substantially reduce the concentrations of water column nutrients, suspended solids, phytoplankton and bacteria of shrimp pond effluent and highlights the relationships between these components of the effluent water quality. These laboratory trials provided detailed information regarding potential sedimentation and nutrient regeneration rates, oyster filtration rates, and nutrient uptake rates. However, scaling this integrated system to farm size may result in considerably different improvements to effluent water quality.
Acknowledgements
This study was supported by a University of Queensland Postgraduate Research Scholarship for Adrian Jones. We gratefully acknowledge the support of Moreton Bay Prawn Farm and Stradbroke Oysters in the study. Our thanks to the members of the Marine Botany Group at the University of Queensland for their assistance with interpretation of results.
References
Asmus, H., Asmus, R.M., Zubillaga, G.F., 1995. Do mussel beds intensify the phosphorus exchange between sediment and tidal waters? Ophelia 26, 1–18.
Blackburn, T.H., Lund, B.A., Krom, M.D., 1988. C- and N-mineralization in the sediments of earthen marine fishponds. Mar. Ecol.: Prog. Ser. 44, 221–227.
Boucher, G., Boucher-Rodoni, R., 1988. In situ measurement of respiratory metabolism and nitrogen fluxes at the interface of oyster beds. Mar. Ecol.: Prog. Ser. 44, 229–238.
Briggs, M.R.P., Funge-Smith, S.J., 1993. Macroalgae in aquaculture: an overview and their possible roles in shrimp culture. Proceedings of the Conference on Marine Biotechnology in the Asia Pacific Region, Bangkok, Thailand, 16–20 November, 1993.
Chien, Y.H., 1992. Water quality requirements and management for marine shrimp culture. In: Wyban, J.
ŽEd. , Proceedings of the Special Session on Shrimp Farming. World Aquaculture Society, Baton Rouge,.
LA, USA, pp. 144–156.
Chien, Y.H., Liao, I.C., 1995. Integrated approach to shrimp growout system design. In: Browdy, C.L.,
Ž .
Hopkins, J.S. Eds. , Swimming Through Troubled Water, Proceedings of the Special Session on Shrimp Farming, Aquaculture ’95. World Aquaculture Society, Baton Rouge, LA, USA, pp. 167–179.
Clesceri, L.S., Greenberg, A.E., Trussel, R.R., 1989. Standard Methods for the Examination of Water and Wastewater. American Public Health Association, New York.
Cripps, S.J., 1992. Characterization of an aquaculture effluent based on water quality and particle size distribution data. Aquaculture ’92 Conference 21–25 May 1992, Growing Toward the 21st Century, Orlando, FL, USA, p. 72.
Dame, R.F., 1996. Ecology of Marine Bivalves: An Ecosystem Approach. CRC Press, New York.
Dame, R.F., Spurrier, J.D., Wolaver, T.G., 1989. Carbon, nitrogen and phosphorus processing by an oyster reef. Mar. Ecol:. Prog. Ser. 54, 249–256.
D’Elia, C., DeBoer, J., 1978. Nutritional studies of two red algae: II. Kinetics of ammonia and nitrate uptake. J. Phycol. 14, 266–272.
Doering, P.H., Oviatt, C.A., 1986. Application of filtration rate models to field populations of bivalves: an assessment using experimental mesocosms. Mar. Ecol.: Prog. Ser. 31, 265–275.
Doering, P.H., Kelly, J.R., Oviatt, C.A., Sowers, T., 1987. Effect of the hard clam Mercenaria mercenaria on the benthic fluxes of inorganic nutrients and gases. Mar. Biol. 94, 377–383.
Doering, P.H., Oviatt, C.A., Kelly, J.R., 1986. The effects of the filter feeding clam Mercenaria mercenaria on carbon cycling in experimental mesocosms. J. Mar. Res. 44, 839–861.
Ž .
Falkowski, P.G., 1983. Enzymology of nitrogen assimilation. In: Carpenter, E.J., Capone, D.G. Eds. , Nitrogen in the Marine Environment. Academic Press, New York, pp. 839–868.
Friedlander, M., Dawes, C.J., 1985. In situ uptake kinetics of ammonium and phosphate and chemical composition of the red seaweed Gracilaria tikÕahiae. J. Phycol. 21, 448–453.
Gerloff, G.C., Krombholz, P.H., 1966. Tissue analysis as a measure of nutrient availability for the growth of angiosperm aquatic plants. Limnol. Oceanogr. 11, 529–537.
Hammen, C.S., Miller, H.F., Geer, W.H., 1966. Nitrogen excretion of CrassostreaÕirginica. Comp. Biochem.
Physiol. 17, 1199–1200.
Hanisak, M.D., 1979. Growth patterns of Codium fragile sp. tomentosoides in response to temperature,
Ž .
irradiance, salinity and nitrogen source. Mar. Biol. Berlin 50, 319–332.
Ž .
Harlin, M.M., 1978. Nitrate uptake by Enteromorpha spp. Chlorophyceae : applications to aquaculture systems. Aquaculture 15, 373–376.
Haven, D., Morales-Alamo, R., 1970. Filtration of particles from suspension by the American oyster
CrassostreaÕirginica. Biol. Bull. Mar. Biol. Lab., Woods Hole, Mass. 139, 248–264.
Hobbie, J.E., 1977. Use of nucleopore filters for counting bacteria by fluorescence microscopy. Appl. Environ. Microbiol. 33, 1225–1228.
Hopkins, J.S., Hamilton, R.D. II, Sandifer, P.A., Browdy, C.L., 1993. The production of bivalve mollusks in intensive shrimp ponds and their effect on shrimp production and water quality. World Aquacult. 24, 74–77.
Hopkins, J.S., Sandifer, P.A., Browdy, C.L., 1995. A review of water management regimes which abate the
Ž .
environmental impacts of shrimp farming. In: Browdy, C.L., Hopkins, J.S. Eds. , Swimming Through Troubled Water, Proceedings of the Special Session on Shrimp Farming, Aquaculture ’95. World Aquaculture Society, Baton Rouge, LA, USA, pp. 157–166.
Jones, A.B., Preston, N.P., 1999. Oyster filtration of shrimp farm effluent, the effects on water quality. Aquacult. Res. 30, 51–57.
Jones, A.B., Stewart, G.R., Dennison, W.C., 1996. Macroalgal responses to nitrogen source and availability:
Ž .
amino acid metabolic profiling as a bioindicator using Gracilaria edulis Rhodophyta . J. Phycol. 32, 757–766.
Kamiyama, T., Tamai, K., Tsujino, M., 1997. Effects of sediment conditions and dissolved oxygen concentra-tion of bottom seawater on nutrient regeneraconcentra-tion processes from marine sediments. Bull. Nansei Natl. Fish. Res. Inst. Nanseisuikenho 30, 209–218.
( )
A.B. Jones et al.rAquaculture 193 2001 155–178 177 nitrogen cycle and benthic communities in Kenepuru Sound, Marlborough Sounds, New Zealand. Mar. Biol. 85, 127–136.
Kautsky, N., Evans, S., 1987. Role of biodeposition by Mytilus edulis in the circulation of matter and nutrients in a Baltic coastal ecosystem. Mar. Ecol.: Prog. Ser. 38, 201–212.
Kelly, J.R., Nixon, S.W., 1984. Experimental studies of the effect of organic deposition on the metabolism of a coastal marine bottom community. Mar. Ecol.: Prog. Ser. 17, 157–169.
Krom, M.D., Ellner, S., Van Rijn, J., Neori, A., 1995. Nitrogen and phosphorus cycling and transformations in a prototypeAnon-pollutingBintegrated mariculture system, Eilat, Israel. Mar. Ecol.: Prog. Ser. 118, 25–36. Loosanoff, V.L., 1949. On the food selectivity of oysters. Science 110, 122.
Loosanoff, V.L., Tommers, F.D., 1948. Effect of suspended silt and other substances on rate of feeding of oysters. Science 107, 69–70.
Manahan, D.T., Wright, S.H., Stephens, G.C., Rice, M.A., 1982. Transport of dissolved amino acids by the mussel, Mytilus edulis: demonstration of net uptake from natural seawater. Science 215, 1253–1255. Menzel, R.W., 1955. Some phases of the biology of Ostrea equistris Say and a comparison with Crassostrea
Ž .
Õirginica Gmelin . Publ. Inst. Mar. Sci., Univ. Tex. 4, 69–153.
Newell, R.I.E., Jordan, S.J., 1983. Preferential ingestion of organic material by the American oyster,
CrassostreaÕirginica. Mar. Ecol.: Prog. Ser. 13, 47–53.
Oki, Y., Fushimi, A., 1992. Nutrient removal potential of several aquatic weeds. Abstracts of the Aquatic Plant Management Society, 32nd Annual Meeting and International Symposium on the Biology and Manage-ment of Aquatic Plants, pp. 10–11.
Parsons, T.R., Maita, Y., Lalli, C.M., 1989. A Manual of Chemical and Biological Methods for Seawater Analysis. Pergamon, Oxford.
Peckol, P., Demeo-Anderson, B., Rivers, J., Valiela, I., Maldonado, M., Yates, J.T.I., 1994. Growth, nutrient uptake capacities and tissue constituents of the macroalgae Cladophora Õagabunda and Gracilaria
tikÕahiae related to site-specific nitrogen loading rates. Mar. Biol. 121, 175–185.
Phillips, M.J., Lin, C.K., Beveridge, M.C.M., 1993. Shrimp culture and the environment: lessons from the world’s most rapidly expanding warmwater aquaculture sector. In: Pullin, R.S.V., Rosenthal, H., Maclean,
Ž .
J.L. Eds. , ICLARM Conf. Proc. 31, pp. 171–197.
Pomeroy, L.R., Haskin, H.H., 1954. The uptake and utilisation of phosphate ions from sea water by the
Ž .
American oyster CrassostreaÕirginica Gmel. . Biol. Bull. 107, 123–129.
Pomeroy, L.R., Smith, E.E., Grant, C.M., 1965. The exchange of phosphate between estuarine water and sediments. Limnol. Oceanogr. 10, 167–172.
Primavera, J.H., 1994. Environmental and socioeconomic effects of shrimp farming: the Philippine experience. Infofish Int. 1, 44–49.
Qian, P.-Y., Wu, C.Y., Wu, M., Xie, Y.K., 1996. Integrated cultivation of the red alga Kappaphycus alÕarezii
and the pearl oyster Pinctada martensi. Aquaculture 147, 21–35.
Retamales, C.A., Martinez, A., Buschmann, A.H., 1994. Long term productivity and agar yield of Gracilaria
chilensis tank culture in southern Chile. Rev. Biol. Mar., Valparafso 29, 251–261.
Riise, J.C., Roos, N., 1997. Benthic metabolism and the effects of bioturbation in a fertilised polyculture fish pond in Northeast Thailand. Aquaculture 150, 1–2.
Rivers, J.S., Peckol, P., 1995. Interactive effects of nitrogen and dissolved inorganic carbon on photosynthesis, growth, and ammonium uptake of the macroalgae CladophoraÕagabunda and Gracilaria tikÕahiae. Mar.
Biol. 121, 747–753.
Ryther, J.H., Corwin, N., DeBusk, T.A., Williams, L.D., 1981. Nitrogen uptake and storage by the red algae
Ž .
Gracilaria tikÕahiae McLachlan, 1979 . Aquaculture 26, 107–115.
Saijo, Y., Mitamura, O., 1971. Regeneration of nutrients in the waters of a coastal oyster bed. In: Uda, M.
ŽEd. , The Ocean World. Jpn. Soc. Promotion Sci, Tokyo, pp. 242–248..
Shpigel, M., Neori, A., Popper, D.M., Gordin, H., 1993. A proposed model forAenvironmentally cleanB land-based culture of fish, bivalves and seaweeds. Aquaculture 117, 115–128.
Sornin, J.-M., Feuillet, M., Heral, M., Fardeau, J.C., 1986. Influences des cultures d’huitres Crassostrea gigas sur le cycle du phosphore en zone intertidale: role de la biodeposition. Oceanol. Acta 9, 313–322. Taylor, R.B., Peek, J.T.A., Rees, T.A.V., 1998. Scaling of ammonium uptake by seaweeds to surface area:
Tenore, K.R., Dunstan, W.M., 1973. Comparison of feeding and biodeposition of three bivalves at different food levels. Mar. Biol. 21, 190–195.
Ugarte, R., Santelices, B., 1992. Experimental tank cultivation of Gracilaria chilensis in central Chile. Aquaculture 101, 7–16.
Ž .
Vergara, J.J., Niell, F.X., Torres, M., 1993. Culture of Gelidium sesquipedale Clem. Born. et Thur. in a chemostat system: biomass production and metabolic responses affected by nitrogen flow. J. Appl. Phycol. 5, 405–415.
Wajsbrot, N., Krom, M.D., Gasith, A., Samocha, T., 1989. Ammonia excretion of green tiger prawn Penaeus
semisulcatus as a possible limit on the biomass density in shrimp ponds. Isr. J. Aquacult. Bamidgeh 41,
159–164.
Wheeler, W.N., 1980. Effect of boundary layer transport on the fixation of carbon by the giant kelp
Macrocystis pyrifera. Mar. Biol. 56, 103–110.
Yonge, C.M., 1926. Structure and physiology of the organs of feeding and digestion in Ostrea edulis. J. Mar. Biol. Assoc. U.K. 14, 295–386.
Ž .
Zeitzschel, B., 1980. Sediment water interactions in nutrient dynamics. In: Tenore, K.R., Coull, B.C. Eds. , Marine Benthic Dynamics. University of Southern California Press, Columbia, pp. 195–218.