Effectiveness and effects of attempts to
regulate the UK petrol industry
Nigel Driffield
a,U, Christos Ioannidis
ba
Cardiff Business School, Aberconway Building, Colum Dri¨e, Cardiff CF1 3EU, UK
b
Department of Economics and Finance, Brunel Uni¨ersity, Uxbridge UB3 3PH
Abstract
This paper evaluates the impact that investigation and regulation of the UK petrol industry has had on the profitability of the companies. Using a gross margin for petrol, we estimate a series of variable parameter autoregressive processes. The results demonstrate that the 1979 Monopolies and Mergers Commission investigation into the industry, caused a long-term decline in profit margins in the industry, despite the fact that no recommenda-tions or undertakings were made. This cannot, however, be said for subsequent investiga-tions.Q2000 Elsevier Science B.V. All rights reserved.
JEL classifications:L10; L51
Keywords:Petrol margins; Regulation; monopolies and Mergers Commission
1. Introduction
The petrol industry is one of the most investigated industries in the UK. It has experienced in the past 20 years, two Monopolies and Mergers Commission industry investigations, and two investigations by the House of Commons Trade
Ž .
and Industry Select Committee 1988a,b . In all of the investigations since 1979, the various committees have found that while the industry is a ‘complex monopoly’, there is nothing evident in the industry’s conduct which is against the public interest.
U
Corresponding author.
0140-9883r00r$ - see front matterQ2000 Elsevier Science B.V. All rights reserved.
Ž .
This paper will focus on the impact on the gross margin of the main
investiga-Ž
tions into the industry, the two MMC enquires The Monopolies and Mergers
.
Commission, 1979, 1990 . These investigations have essentially been concerned with the oligopolistic nature of the petrol industry, and the possible anticompetitive effects. However, the only outcome of these has been for the Office of Fair
Ž .
Trading OFT to ‘keep the industry under review’. This is despite the fact that the industry has many characteristics which are associated with anticompetitive con-duct and monopoly rents.
Section 2 is concerned with a description of why monopoly profits are likely in the petrol industry. Section 3 outlines the investigations that have been carried out into the potential for monopoly abuse, and Section 4 focuses on the impact of the investigations on the profit margin. Section 5 outlines the procedures used in the analysis, while Sections 6 and 7 present the results and conclusions.
2. Oligopoly in the UK petrol market
The five firm concentration ratio was above 70% during the period 1973]1993, and as such, the likelihood of monopoly pricing in the industry is high. The
Ž .
Monopolies and Mergers Commission 1990 reports that there is very little variation in price across firms, and the market shares of the five leading companies have been very stable over time. In addition, there is significant evidence of sticky
Ž . Ž .
pricing in petrol Bacon, 1991 . Borenstein et al. 1997 show that retail petrol prices in the US, respond faster to oil price increases than they do to oil price falls. They attribute this to asymmetry in the costs of inventory adjustment, but also possibly to the oligopolistic nature of the industry.
2.1. Vertical restraints in petrol supply
The MMC determined in 1979 that the industry was a ‘complex monopoly’ in favour of the major firms, as a result of vertical restraints. The most obvious efficiency explanation for vertical restraints or vertical integration in the petrol industry is the ‘double marginalisation’ principle. The industry has, however, never used this argument, denying that upstream monopoly power exists. Rather, in
Ž .
submissions to the The Monopolies and Mergers Commission 1990 , the large
w
petrol companies have employed the ‘Chicago School’ argument see for example
Ž . Ž .x
Bork 1978 , or Posner 1981 to defend their position. In addition, one of the most powerful arguments in favour of permitting the vertical relations in the petrol
Ž .
industry is put forward by Dobson and Waterson 1996 . They suggest that, as there are no economies of scope in petrol retailing, the stance taken by the MMC to view these arrangements as not against the public interest is a fair one.
Ž .
Ž .
competition. Slade 1993 demonstrates a similar result in a study of petrol retailing in Vancouver. While it would appear to be the case that oil companies gain from these arrangements, the extent to which the retailers gain is a function of local market conditions.
2.2. Price discrimination
The petrol companies utilise the system of Selective Price Support. Under these agreements, wholesalers provide retailers with discounted prices, in locations
Ž .
where they face significant inter-brand competition. Gupta et al. 1994 show that spatial price discrimination will serve to increase monopoly profits, while
Arm-Ž .
strong and Vickers 1993 show that, when used to protect certain markets, such price discrimination can form a significant barrier to entry.
2.3. Empirical e¨idence of pricing and oligopolistic interaction in the petrol industry
Much of the work carried out in this area focuses on petrol pricing within an
w Ž .
oligopolistic market in North America see, for example, Slade 1990, 1992, 1993
Ž .x Ž .
and Borenstein and Shepard 1996 . Borenstein and Shepard 1996 , for example, report significant evidence of tacit collusion between petrol retailers, based on a standard model of petrol prices. However, given the extensive vertical links that exist within the UK petrol industry, we focus, not merely on the retail price, but on the gross margin which is generated by the companies, as a more suitable indicator of conduct and performance.
3. Investigation into the UK petrol industry
( )
3.1. Monopolies and Mergers Commission in¨estigation 1979
The 1979 MMC investigation concluded that a ‘complex monopoly’ existed in
Ž .
favour of the petrol companies there are 15 companies listed in the report . That is to say that ‘one or more of the companies.... conduct their respective affairs by means of one or more specified practices as in any way to prevent, restrict or
Ž .
distort competition’ The Monopolies and Mergers Commission, 1979, p. 49 . The main area of concern was the extent of discriminatory pricing, through the system of rebates and selective price support. However, in spite of this, the MMC took the view that the actions of the companies in this respect were not against the public interest, and as such should be permitted.
3.2. The 1990 MMC in¨estigation
In contrast with the previous report, the 1990 investigation discusses pricing of petrol at length. The commission found that pump prices follow the Rotterdam spot price, and that there was little reason to assume monopoly profits in the industry. The analysis employed by the MMC, however, is somewhat simplistic, and
Ž .
several of their conclusions have, however, been questioned. Bacon 1991 , for example, demonstrates that petrol price responses to oil price changes are asym-metric.
Despite this evidence of monopoly behaviour, there are several explanations of why the commission again came to the conclusion that the conduct of the petrol companies was not against the public interest. Much of the reasoning was based on the increasing market share of supermarkets in petrol retailing, acting to increase competition. However, by 1988 the share of the market controlled by supermarkets had only increased to 5.5%, while sites directly controlled by wholesalers still accounted for 54%.
3.3. Other in¨estigations and regulations
Having outlined the major investigations into the UK petrol industry, the discussion briefly turns to other regulations or investigations and their potential impact on profitability.
A major factor in the subsequent referral of the industry was the recommenda-tion of the Trade and Industry Select Committee that the industry be investigated again. The Committee’s concerns surrounded price differences over small geo-graphical distances, supported through the Selective Price Support system. The investigation that was carried out by the House of Commons Trade and Industry
Ž .
Select Committee 1988a took the view that intra-firm price differences provided evidence of some monopoly pricing in particular locations. They concluded, how-ever, that this was an extremely complex issue, and recommended a reference to the MMC. One would not anticipate a change in conduct of the companies during such an investigation, given the limited powers of stricture that the Select Commit-tee possesses.
Ž . 1
The Price Marking Petrol Order came into operation in January 1981. This was introduced to ensure that prices were displayed in gallons as well as litres, as litres were viewed at the time to be misleading. As such, displaying prices in the more ‘transparent’ pence per gallon, was viewed as facilitating greater competition. This has since been superseded by European regulations. One would expect the introduction of this regulation to have a negative impact on margins, although this effect is likely to be somewhat limited.
1 Ž .
4. The impact of investigations
Ž .
Following the above discussion, and the empirical work by Bacon 1991 and
Ž .
Driffield 1999 , a two-part hypothesis can be formed. Firstly, that petrol compa-nies were able to generate some monopoly rents over at least a part of the period leading up to the investigations. Secondly, that the investigations and subsequent regulation had an impact on profit margins. One possibility is that these firms were engaging in monopoly pricing, and amended their conduct as a result of the threat of action by the MMC. This would be particularly pertinent to the 1979 investiga-tion, as there had been significant criticism of the industry following the 1975 oil price shock.
4.1. The data2
The data used here are monthly from May 1973 to April 1993. The net petrol price is retail price minus excise duty and VAT, while the oil price is the sterling equivalent price of a gallon of oil.3
4.2. Analysis of the profit margin
To determine whether the attempts to investigate the pricing behaviour of the oil companies were effective, we need to generate a statistical proxy which captures the ‘profit’ incorporated into the retail price of petrol.
Ž . Ž .
Driffield 1999 , and Driffield et al. 1999 established that the ‘equilibrium’ price of petrol is log-linearly related to the price of oil and the retail price index
Žacting here as a portmanteau variable, which captures all other costs ..
The most volatile of the two elements is the spot price of oil, which of course will be resonate in petrol prices. We impose this restriction and argue that oil prices are fully reflected in petrol prices.
We therefore calculate a margin for the petrol companies, given by:
Ž .
fsnet petrol priceyoil price £
This therefore generates the component of petrol price, which is fully indepen-dent of the price of oil. This allows us to study the behaviour of retail prices after fluctuations in the price of the ‘main’ input have been fully discounted. Therefore the main cause of ‘breaks’ in f will be caused either by discrete changes in costs andror discrete changes in the ‘profit’ margin.
2
With the exception of the petrol price data, and the excise duty, which are taken from the Digest of UK Energy Statistics, and the Herfindahl index, which is taken from the MMC 1990 report all the data can be extracted from Datastream.
3
Fig. 1. Oil spot price and net retail petrol price.
Fig. 1 then illustrates the spot oil price, and retail petrol prices.4
In order therefore to examine the conduct of the petrol companies, this paper focuses on the aggregate profit margin, and the impact on this of various attempts to investigate or regulate the industry.
We first present some graphical evidence based on the decomposition of the margin into a flexible trend, which captures fluctuations in low frequencies and cyclical and other high frequency random fluctuations. The Hodrick]Prescott
Ž .
filter, Hodrick and Prescott 1984 allows the data to determine this trend by
Ž . Ž .
splitting the series into a low frequency trend and higher frequency cyclical components.
Ž .
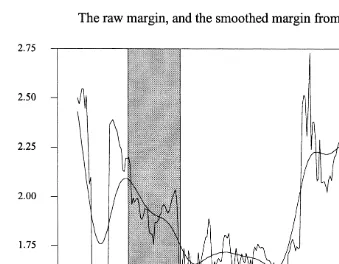
Fig. 2 illustrates the ‘raw’ margin data, and the smoothed trend data using the filter. The shaded periods are the times between the announcements of MMC enquiries, and the completion of the report. In both cases, it is clear that the ‘trend’ in petrol margins declined as soon as an enquiry was announced. This therefore tentatively suggests that the petrol companies modified their behaviour once an investigation was announced.
While this provides an interesting insight into the possible impact of the MMC out measure of ‘profit’, it is not sufficient to demonstrate that profit margins were
4
Fig. 2. The raw margin, and the smoothed margin from the HP filter.
previously abnormally high, nor does it provide information as to the duration of the ‘profit margin’ reduction in relation to its ‘trend’ value.
5. Investigations and changes in the petrol margin
Consider the regression:
Ž . Ž .
ptsa0qA L pty1qut 1
Ž .
where pt is the variable of interest,a0 is the constant term A L is a polynomial in the lag operator and ut is a white noise error term. Define the dummy variable
Ž .
Dsts1 if the date is ‘on or after date s’ when the event occurs , and zero otherwise.
Conventionally, dummy variables are used to augment the regression
Ž . Ž .
ptsa0qA L pty1qb Ds stqut 2
In effect then bs is measuring the magnitude of the hypothesised mean change that occurred in date s.
However, when there are several such breaks that may counteract each other the parameter vector bs will not be precisely estimated, and furthermore, the sec-ondary question of whether the break persisted into the long-term cannot be adequately answered.
Ž .
To avoid such problems Willard et al. 1996 follow a procedure suggested by
Ž . Ž .
Banerjee et al. 1992 which mimics that of Hamilton 1989 although is computa-tionally less cumbersome. The procedure estimates by a series of autoregressive
Ž .
processes using a rolling regression of fixed window length and sequentially tests for the significance of the coefficient of the dummy variable. When the hypothesis is strongly rejected, one is able to identify the period of break, and using the ‘latest’ estimated parameters estimate the short- and long-run change in the mean of the series due to the event. By estimating a series of rolling regressions, this approach implies that both the constant term and the autoregressive parameters change over time, and in addition the results will be conditioned on the window length.
Ž .
Here we develop a similar approach that a takes into account explicitly the
Ž .
possibility of the moving parameters and b is independent of the arbitrarily chosen window length used in the rolling regressions.
We estimate the autoregressive process by a Kalman filter algorithm, thus the parameters are updated as to produce optimal forecasts. We then use the state vector to test whether its observed variability can be accounted by the presupposed events. Having taken into account the coefficient’s inertia we are then able to estimate the persistence of the break on the intercept.
This analysis involves the use of a Kalman filter to analyse the movements in our margin.
5.1. Kalman filter analysis
5.1.1. State-space form
Ž .
Ž .
ftsItqqt)fty1qMt 3
Ž . Ž .
where E Mt s0 and var Mt sHt
The elements of the state vector are generally not observable but they are assumed to follow a first-order Markov process. This is incorporated in the transition equation.
Ž .
qtsTt)qty1qOt 4
whereTt is a square matrix
Ž . Ž .
E Ot s0 and var Ot sQt
To complete the specification of the state-space system two further assumptions are made.
v The initial state vector has a mean of b and a covariance matrix of P thus
0 o
Ž .
q0;N b0, Po .
v The disturbances Ot and Mt are uncorrelated with each other across all time
periods, and uncorrelated with the initial state.
Ž . Ž . Ž .
E Mt,Ot s0 E Mt,b0 s0 E Ot,b0 s0
Ž .
For a detailed account of the technique see Harvey 1989 .
The essential advantage of this process, is that it allows for the continual
Ž .
updating of parameters as more information becomes available. Slade 1989 , for example, demonstrates the gain from this procedure in modelling price wars. In the case presented here, however, rather than the companies updating their informa-tion on the demand equainforma-tion, they are effectively updating their supply behaviour based on anticipated regulatory action. The use of the Kalman filter allows for the presence of an autoregressive process in the parameters. This therefore allows the impact of any change due to regulation to be carried beyond the period of regulation. Thus, if there is an exogenous factor which acts to change the margin, the influence of this factor will continue beyond the period of the shock.
The process here uses an expression for the margin,ft:
Ž .
ftsatqb1t)fty1qb2t)fty2qut 5
The Kalman filter is applied to this, to extract a, which is the ‘long-run’ or ‘mean’ margin. This, however, is not merely a fixed coefficient, as the Kalman filter technique continually updates it given new information. It is then possible to test the extent to which exogenous influences impact on this long-run margin.
Thus, the final expression which is used to evaluate the long-run impact of investigation or regulation is:
7 Ž .
a scqc )a qÝ c)D q« 6
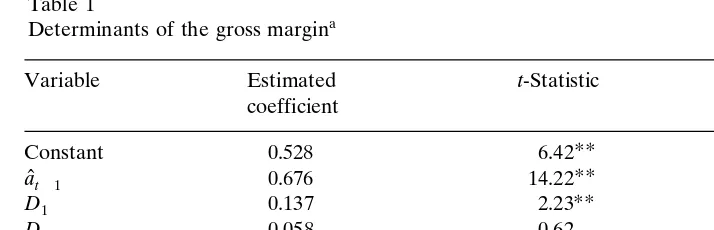
Table 1
a
Determinants of the gross margin
Variable Estimated t-Statistic P-Value
coefficient
Significant at the 95% level. Mean of dependent variables1.603; S.D. ˆt
of dependent var.s0.4708; sum of squared residualss22.76; variance of residualss0.099; S.E. of
2 2 w x
regressions0.3139; R s0.568; adjusted R s0.556; Durbin’s hs0.096 Ps0.923 ; Durbin’s h
w x w x
alternatives0.288 Ps0.773 ; BreuschrGodfrey LM: ARrMA1s0.0831 Ps0.773 .
where D is the set of dummy intervention variables given above. The possible causes of changes in the margin are as follows:
D1s1 for the duration of the 1979 MMC report;
D2s1 for the duration between the publication of the report and any decision made by the Secretary of State;
D3, D4 as above for the 1990 report;
D5 the duration of the Trade and Industry Select Committee investigation; and
D6s1 for the duration of the imposition of the petrol price marking order.
Given the very nature of a
ˆ
t variable, this a very rigorous test of the long-runŽ .
impact of intervention. The results from the estimation of Eq. 6 by OLS are given in Table 1.
6. Results
The results here show clearly that the instigation of the 1979 MMC inquiry had a significant negative effect on the margins of the petrol companies. This result would appear to contradict the MMC, that the petrol companies were not generat-ing monopoly profits, as the companies responded to the announcement of the investigation by reducing their margins. All other investigations, or attempts at regulation, such as the Marking Order, have been ineffective at reducing profitabil-ity. The instigation of the second report did not have similar effect on profitabilprofitabil-ity. This is the expected result. The MMC had already given the industry a favourable verdict in 1979, so the industry had little reason to suppose that its conduct would be found to be against the public interest the second time.
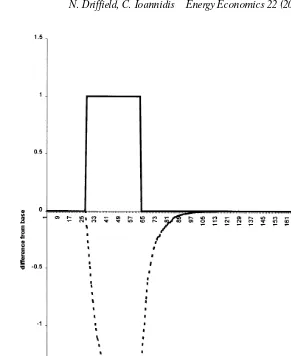
Fig. 3. The impact on the MMCA investigation on the margin.
6.1. Simulations
To ‘simulate’ the behaviour on the profit margins of the impact of the MMC report we solve the ‘margin’ and ‘intercept’ equations dynamically and compared the evolution of the margin with and without the investigation. This simulation captures the full effect of the inertia inherent in the estimated variable coefficients on the dependent variable f.
Ž . Ž .
The graph Fig. 3 shows that profit margins fell rapidly sim1 within the first
Ž .
As such, therefore, given the previous findings of the MMC, there was little reason for the companies to anticipate an adverse finding 11 years on. Finally,
Ž .
concerning the deliberations of the MMC in general, Clarke et al. 1997 report that the likelihood of an industry being found to be not acting against the public interest has significantly increased since 1979. In addition, there is significant evidence that firms involved in more than one investigation learn a good deal from the experience in terms of how to put their case to the Commission, and in subsequent investigations hire specialists, and employ much higher levels of re-sources in producing their submissions than the first time, thus increasing their chance of ‘success’.
7. Conclusions
This paper demonstrates that the regulatory bodies in the UK inadvertently had a significant effect on consumption efficiency within the petrol industry. This is despite the fact that the industry has never been found to be acting against the public interest.
There are many reasons to believe that this industry may behave as a collusive oligopoly, and there is significant evidence of restrictive practices in the industry. Intra-brand competition is all but negated by the petrol companies, and horizontal restrictions act to severely limit inter-brand competition. While it is impossible to prove monopoly pricing on the part of the petrol companies, certain conclusions can be inferred. The threat of an adverse report, or government regulation of the petrol industry, was sufficient to change the conduct of the companies. This had the effect of reducing profit margins from 1977 onwards. There is also evidence that this effect persisted after the publication of the report. Finally, there is no evidence that any subsequent investigations have been as effective.
Appendix A. Unit root tests on the profit margin
Ž .
Unit root tests: Phillips]Perron test statistics Phillips and Perron, 1988
No. of lags 0 1 2 3 4
Test stat. y23.98 y25.96 y26.25 y26.92 y26.95
P-Value 0.03 0.02 0.02 0.02 0.02
References
Ž .
Armstrong, M., Vickers, J., 1993. Price discrimination, competition and regulation. J. Ind. Econ. 41 4 , 335]359.
Bacon, R.W., 1991. Rockets and feathers: the asymmetric speed of adjustment of UK retail gasoline
Ž .
Banerjee, A., Lumsdaine, R.L., Stock, J.H., 1992. Recursive and sequential tests on the unit root and
Ž .
trend break hypothesis: theory and international evidence. J. Bus. Econ. Stat. 10 3 , 271]287. Borenstein, S., Cameron, A.C., Gilbert, R., 1997. Do gasoline prices respond asymmetrically to crude oil
Ž .
price changes? Q. J. Econ. 112 1 , 305]339.
Ž .
Borenstein, S., Shepard, A., 1996. Dynamic pricing in retail gasoline markets. Rand J. Econ. 27 3 , 429]451.
Bork, R., 1978. The Anti-Trust Paradox. Basic Books, New York.
Clarke, R., Davies, S.W., Driffield, N.L., 1997. Appraising Monopoly Policy: Evidence from the UK.
Ž .
Edward Elgar forthcoming .
Dobson, P.W., Waterson, M., 1996. Vertical restraints and competition policy. OFT Research Papers, no. 12.
Ž .
Driffield, N.L., 1999. Regulation of the petrol industry: issues and evidence. Int. J. Econ. Bus 6 3 349]365.
Driffield, N.L., Ioannidis, C., Peel, D., 1999. Some further empirical evidence on the impact of oil price changes on petrol prices. Cardiff University Mimeo.
Gupta, B., Kats, A., Pal, D., 1994. Upstream monopoly, downstream competition and spatial price
Ž .
discrimination. Reg. Sci. Urban Econ. 24 5 , 529]542.
Hamilton, J.D., 1989. A new approach to the economic analysis of nonstationary time series and the
Ž .
business cycles. Econometrica 57 2 , 357]384.
Harvey, A.C., 1989. Forecasting, Structural Time Series Models and the Kalman Filter. Cambridge University Press, Cambridge.
Hodrick, R.J., Prescott, E.C., 1984. Post-war US business cycles: an empirical investigation. Working paper. Carnegie Mellon University, Pittsburgh.
Ž .
The Energy Committee. The Price Marking Petrol Order 1980. Statutory Instruments 1980, no. 1121. Trade and Industry Select Committee, 1988a. Second report: petrol retailing in the UK.
Trade and Industry Select Committee, 1988b. Third report: petrol retailing in the UK.
The Monopolies and Mergers Commission, 1979. Petrol: a report on the supply of petrol by wholesale. HMSO.
The Monopolies and Mergers Commission, 1990. The supply of petrol: a report on the supply in the United Kingdom of petrol by wholesale. HMSO.
Phillips, P.C.B., Perron, P., 1988. Testing for a unit root in time series regressions. Biometrika 75, 335]346.
Posner, R., 1981. The next step in the antitrust treatment of restricted distribution }per se legality. Univ. Chicago Law. Rev. 48, 6]26.
Slade, M.E., 1989. Price wars in price setting supergames. Economica 56, 295]310.
Slade, M.E., 1990. Strategic pricing models and interpretation of price-war data. Eur. Econ. Rev. 34, 524]537.
Slade, M.E., 1992. Vancouver’s gasoline-price wars: an empirical exercise in uncovering supergame strategies. Rev. Econ. Stud. 59, 257]276.
Slade, M.E., 1993. Strategic moves for vertical separation: evidence from retail gasoline. University of British Columbia Mimeo.
Ž .
Vickers, J., Waterson, M., 1991. Vertical relationships}an introduction. J. Ind. Econ. 39 5 , 445]450. Willard, K.L., Cuinnane, T.W., Rosen, H.S., 1996. Turning points in the Civil War: views from the
Ž .