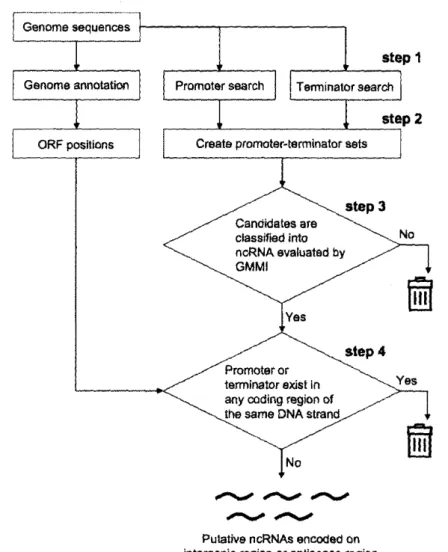
Seitai bunshi hairetsu no daikibo deta mainingu
Bebas
137
0
0
Teks penuh
(2) Notes Genre URL. Powered by TCPDF (www.tcpdf.org). ベキ則に従うことを初めて発見した解析について詳述する。統計物理学や複雑系科学の分野では 優先的選択成長モデルにおいてベキ則が生成され得ることが知られている。したがって、タンパ ク質におけるリン酸化修飾部位の獲得進化も優先的選択成長に従うという仮説モデルを提示し、 これを支持するバイオインフォマティクスの解析結果を示した。 先端生命科学プロジェクト2008年 Thesis or Dissertation http://koara.lib.keio.ac.jp/xoonips/modules/xoonips/detail.php?koara_id=0302-0000-0621.
(3) ISBN. 978-4-87762-217-6. SFC-DT 2008-002. arge-Scale. Data. Biomolecular On Gene Layout, RNA. Mining. of. Sequences Regulation, and Protein Phosphorylation. 2008年. 谷 内江 望 政策・メディア研究科 博士課程 先 端 生 命 科 学 プ ロ ジェ ク ト. 慶應義 塾 人 学 湘 南 藤 沢 学 会 博L.
(4) 優秀修士論文推薦の ことば. 谷 内 江 望 君 は在 学 中 、 国 際 論 文 誌 に 査 読 付 き 論 文 を筆 頭 著 者 と して5報 と して10報. 、 共 同著 者. 発 表 す る な ど生 命 科 学 に お い て め ざ ま し い 業 績 を残 しま した 。本 論 文 に は 、. これ らの 業 績 を リー ド した 谷 内 江 君 の 生 命 情 報 科 学 に お け る 方 法 論 が よ く ま と め られ 、 そ れ に よ って 得 られ た 新 た な 知 見 が 「 ゲ ノムDNAに. お け る遺 伝 子 配 置 」 「 非 翻 訳RNA. に よる遺 伝子 発現 制御 」 「 タ ン パ ク 質 リ ン酸 化 の 進 化 」 に つ いて 述 べ られ て い ま す 。 す ば ら し い機 知 に富 ん で お り、 今 後 の シ ス テ ム 生 物 学 研 究 が モ デ ル とす べ き 論 文 で す 。. 慶應 義塾大学 環境情報学部教授 冨田. 勝. 環境情報学部専任講師 斎藤輪太郎.
(5) Large-Scale. Data Mining. of Biomolecular. Sequences. On Gene Layout,RNA Regulation,and Protein Phosphorylation.
(6) Keio. University.
(7) Large-Scale. Data. Biomolecular. Mining. of. Sequences. On Gene Layout, RNARegulation, and Protein Phosphorylation. NOZOMU. In partial. fulfillment. YACHIE. of the requirements. the degree of Doctor of Philosophy. KEIO UNIVERSITY Fujisawa, Japan February 2009. for.
(8) my family.
(9) ACKNOWLEDGMENTS. First, I would like to thank Professor Masaru Tomita for providing an innovative research environment and inspiring me at Keio University SFC (Shanan Fujisawa Campus, Fujisawa, Japan) and IAB (Institute for Advanced Biosciences, Tsuruoka, Japan), where all of the ideas for this work were conceived. He has sometimes sent my scientific thinking in new directions with his fantastic ideas, and his humanity and wonderful personality have greatly influenced me.. Assistant Professor Rintaro Saito has provided. me with expert knowledge in. computational biology. Dr. Koji Numata has supported me over long periods as a wonderful mentor, with his skillful techniques in bioinformatics. Professor Akio Kanai has educated me on experimental techniques for use in molecular biology and on the excitement that science can bring. Professor Tomoyoshi Saga has encouraged me to continue constructive work in the field of science and has helped me to promote my work. I have learned much from Associate Professor Yasuhiro Naito about the need to reflect the philosophical aspects of science. I am also grateful to Associate Professor Yasushi Ishihama and Dr. Yoshiaki Ohashi for their sophisticated advice and discussions, to Asako Saga, Satoshi Harada, and Dr. Yoko Fukuda for their excellent experimental support, and to Professors Mitsuhiro Itaya and Hirotada Mort for providing bacterial strains. I would like to again thank the members of my thesis committee, Professor Masaru Tomita, Professor Akio Kanai, Professor Tomoyoshi Saga, and Assistant Professor Rintaro Saito. I appreciate the valuable time that I spent with the members of the laboratory. I would like to say thank you to Dr. Naoyuki Sugiyama, Dr. Shigeo Fujimori, Dr. Hitomi Sane, Koshi Imami, Anton Kratz, Yoshiteru Negishi, Kazuhide Sekiyama, Mikiko Hattori, Atsuko Kishi, Yuki Okada, Kosaku Shinoda, Yuka Watanabe, Aya Furusaki, Motomu Matsui, Taiko.
(10) Nishino, Junichi Sugahara, Tsuyoshi Akuzawa, Nobuaki Kono, Hiroyuki Nakamura, Satoshi Tamaki, Atsuko Shinhara, and Haruna Imamura, with whom I have enjoyed studying and working. I respect the intelligence of Yosuke Ozawa. We often enjoyed happy and stimulating conversations over delicious food and coffee. As a smart young scientist, Dr. Kazuharu Arakawa has been a role model for me. We have launched several challenging projects, and his wisdom has always excited me. This research was supported by a Grant-in-Aid from the Japan Society for the Promotion of Science (JSPS) and by research funds given by Yamagata Prefecture and Tsuruoka City to Keio University. Finally, I would like to express my special thanks to my family. My wife Ayako supports me daily. Her glorious smile and good cooking have brought an abundance of energy to my arduous student life. Moreover, as a scientist who already holds a doctorate, she has given me much good advice and has proofread this dissertation. I sincerely appreciate her help. We were married in September last year, and 3 months later Ayako became pregnant. We were having a wonderful time and looking forward to welcoming this new life to our family. However, sadly, our little baby was gone in the seventh month of pregnancy. The baby was a boy—we named him Mamoru. Since Ayako's pregnancy I have reflected strongly on my wonderful life, and I am profoundly grateful for my son's blessed but short existence in this world. We believe that our son continues to watch over our partnership. My life also involves my parents, sister, and grandparents, my wonderful parents-in-law, and my artistically gifted brother-in-law. Especially, I sincerely thank my parents for their continual support, encouragement, and love. My current view of "family" has been greatly influenced by the love my mother gave me in my childhood. My father was the first scientist in my life. I sometimes remember his younger days and the way he thought when I was a child. I think his daily approach to life has educated me well, and I am proud to think that my mindset has grown closer to his as the years have passed..
(11) SUM. Y. We performed 3 bioinformatics analyses to elucidate molecular function and evolution in the gene expression process. Recent genomics and transcriptomics have identified a huge amount of RNA transcripts actually encoded in the genome and have, surprisingly, shown that the genome is overcrowded with genes. As a side-effect, this gene overcrowding may carry the risk of overlapping of transcription signals, causing gene expression errors. In our first analysis, we examined this gene layout problem and determined that the positions of compactly encoded bacterial genes and their termination motifs have been optimized to minimize mis-termination of overlapping genes and to maximize bl-directional termination of adjoining genes on opposite strands. After RNAs are transcribed under complex constraint in the genomic context, they have two main fates: to be translated into protein, or to function as non-protein-coding RNA (ncRNA), which is thought to have structural, regulatory, or catalytic properties. Although ncRNAs are currently recognized as a major class of RNA transcripts, most of their functions are still unknown. In our second analysis, to search exhaustively for novel ncRNA-encoding genes, we developed a new computational procedure. By biological experiments we confirmed the expression of predicted candidates, and we finally suggested that cells contain many antisense ncRNAs that function to regulate the genes encoded on their complementary DNA strands. Many translated proteins require post-translational modifications to regulate cellular pathways. Recent phosphoproteome technologies have provided new insights into the extensive presence of protein phosphorylations and have raised the interesting question of how this protein modification was gained evolutionarily on such a large scale. In our third analysis, an evaluation of phosphoproteomics data revealed that phosphoproteins follow a.
(12) power-law distribution. with regard to their numbers. the power-law rule is considered with the support rich-get-richer. to be produced. of phosphosites.. by a "rich-get-richer". of the results of our bioinformatics. process applies to phosphosite. Keywords: Bioinformatics. accumulation. In statistical physics, process. Therefore,. analyses, we suggested over evolution.. • Data mining • Genomics • Transcriptomics. • Proteomics. that the.
(13) 論文題 目 「生体 分子 配列 の大 規模 デー タマ イニ ング」. 論文要 旨 生 命 を構 成 す る分 子 と それ ら が 介 在 す る反 応 に つ い て 網 羅 的 解 析 が 可 能 と な り、我 々 は 膨 大 か つ 多 次 元 に 渡 る生 命 情 報 を 手 に す る よ う に な っ た 。 本 論 文 で は 、DNA、 RNA、 タン パ ク質 に つ い て 、計 算 機 科 学 と統 計 的 手 法 を 駆 使 して 大 規 模 デ ー タ マ イ ニ ン グ を 行 い 、生 命 現 象 に つ い て の 一 般 化 可 能 な 特 徴 を 引 き出 し て議 論 した 。 原 核 生 物 の ゲ ノ ムDNA上 で は非 常 に 多 くの 遺 伝 子 が 密 に 配 置 され て い る こ とが 知 ら れ て い る 。 この よ う に遺 伝 子 が 密 集 した 場 合 、遺 伝 子 の 転 写 シ グ ナ ル が 近 接 す る別 の 遺 伝 コー ドに 重 複 して 、遺 伝 子 発 現 エ ラ ー を 引 き 起 こす 可 能 性 が あ る。 第 二 章 で は 、ゲ ノ ム 構 造 が この リ ス ク を 回 避 しつ つ 最 大 限 の 効 率 を 可 能 に して い る こ と を 見 い だ し、遺 伝 子 配 置 に お い て 生 命 が と る最 適 化 戦 略 に つ い て 議 論 した 。 RNA分. 子 は、DNAの. 遺 伝 コー ドか ら転 写 後 、 タ ンパ ク質 へ 翻 訳 さ れ る 際 の鋳 型 と して 機. 能 す る。一 方 で 、 ト ラ ン ス ク リプ ト ミ ク ス 解 析 は 、 タ ンパ ク質 を 翻 訳 せ ず 核 酸 分 子 と して 機 能 す る 非 翻 訳RNAが 分 の 非 翻 訳RNAの. 細 胞 内 に 多 く存 在 す る こ とを 明 らか に し た 。 しか しな が ら、 大 部 機 能 は未 知 で あ る。 第 三 章 で は 、 大 腸 菌 に お い て 新 規 の 非 翻 訳RNA. を コ ー ドす る 遺 伝 子 を ゲ ノ ム レベ ル で 予 測 す る手 法 を 開 発 した 。 また 、実 験 生 物 学 に よ る 検 証 を 行 い 、 ア ン チ セ ン スRNAと 現 して い る こ と を 示 し、非 翻 訳RNAに 多 くの タ ン パ ク質 はRNAか. して機 能 し得 る 非 翻 訳RNAが. 実 際 に 細 胞 内 で 多 く発. よ る遺 伝 子 発 現 制 御 メ カ ニ ズ ム について 議 論 した 。. ら翻 訳 さ れ た 後 に 化 学 的 修 飾 を 受 け て 細 胞 内 で の 機 能 を 達 成. す る。特 に 、細 胞 内 で の 重 要 な機 能 実 現 の た め に種 を 超 え て 用 い られ る タ ンパ ク質 修 飾 が リ ン 酸 化 で あ る 。近 年 の プ ロ テ オ ミ ク ス 解 析 か ら、膨 大 な 数 の リ ン酸 化 修 飾 が 細 胞 内 で 実 際 に起 こ っ て い る こ とが 示 され て お り、リ ン酸 化 修 飾 が ど の よ う な 生 物 学 的 意 義 に 従 っ て 進 化 し て き た の か 興 味 深 い 。第 四 章 で は、 ヒ トや マ ウ ス な ど に お け る個 々 の タ ンパ ク質 が 持 っ リ ン酸 化 修 飾 部 位 の 数 の 分 布 が ベ キ 則 に 従 う こ とを 初 め て 発 見 した 解 析 に つ い て 詳 述 す る。統 計 物 理 学 や 複 雑 系 科 学 の 分 野 で は優 先 的 選 択 成 長 モ デ ル に お い て ベ キ 則 が 生 成 され 得 る こ とが 知 られ て い る。 した が っ て 、 タ ンパ ク 質 に お け る リ ン酸 化 修 飾 部 位 の 獲 得 進 化 も優 先 的 選 択 成 長 に従 う とい う仮 説 モ デ ル を提 示 し、これ を 支 持 す る バ イ オ イ ン フ ォ マ テ ィ ク ス の 解 析 結 果 を 示 した 。. キ ー ワ ー ド:バ. イ オ ィ ン フ ォ マ テ ィ ク ス ・デ ー タ マ イ ニ ン グ ・ゲ ノ ミ ク ス ・. ト ラ ン ス ク リ プ ト ミ ク ス ・プ ロ テ オ ミ ク ス.
(14) Contents. List of Figures. xv. List of Tables. 1. 2. xvii. Introduction. 1. 1.1. What We Can Find Out about Life fr em a Wealth of Information. 2. 1.2. Omics Data Surrounding. 4. 1.3. Philosophy behind this Dissertation. 7. 1.4. Report Organization. 7. Optimized. Layout. 2.1. Introduction. 2.2. Experimental. the Dogma. of Genes under. Physical. Constraint. of DNA. 9. 9. Procedures. 12. 2.2.1. Genome Annotation. and Sequence Data. 2.2.2. Preparation of Data on 3!-end Positioning and Operon Categ cries. 12. 2.2.3. Prediction of Rho-independent. 13. 2.2.4. Characteristic Analyses of Predicted Intrinsic Terminators. Terminators. 12. 14.
(15) Contents. xii. 2.2.5. Estimation Terminators. of Occurrence with Respect. Ratio of Predicted to Each Position. Rho-independent around. 3!-end. of. Genes 2.3. 15 16. Results and Discussion 2.3.1. Comparison. of 3!-end. Positioning. Types within. Each Operon 17. Category 2.3.2. Bi-directional. Properties. of Intrinsic. Rho-independent. Terminators 2.3.3. Optimization. 19 of E. coll Gene. Positioning. Associated. with Intrinsic. Terminators. 3. Discovery of New Non-coding. 22. and Antisense RNAs. 31. 3.1. Introduction. 31. 3.2. Experimental Procedures. 33. 3.2.1 Gapped Markov Model Index (GMMI). 33. 3.2.2 Sequence Data. 34. 3.2.3 Prediction of Putative Transcription Units. 34. 3.2.4 Identification of Putative ncRNA Genes Using the GMMI. 35. 3.2.5 Bacterial Culture, RNA Isolation. 37. 3.2.6 RT-PCR. 37. 3.2.7 Northern Blot Hybridization. 38. 3.2.8 Oligonucleotides. 38. Results. 39. 3.3. 3.3.1Analysis of Previously Annotated ncRNA Sequences Using the GMMI. 39.
(16) Contents. 3.4. 4. xiii. 3.3.2. Extraction. 3.3.3. Experimental. Candidate. Validations. ncRNAs. of ncRNA. 42. Candidates. 48. Discussion. 52. "Rich -get-richer" Protein. Process. of Phosphosite. Accumulation. over. Evolution. 4.1. Introduction. 4.2. Experimental. 4.3. of Novel. 57. 57. Procedures. 61. 4.2.1. Phosphosite Data. 61. 4.2.2. Proteome Sequences. 62. 4.2.3. Phosphoserine-based. 4.2.4. Distribution. 4.2.5. Characteristics of Phosphoprotein. 4.2.6. Probabilistic Logic-based Reannotation. 4.2.7. Localization of Phosphosites on Protein Surfaces. 65. 4.2.8. Sequence Consensus around Phosphosites. 66. Motifs. 62. of Phosphosite Numbers. among Proteins. Sequences of Phosphosite Numbers. Results. 5. 64. 68. 4.3.2. Localization of Phosphosites on Protein Surfaces. 76. 4.3.3. Sequence Consensus around Phosphosites with Each Protein. 79. 4.3.4. Model of Phosphoprotein. 83. Discussion. Philosophy. Evolution. 86. Discussion. 5.1. 63. 68. 4.3.1 Power-law Rule in Phosphoproteins. 4.4. 62. 91 of S cience Aspects. 91.
(17) xiv. Contents. 5.2. References. 5.1.1. Application. 5.1.2. Derivation. 5.1.3. Discovery. 5.1.4. Rich-get-richer. Concluding. of the Hypothetical of Optimized. Layout of Genes. of New Non-coding. Remarks. Evolution. Deductive. RNAs. Method by Analogy. by Enumerative. of Phosphoproteins. 91 95 Induction. by Abduction. 96 98 102. 105.
(18) of Figures. List. 1.1. Omics. Data Surrounding. the Central. 2.1. Characteristic. Analysis. 2.2. Distributions. of Rho-independent. of Predicted. Dogma. of Molecular. Rho-independent Terminators. Biology. 6. Terminators. around. s'-ends. 21. of All. Genes 2.3. Distributions `T. 2.4. 23 of Rho-independent. ail-to-head. Neighboring',. Terminators. `Tail-to-tail. around. Neighboring',. Overlapping',. and `Tail-to-tail. Overlapping'. Distributions. of Rho-independent. Terminators. and 'Within-operon'. Genes. s'-ends. of. `Tail-to-head. Genes around. 25 s'-ends. of. `O peron-end' 3.1. Transcription. 3.2. Isolation. 3.3. Schematic Extract. Unit Model. Representation. Putative. RT-PCR. 3.5. Northern. 4.1. Cumulative. Analysis. Correlation pS Sites. 40. Using the GMMI. of the Computational. Procedure. Used to. ncRNAs. 43. of the Putative. Blot Analysis Probability. Phosphoproteins 4.2. 36. of Each RNA Category. 3.4. 27. 49. in Log Phase. of New Small RNAs in E. coll Distribution. Obtained. between. ncRNAs. of Number. 51. of pS Sites within. from UniProt. Characteristics. of Phosphoproteins. 69 and Numbers. of 70.
(19) Listof Figures. xvi. 4.3. Probability. Distribution. Phosphoproteins 4.4. Cumulative. of Number. Obtained. Probability. Phosphoproteins. between. 4.6. Distribution. of Distances. of Phosphoprotein Sequence within 4.8. Example. Occurrence. 4.10. A Simulation. and Protein. Abundance. Two pS Sites within. Limited. Spaces. of Sequences. Surrounding. the pS Sites. Phosphoproteins. Percentages. Model. 81. of the Most Common. Having. Motifs. in. Many pS Sites. of Phosphoprotein. Attachment. Growth. Cumulative. Probability. Distribution. Deductive. 75. 78. Preferential. Hypothetical. 73. Sequences. Each Phosphoprotein 5.1. of pS Sites within. Set Number. between. Logo Representation. Phosphoproteins 4.9. Phosphosite. 71. of Number. of the Reannotated. Relationship. within. from UniProt. Distribution. 4.5. 4.7. of pS sites and S Residues. Simulated Methods. 82. Evolution. Based on the. Principle of Number. 84 of Phosphosites. in Our Computational. Model. Used in this Dissertation. within 85 94.
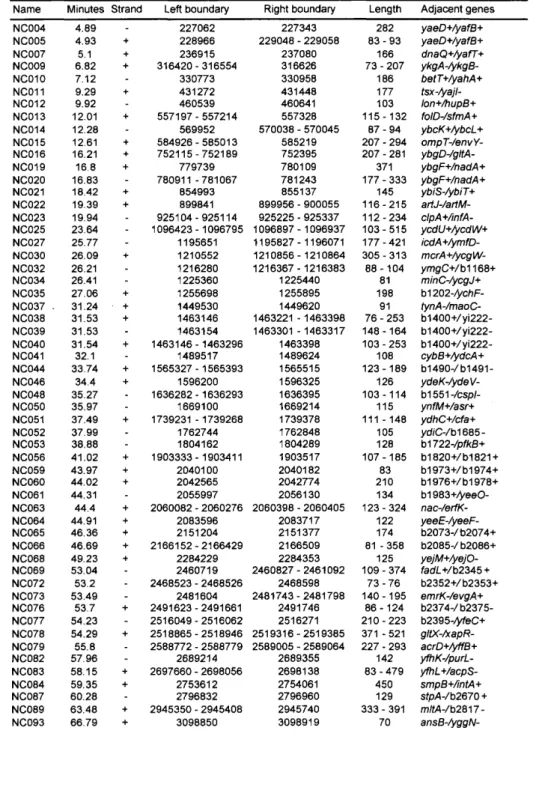
(20) List of Tables. 2.1. Numbers. of Genes. with Each s'-end. Categories. of Within-operon',. 3.1. Intergenic. ncRNA. 3.2. Antisense. ncRNA. 3.3. Documented. 4.1. The 20 Human Numbers. Positioning. `Operon-end',. Type within. and All Genes. Candidates. 46. sRNAs in Our Candidates. of pS Sites. 18 44. Candidates. Phosphoserine. the. Proteins. 47 Containing. the Highest 80.
(21) Chapter. 1. Introduction. But actuallyit is the whole(four-dimensional) pattern of the phenotype;the visibleand manifest natureof the individuatewhichis reproduced withoutappreciable change for generations, permanent within centuries—though not within tensof thousandsofyears—andborneat eachtransmissionby the materialstructureofthe nucleiof the twocellswhichunite toform thefertilizedeggcell.Thatis a marvel—thanwhich onlyone is greater;one that, if intimatelyconnectedwith it, yet lies on a differentplane.I meanthefact that we,whosetotalbeingis entirelybasedon a marvellous interplayof this verykind,yetpossessthepowerof acquiringconsiderable knowledge about it. I think it possible that this knowledge mayadvanceto littleshortof a complete understanding—of thefirst marvelThe secondmaywellbebeyondhumanunderstanding. – Erwin Schrodinger,"What is Life?".
(22) Large-ScaleData Mining of Biomolecula r Sequences. 2. 1.1 What. We Can Find. Since the dawn of molecular. Out. about. Life from a Wealth. biology with the disclosure. of Information. of the structure. ever-increasing demand to measure the details of intracellular components. of DNA,. an. and phenomena. has led to dramatic progress in the field of analytical chemistry. The recent high-throughput technologies of genomics, transcriptomics,. proteomics, and metabolomics. in the "omics" era. have provided a large volume of biological data that will help to clarify our understanding life. Recently, under these circumstances,. the discipline. of. of "systems biology" has appeared.. The concept of systems biology is to capture the entire picture of life as a huge ensemble of systems. Under this concept, by the utilization of computational ultimately. aims to reconstruct. our overall. understanding. approaches, this discipline. of living. systems from the. substantial details obtained by measuring all kinds of biological components different types of biological experiment.. in all kinds of. Now, in the overarching field of biology, there are. many movements toward a trend of systems biology having this reasonable belief. However, on the other hand, buzzphrase, number. the phrase "systems biology" usually and extensively sounds. and under this buzzphrase many scientists seem to be measuring an incredible. of intracellular. rebuilding. like a. parts of living systems at the molecular. level for a good cause,. all of them.. Although the progression of measurement. technologies that incorporate brilliant ideas is. fascinating and useful, as a young scientist in the early 21st century I think that the new scientific ways of observing huge amounts of biological data tend to be somewhat unwise and different from those in the previous era of molecular biology, when newly discovered roles or meanings. of biological. phenomena. thousands. to millions. application. of new high-throughput. were filled. of pieces of molecular technologies,. with. profound. information. insights.. concurrently. Within. yielded. the. by the. close explorations of each molecule have. seemed to slip into obscurity. The meaningful reconstruction. of living systems may never be.
(23) Introduction. 3. helped or achieved if we simply line up huge numbers of biological components and describe their elemental reactions. Our brains have limits to their ability to understand and logically connect large amounts of information at once, whereas a scientific society can historically accumulate huge amounts of knowledge without restriction. Moreover, even if a scientific society as a collectiveintelligence were to succeed in capturing the very big picture of a living system by a bottom-up reconstruction approach, no individual would be able to find the answer to the question of "What is life?" from the huge volume of complex information. In addition, for me, the whole exercise of listing and measuring every single biological event by large-scale analyses would seem a crashing bore. Things should be described as simply as possible. Complex systems should not be redescribed in complex ways. When the object being observed is described in terms of every single element from which it is constructed, it becomes hard to understand the essence of the object. A complete reconstruction from all the parts of a deconstructed car is just a car, whereas a system reconstructed in silica is sometime useful for simulation experiments, such as a wind-tunnel simulation of a formula car. In fact, a complete reconstruction represents merely the possibility of application of scientific processes; further purpose-oriented experiments are needed if we are to understand the reconstructed system. Before we put up the slogan of reconstructing living systems under the bright young science of systems biology, we should recognize which aspects of life we want to understand. I believe that, all through the ages, the best scientific way to deepen our overall understanding of life is to accumulate simple, clever, and optimized descriptions of partial aspects of life. Moreover, on this point, I think that one good use of omics data is the abstraction of richly pooled biological phenomena by computational data-mining..
(24) Large-ScaleData Mining of Biomolecular Sequences. 4. 1.2 Omics. Data. Surrounding. the Dogma. In 1958, Francis Crick was the first to propose the fundamental idea of the central dogma of life (Crick 1958). Even now, this beautiful picture remains one of the most important perceptions in the whole of biology. This is a very simple framework of the mediation of information transfer in living systems by three types of sequential information-carrying biopolymer: DNA and RNA (both of which are nucleic acids) and protein (Fig. 1.1). There are three universal flows of information through the intracellular reactions of biopolymers: DNA can be copied to DNA (DNA replication), DNA information can be transcribed into RNA (transcription), and proteins can be synthesized step-by-step in accordance with sequential RNA information (translation). According to the simple chemical laws of the dogma, the unified picture of the fundamental mechanisms sustaining living systems was first understood at the molecular level in the mid-2oth century. When a cell divides in two, a set of chromosomal genomic DNAs is copied and assigned into each new cell. Inside the cell, nucleotide sequences of genes encoded in the genomic DNAs are transcribed to messenger RNAs (mRNAs), and the messages are translated to the functional protein products. Translated enzymatic or signaling proteins operate mainly to control the metabolic reactions that maintain the life cycle. Recently, the novel omics technologies have contributed to uncover more complex and advanced phenomena surrounding the simple dogma. DNA sequencers have revealed complete DNA sequences of chromosomal sets in several hundreds of species, including human (Lander et al. 2001) and mouse (Waterston et al. 2002). With the recent dramatic progress in DNA sequencing technologies (Benetta 2006; Church 2006), the number of currently ongoing genome-sequencing projects has reached a few thousand (Liolios et al. 2008). DNA microarrays (Schena et al. 1995) and cDNA analyses (Okazaki et al. 2002) have allowed us to identify expression levels and entire existences of RNAs in a cell.
(25) Introduction. 5. (transcriptomes). Notably, one mouse cDNA analysis has demonstrated that there are large amounts of non-protein-coding RNA (ncRNA) in living cells (Numata et al. 2003). With various new mass spectrometry (MS)-based technologies for the exhaustive identification of proteins (proteome, Cravats et al. 2007) and metabolites (metabolome, Mont on and Saga 2007), we are approaching the comprehensive disclosure of the cellular condition. A recent study based on the "multi-omics" strategy has demonstrated the multiple high-throughput measurements used in metabolomics, proteomics, and transcriptomics to analyze the responses of Escherichia coll (E. coll) cells to several genetic and environmental perturbations (Ishii et al. 2007). In accordance with this progression in MS-based technologies, large-scale studies in such areas as phosphorylation. (kinomes; Johnson. and Hunter. 2005),. non-water-soluble metabolites (lipidomes; Hah 2007), and glycans (glycomes; Zara 2008) are in full swing. The use of metabolome data through the application of metabolic engineering methodologies, including flux balance analysis (Lee et al. 2006), has allowed us to quantify the fluxes of large-scale metabolic pathways in cells (fluxomes; Fischer and Saner 2005).. In addition, large scale investigations of the cellular regulatory networks of. protein-protein (Jan in et al. 2008) and protein-DNA (Walhout 2006) interactions have been facilitated (interactomes)..
(26) 6. Large-Scale. Data. Mini. hg ofBiomolecularSequences. DNA. I. Replication. Translation. Protein. Metabolite. FIGURE 1.1 Omics Data Surrounding the Central Dogma of Molecular Biology. DNA can be copied to DNA (DNA replication), DNA information can be copied into RNA (transcription), and proteins can be synthesized in accordance with information in the sequences of transcribed RNA (translation). Metabolic reactions are operated by translated enzymatic proteins. Currently, this simple dogma is undergirded by large-scaledata from studies of the prior components of DNAs, RNAs, proteins, and metabolites in cells, referred to as genomics, transcriptomics, proteomics, and metabolomics, respectively,and many other kinds of omics data..
(27) Introduction. 7. 1.3 Philosophy. behind. this Dissertation. Vast amounts of large-scale data are now stocked and still waiting to be used effectively as descriptions of life. In this dissertation, by conducting bioinformatics data-mining and experimental analyses, I derive three simple consequences of the essential characters of molecular function and evolution in the process of gene expression, within this wealth of large-scale information. Throughout my young scientific life I have kept my faith in the ability of life science to describe many of the aspects of life and to awake our ideological excitement, such as when a child first sets eyes on, and delights in, elephants, lions, and giraffes at the zoo. This is different from the concept of a whole, systematic reconstruction intended to enable us to understand living systems in one shot through the analysis of massive parts of biological events.. 1.4. Report. Organization. Recently, genomics and transcriptomics approaches have surprisingly revealed that there are large amounts of RNA transcripts encoded in different regions of the genome sequence. This means that the genome is crowded by a number of gene-encoded regions. Overcrowding of genes can have side effects: transcription signals are likely to overlap and cause gene expression errors. First, in Chapter 2 of this dissertation, I discuss this gene layout problem and demonstrate the appropriate positions of compactly encoded E. coll genes and their transcription termination motifs. The contents of this chapter have been discussed with Kazuharu Arakawa and Masaru Tomita..
(28) Large-ScaleData Mining ofBiomolecular Sequences. 8. Under the complex constraint of DNA in the genomic sequence, RNAs are transcribed from the crowded genes. There are two main fates of the transcribed RNA. One is translation into proteins, and the other is operation as ncRNA, which does not encode protein products but is thought to have structural, regulatory, or catalytic properties. In Chapter 3, I provide a new bioinformatics screening approach for discovering novel ncRNA genes encoded in the E. coll genome. Then, in accordance with the list of novel ncRNA candidates derived by this approach and their experimental validation, I discuss the biological roles of bacterial ncRNAs. This part of the study was performed with Koji Numata, Rintaro Saito, Akio Kanai, and Masaru Tomita. Although ncRNAs function directly as nucleic acid molecules in cells, many proteins translated. from. protein-coding. RNAs. regulate. cellular. pathways. with. many. post-translational modifications, including phosphorylation, methylation, glycosylation, and acetylation. Recent phosphoproteome analyses using MS-based technologies have provided new insights into the extensive presence of protein phosphorylation in various species. Moreover, these analyses have raised the interesting question of how this protein modification was gained evolutionarily on such a large scale. In Chapter 4, I discuss this issue in the context of a combination of the fields of computational biology and statistical physics. This part of study was joint research with Rintaro Saito, Junichi Sugahara, Masaru Tomita, and Yasushi Ishihama. Finally, in Chapter 5, I discuss the philosophy of science aspects of the procedures conducted as part of the three studies described in the preceding chapters..
(29) Chapter. 2. Optimized Physical. Layout Constraint. of Genes. under. of DNA. Thereis grandeurin this viewof life,with its several powers,havingbeenoriginallybreathedinto a fewforms or into one;and that, whilstthisplanet hasgone cyclingon accordingto thefixed law of gravityfrom sosimplea beginningendless formsmostbeautifuland mostwonderfulhavebeen,and arebeing,evolved —CharlesDarwin. 2.1. Introduction. In bacterial species, rho-independent terminators are widely accepted as canonical intrinsic termination signals in the DNA that function in minimal in vitro transcription systems (Nudler and Gottesman 2002). Although bacterial transcription termination is controlled by many factors, genomic analyses that have taken advantage of the availability of sequence data have suggested that. most of the transcription. terminations. of annotated.
(30) Large-ScaleData Mining ofBiomole cular. 10. Sequences. protein-encoding and non-coding RNA transcription units are regulated by intrinsic rho-independent. terminators (Nudler and Gottesman 2002). Intrinsic terminators are. characterized by a GC-rich palindromic structure followed by a tail of A-rich region on the template DNA strand (plait 1986; Yarnell and Roberts 1999). The palindromic region forming a stem-loop structure in the nascent RNA is reported to pause RNA polymerases (Farnham and plait 1981; Wang et al. 1997; Artsimovitch and Landick 1998) and weaken the interaction between elongated oligo RNA and template DNA (Arndt and Chamberlin 1990; Wilson and von Hipper 1995). Owing to the weak hybridization energy between IU and dA (Lynn et al. 1988), final release may also be facilitated by the following U-rich region (Martin and Tinoco 1980). In view of these subgenomic features, many algorithms have been developed to identify the intrinsic terminators (Brendel and Trifonov 1984; Brendel et al. 1986; d'Aubenton Carafa et al. 1990; Ermolaeva et al. 2000; Lesnik et al. 2001; Unniraman et al. 2002). RNAMotif software is used to search RNA motifs defined by the nucleotide sequences and structural constraints given by model file arguments named `descriptor' (Macke et al. 2001). Descriptor files of the intrinsic terminator have been reported by Lesnik et al. (Lesnik et al. 2001), based on a model consisting of stable hairpin structures followed by T-rich regions as proposed by d'Aubenton Carafa et al. (d'Aubenton Carafa et al. 1990). As demonstrated by Livny et al. (Livny et al. 2006), RNAMotif misses out a fraction of documented intrinsic terminator motifs detectable by other resources such as TransTerm (Jacobs et al. 2006). Nevertheless, RNAMotif has been widely utilized in many bioinformatics approaches; for example, to define transcription terminations and to predict novel transcription units (Livny et al. 2006; Chen et al. 2002; Pichon and Felden 2003; Livny et al. 2005; Yachie et al. 2oo6a). Following these findings and applications, a bl-directional rho-independent terminator in the intergenic region (IGR) between the tonB and P14 genes has been identified; this could function bl-directionally by sharing the two complementary hairpins.
(31) OptimizedLayoutof Genes. 11. on the double-stranded genomic DNA, terminating the transcription of both genes (Lesnik et al. 2001; pestle and Good 1985). Lesnik et al. also suggested that many bl-directional rho-independent terminators might exist in the Escherichia coll (E. coll) genome (Lesnik et al. 2001). In this chapter, we discuss how transcription units and intrinsic terminators are coordinately organized and distributed within the E. coll genome based on the prediction of possible intrinsic terminator motifs at the genomic level using RNAMotif (Yachie et al. 2oo6b). In order to analyze the positioning characteristics of the predicted motifs in light of the patterns of the s'-ends of genes overlapping on neighboring genes or adjoining IGRs, either uni-directionally or bl-directionally, we constructed bioinformatics workflows using G-language Genome Analysis Environment, a generic analysis workbench for bioinformatics (Arakawa et al. 2003; Arakawa et al. 2oo6a). We first present that the majority of rho-independent terminators are potentially bl-directional owing to the symmetric features of their hairpins, with low free energies in both the genetic complements. Further, by comparing the analysis of the s'-ends of overlapping and non-overlapping genes with those in the operon transcripts, we demonstrate computationally the circumvention and utilization of the intrinsic terminations associated with adjacent genes and with the bl-directional properties of these terminators. We suggest that the loci of intrinsic rho-independent terminators may have been optimized to be efficiently positioned in the downstream regions of genes, compactly encoded on the E. coll genomic DNA..
(32) Large-ScaleData Mining of Biomo lecular. 12. 2.2. Experimental. Sequences. Procedures. 2.2.1 Genome Annotation. and Sequence Data. The complete genome sequence of E. coll K-l2 strain MGl6ss containing 4,639,675. (RefSeq: Noooogls). bp was obtained from the National Center for Biotechnology. Information (NCBI) ftp server (ftp://ftp.ncbi.nlm.nth.gov).. The annotations and positions. of 4,441 documented genes, including transfer RNA (tRNA), ribosomal RNA (rRNA), and other non-protein-coding RNAs, and 997 identified transcription units of E. coll were down loaded as flat files from the EcoCyc database, Encyclopedia of Escherichia coll K-l2 Genes and Metabolism (http://www.ecocyc.org, accessed 23 July 2006) (Keseler et al. 2005).. 2.2.2 Preparation. of Data on s'-end Positioning. and Operon Categories. All the s'-ends of genes were grouped into four categories, and the genes included in the operon transcripts were divided into two categories. Among the s'-ends of the 4,441 genes, 2,335 were non-overlapping and adjoined IGRs with the adjacent downstream gene on the same DNA strand (defined as `tail-to-head neighboring'), 1,230 adjoined IGRs with the adjacent downstream gene on the complementary strand (`tail-to-tail neighboring'), 690 overlapped with their adjacent genes uni-directionally (`tail-to-head overlapping'), and 186 overlapped bl-directionally (`tail-to-tail overlapping'). Out of 977 transcription units stored in EcoCyc, 355 were prepared as operon transcripts, each encoding more than two genes. The endmost genes of the respective operon transcripts were defined as `operon-end' genes, and the remaining 884 genes were defined as `within-operon' genes. To determine the validity of our data set, which included annotated but experimentally.
(33) OptimizedLayoutof Genes. 13. unidentified genes, we repeated the same analysis on another data set excluding genes encoding `hypothetical proteins', as annotated in GenBank, and filtered by a Gene Prediction Accuracy Classification (GPAC) test (Arakawaet al. 2oo6b).. 2.2.3. Prediction of Rho-independent. Terminators. Using RNAMotif, the sequences and structural motifs of rho-independent. terminators. containing hairpins followed by T-rich regions were predicted at the genomic level. The original RNAMotif model files were constructed by machine learning of the nucleotide composition. around. experimentally confirmed rho-independent. terminators, which. included an A-rich region at the s'-side of the unidirectional motif in addition to the experimentally suggested hairpin structure with a s'-side T-rich region, for more efficient prediction of the terminators. However, this model with the s'-side A-region inherently results in preferential prediction of bl-directional terminators. Therefore, to determine the bl-directional properties of rho-independent terminators by using unbiased criteria, we omitted the 5' A-region from the model and adopted only the total AG° scores of hairpins with a 3' T-region for the prediction of each motif at its optimal cut-off score of <_—4,which is reported to significantly cover the majority of experimentally identified intrinsic terminators (Lesnik et al. 2001). In order to compare the bl-directional properties of predicted motifs with different scores, the predicted motifs were further prepared at three AG° thresholds of —4, —8, and —12. The positions of transcription terminations were defined accordingly as 7 ht upstream of the s'-ends of the predicted motifs. Within the predicted terminators, those having possible hairpin structures in their complementary DNA strands were further screened for bi-directionality by seeking a hairpin structural motif located directly opposite of the original hairpin position; that is, symmetric.
(34) Large-ScaleData Mining of Biomolecular Sequences. 14. bl-directional base-stacking coincided. 2.2.4. rho-independent pairs. terminators. of two complementary. were. defined. hairpin. if the. structures. positions. on either. of the. partial. of the two strands. with each other.. Characteristic. Analyses. The physical properties. of Predicted. Intrinsic. Terminators. to potentially form stable hairpins. with low free energies reside in. both DNA strands at a locus. However, pairs of significant hairpin structures of the intrinsic terminators. predicted. symmetric,. when considering. and/or. hybridization. by RNAMotif. of rho-independent. symmetric. bl-directional and termination. termination. positions. the conditions. for other sequence attributes. of IU and rG. Therefore,. properties. medians. in the same loci on opposite strands are not always. terminators,. terminators,. in order. we performed. to estimate the bl-directional not only the prediction. but also the analysis of the lengths. positions of the predicted. of two motifs encoded. in the motif. of. between loop. motifs and the distances between the. on the complementary. DNA. strands.. The. two-sided 95% confidence intervals of the lengths between loop medians and termination positions of the predicted. motifs were calculated. Then, for each predicted. terminator,. we. counted the number of antisense terminator motifs, whose termination positions were within twice the ranges between the two-sided 95% confidence intervals upstream of the termination position in the sense strand..
(35) OptimizedLayoutof Genes. 2.2.5 Estimation Terminators. of Occurrence. 15. Ratio of Predicted Rho-independent. with Respect to Each Position around s'-end of Genes. Distributions of the termination positions of the predicted rho-independent terminators were analyzed bl-directionally around the s'-ends of the genes within the each s'-end positioning categories. For every gene in each category, termination positions of motifs were counted using 2o-bp sliding windows with l-bp displacement, and the motif count at each distance (bp) was normalized and defined as `Ratio (%)' by dividing by the total number of genes in the category, and by the window size, i.e. 20. In order to discuss how terminator motifs were characteristically distributed in the each s'-end positioning category, the highest `Ratio (%)' of both DNA strands defined as peak ratios and their relative positions from the s'-end of gene were paralleled with those of the other categories..
(36) Large-ScaleData Mining of Biomolecular Sequences. 16. 2.3. Results. and Discussion. In this chapter, the optimization of gene positioning associated with the bl-directional properties of intrinsic rho-independent terminators in E. coll was discussed. We initially predicted the rho-independent terminators at genomic level by using RNAMotif software, and suggested many of the rho-independent. terminators possibly have bl-directional. properties that not only mis-terminates an overlapping transcription. units on the. terminators in the same DNA strand but also those in the complementary strand. By analyzing distributions of predicted rho-independent terminator motifs around the s'-ends of genes categorized into the four s'-end positioning types of `tail-to-head neighboring', `tail-to-tail neighboring', `tail-to-head overlapping' and `tail-to-tail overlapping', our results suggested that the positioning of intrinsic terminators has minimized mis-termination of overlapping genes on the same strand and the complementary strand. Furthermore, bl-directional intrinsic terminators are speculated to distribute in such a way as to maximize co-ordinated termination of adjoining genes on opposite strands. Though `within-operon' genes are not terminated in the proximity of downstream region of the s'-ends, we indicated that the minimization of mis-termination were independent from the biases of the `within -operon' genes. This is confirmed by observing the distribution pattern around the s'-ends utilizing the information of identified operon transcripts and by comparing the numbers of respective s'-end positioning type genes in the two operon categories of `within-operon' and `operon-end' with those of all genes..
(37) OptimizedLayoutof Genes. 2.3.1 Comparison. of s'-end Positioning. 17. Types within Each Operon Category. Genes in each of the s'-end positioning categories were counted and compared with respect to the corresponding operon category (Table 2.1). Among the total 884 `within-operon' genes, the numbers of `tail-to-head neighboring' and `tail-to-head overlapping' s'-ends were 611 (69.12%) and 263 (29.75%), respectively. As expected, these proportions were both higher than `operon-end' genes and all genes, because the operon encodes multiple closely packed genes transcribed together. Only one gene of the `tail-to-tail overlapping' s'-end. type was found in the. `within -operon' category, and its proportion of 0.11% was markedly lower than the 3.10% of these genes in the `operon-end' category and the 4.19% among all genes (Table 2.1). The percentage of genes with `tail-to-tail neighboring' s'-ends (1.02%) in the `within-operon' category was also markedly lower than in the other categories (37.46% for `operon-end' genes and 27.70% for all genes); 133 out of the 355 `operon-end' genes had `tail-to-tail neighboring' s'-ends—the highest proportion among those of `tail-to-tail neighboring' s'-ends. in all categories. The same tendencies were observed upon removal of the. hypothetical genes..
(38) Large-ScaleData Mining of Biomolecular Sequences. 18. TABLE 2.1 Numbers Within-operon',. of Genes with Each s'-end Positioning. `Operon-end',. Positioning. type of 3 '-end. tail-to-head. neighboring. tail-to-tail neighboring tail-to-head overlapping tail-to-tail Total. overlapping. Type within the Categories. of. and All Genes. `within -operon'. genes. `operon -end' genes. 611 (69.12 %) 9(1.02%) 263 (29.75 %) l (0.11 %). 203 (57.18 %) 133 (37.46 %) 8 (2.25 %) 11 (3.10 %). 2335 (52.58 %) 1230 (27.70 %) 690 (15.54 %) 186 (4.19 %). 884. 355. 4441. All genes.
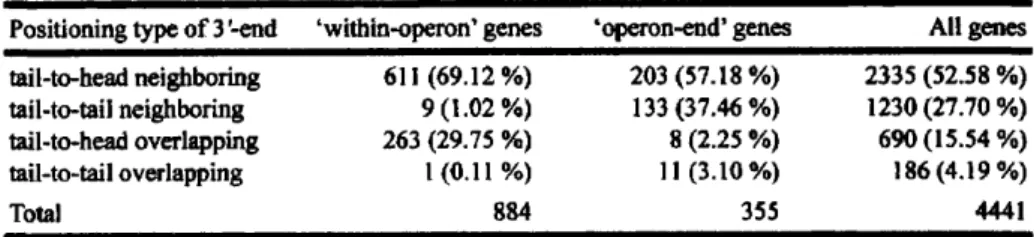
(39) OptimizedLayoutof Genes. 2.3.2 Bi-directional. Properties of Intrinsic Rho-independent. 19. Terminators. Using RNAMotif, 15,665, 5,445, and 1,585 rho-independent terminators were predicted at the respective AG° thresholds of —4, —8, and —12. We analyzed the properties of the predicted terminators by analyzing their lengths (Fig. 2.IA—C), the distances between the termination positions of two motifs encoded on the complementary DNA strands (Fig. 2.ID—F), and the numbers of rho-independent terminators that were bl-directional (Fig. 2.1G—I). The maximum and minimum lengths between the loop medians and termination positions of all predicted motifs shown in Fig. 2. IA—C were 43 and 10.5 ht, respectively, and the average size was 19.57 ht. The regions between the two-sided 95% confidence intervals ranged from 13 to 26 ht, from 13.5 to 26 ht, and from 15 to 26 ht, for AG° thresholds —4, —8, and —12, respectively. The possible distances of the predicted termination positions in the antisense DNA strand from those in the sense strand are displayed in Fig. 2.1 D—F. The total frequency of antisense terminators distributed in the regions between —52and —26ht away from the termination position of terminator motif in the sense strand at AG° threshold —4was 133.04%. The region between positions —52and —26ht was defined in accordance with the two-sided 95% confidence interval regions from positions 13 to 26 ht as described above, and by taking twice the length to estimate the equivalent length of the bl-directional motifs, in order to account for the antisense structures. According to the same procedure, the total frequencies of antisense terminators were calculated to be 189.35% and 219.74% at AG° thresholds —8 and —12, respectively. Within the sets of complementary terminators at AG° scores —4, —8, and —12 and below, 3,375 (21.54%),. 1,644 (30.19%), and 529 (33.38%), respectively, were bl-directional. rho-independent terminators, sharing double-stranded DNA regions to form symmetrical hairpin structures with AG° scores —4and below. The distances between the termination.
(40) 20. Large-ScaleData Mining of Biomolecular Sequences. positions of symmetrical complementary pairs were distributed around 40 bp. Within the putative terminators predicted by RNAMotif, those of lower AG° scores were suggested to have higher bl-directional properties. This result provided the rationale that the observations of predicted terminators having low AG° scores were reasonable to discuss their bi-directionalities in further analyses, conducted as follows. Although a comprehensive listing of 439 candidate bl-directional terminators has already been reported by Lesnik et al. using a model suited for the identification of bl-directional motifs as explained above (Lesnik et al. 2001), we showed here additionally using a uni-directional motif model, that the majority of intrinsic terminator motifs with sufficiently low AG° have antisense complements and thus have a high likelihood of forming bl-directional terminators. Therefore, most rho-independent terminators probably have highly bl-directional properties, as a result of the symmetry-based low free energies and hairpin formations on the double-stranded DNA..
(41) Op timizedLayoutof Genes. 21. '+4:. 10. 0. 0. 10. 5. 25. 20 30. 0. 0 10. 10 0. 50. 5. r 0. 0 o. 20 30. cc 50. 0 ---------------------lo-F .w'. 10 5 0. 0 50 Length (ht). 25. 20 30 .------------------------100 -50 0. 0 25 50. Distance (bp). FIGURE2.1 Characteristic Analysis of Predicted Rho-independent Terminators. Lengths between loop medians and termination positions of predicted rho-independent terminator motifs with AG° scores of <_—4,—8,and —12are displayed respectively in (A), (B), and (C). Count of motifs at each length (ht) was normalized as `Ratio (%)' by dividing by the total number of motifs predicted at the respective threshold. Distances of predicted transcription termination positions in the antisense DNA strand from those in the sense strand are shown in (D—F).(D), (E), and (F) represent distributions of predicted motifs in the antisense strand from motifs in the sense strands with AG) scores of <_—4,—8,and —12,respectively. In the stacked histogram, the count of antisense motifs at each distance (bp) was normalized as `Ratio (%)' by dividing by the total number of motifs predicted at the respective threshold . AG° scores of antisense motifs are indicated by light gray (<_—4and > —8),gray (<_—8and > —12),and black (<_ —12). Counts of bl-directional rho-independent terminators with sense strand motifs with AG' scores of <_—4(G), —8(H), and —12(I) were also normalized as `Ratio (%)' by dividing by the total number of motifs predicted by the respective threshold..
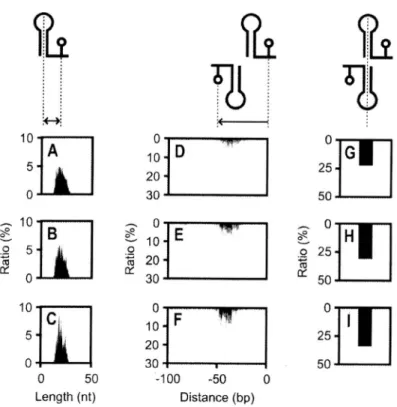
(42) Large-. 22. 2.3.3. Optimization. of E. coll Gene. ScaleData Mining of Biomolecula r Sequences. Positioning. Associated. with Intrinsic. Terminators. The termination. positions. analyzed bl-directionally. marked. by the predicted. rho-independent. were. around the s'-ends of the genes. The distances of the terminations. of the predicted terminators. and the bl-directional. terminators. in both DNA strands are shown in Fig. 2.2A—D, including lower AG° scores of <_—8 and s —12, and their bl-directional by focusing on the downstream positions were distributed. terminators. parts of the s'-ends. at around. from the s'-ends. of all genes. certain fractions of those having properties were also suggested. of the genes. The predicted termination. +33 bp with the peak ratio of 3.92%. in the sense. strand, and at about —4 bp with the peak ratio of 2.66% in the antisense strand, as calculated from the normalized terminations. count per gene per position (for details, see the section 2.2.5).. of bl-directional. terminators. strand, where the peak ratio was 1.53%;. were distributed. at around. +34 bp in the sense. in the antisense strand they were distributed. around 0 bp, where the peak ratio was 1.23%.. The. at.
(43) co. Op timizedLayoutof Genes. 23. 10. 4. 5. 2 0. 0. CSI. 0. 0. 0 5. 101-100. 2 4. -50. 0 Distance (bp). 50. 100. -50. 0. 50. Distance (bp). FIGURE2.2 Distributions of Rho-independent Terminators around s'-ends of All Genes. Distances of termination positions of rho-independent terminator motifs distributed in sense and antisense DNA strands from the s'-ends of genes are shown in (A) and (B), respectively. Frequency of the motifs with respect to the position around s'-end of genes were normalized as `R atio (%)' (for details, see the section 2.2.5). AG° scores are indicated by light gray (<_—4and > —8),gray (5 —8and > —12),and black (<_ —12)bars in the stacked histogram. From the histograms, bl-directional rho-independent terminators (not colored by motif scores) were extracted to (C) sense strand and (D) antisense strand..
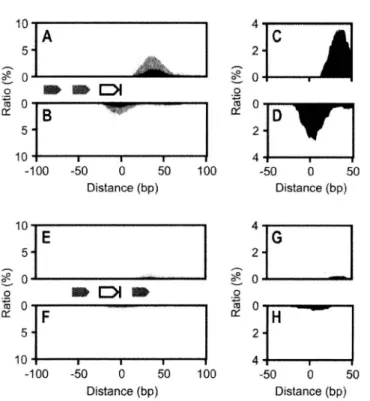
(44) Large-ScaleData Mining of Biomolecular Sequences. 24. Similarly to the result for all genes, the termination positions were distributed around the `tail-to-head neighboring' and `tail-to-tail neighboring' s'-ends. (Fig. 2.3A—D and. E—H). The peak ratios of 3.66% (1.09% bl-directional) in the sense strand and 1.36% (0.79% bl-directional) in the antisense strand, calculated using all predicted terminators, were distanced +34 bp (+37 bp bl-directional) and —4 bp (+2 bp bl-directional), respectively, from the s'-ends of the genes in the `tail-to-head neighboring' category. Likewise, for the `tail-to-tail neighboring' category, the peak ratios were 7.07% (3.63% bl-directional) in the sense strand and 6.86% (3.19% bl-directional) in the antisense strand, distanced +32 bp (+32 bp bl-directional) and —4bp (0 bp bl-directional) from the s'-ends of the genes. The peak ratios of the `tail-to-tail neighboring' category, including higher fractions of lower AG° scores of <_—8and < —12, were significantly higher than those of the `tail-to-head neighboring' and of all genes (Fig. 2.2), suggesting the marked adoption of bl-directional properties that can terminate a pair of `tail-to-tail neighboring' genes with one shared bl-directional terminator..
(45) co c. Op timized L ayoutof Genes. 25. 4. 10. 5. 2. 5. 00. 00. 10. 4. E. a. 5. 2. 5. 10. 4. 10. -100. -50 0 50 Distance (bp). -50. 100. 0. 0. 0 cc 0. cl 0. to 0 o!. 2. CI. a®. 0. 0 2 4. 0 50 Distance (bp). -100. -50 0 50 Distance (bp). -50. 100. 10. 4. 10. 4. 5. 2. 5. 2. 0. 0. a 0. 0. MEW. cc. 0. 5. 10------------. -100 -50. 0. 50. Distance (bp). 100. 0. 0. .4 0. 0. 0 5C Distance (bp). 0 cr. 2. 5. 4. 10. -50. 0 50 Distance (bp). 2 4. -100. -50 0 50 Distance (bp). 100. -50 0 5C Distance (bp). FIGURE2.3 Distributions of Rho-independent Terminators around s'-ends of `Tail-to-head Neighboring' (A-D), `Tail-to-tail Neighboring' (E-H), `Tail-to-head Overlapping' (I–L), and `Tail-to-tail Overlapping' (M–P) Genes. For details, see caption to Fig. 2.2..
(46) Large-ScaleData Mining ofBiomolecular Sequences. 26. In the categories of `tail-to-head overlapping' and `tail-to-tail overlapping', marked distributions of terminators were not observed, compared with those described above (Fig. 2.31—L and M—P). We suggest that the result in the `tail-to-head overlapping' category, showing a circumvention of the terminator structures, might be designed to prevent mis-termination, pausing the transcription in the middle of another overlapped gene in co-orientation. Genes in this category may be terminated by other intrinsic motifs that are not given in the model used here, or by other transcription termination factors (Nudler and Gottesman 2002).. However, a comparison of the `within-operon' and `operon-end'. categories (Fig. 2.4) showed that the `within-operon'. category also lacked marked. distributions, and many of the `tail-to-head overlapping' genes were suggested to be involved in the operon transcripts (see Table 2.1 for details). We thus speculate that some of the `tail-to-head overlapping' genes are `within-operon'. genes, and therefore are not. terminated at the proximal downstream regions of their s'-ends..
(47) OptimizedLayoutof Genes. 27. 10. 4. A 50 0 co. 2 0. i. ®. DI. 0. 0. 0. B 510 -100. 2 4. -50. 0. 50. Distance (bp). 100. -50. 0. 50. Distance (bp). io-------------------------------4--------------. EG 5-2-. 00111^CDlowo° co ° F'°H 5210 --------------------------------------------, ,, , 4 -------------------------------, -100 -50 0 50 100 -50 0 50 Distance(bp)Distance (bp) FIGURE 2.4 Distributions of Rho-independent Terminators around s'-ends `Operon-end' (A—D) and Within-operon' (E—H)Genes. Fordetails,seecaption to Fig. 2.2.. of.
(48) Large-ScaleData Mining of Biomolecular Sequences. 28. From the results of the `tail-to-tail overlapping' category, we further consider that the uni-directional intrinsic motifs terminating the `tail-to-tail overlapping' genes are avoided to decrease the chance of mis-termination of their adjacent genes in antisense strands by their possible bl-directional properties. Only a negligible number of genes in this category belonged to the `within-operon'. category (Table 2.1), and therefore some kind of. termination other than by the intrinsic signal is expected—for example, by rho-dependent termination (Nudler and Gottesman 2002). Negative selective pressure works against gene formation in the antisense strands of operon transcripts (Table 2.1), and this may be partly attributable to the circumvention of mis-termination of the antisense gene caused by the bl-directional terminator. On the other hand, in the analyses of the `operon-end' category, the high peak ratios of 8.07% (3.66% bl-directional) of the sense strand and 4.19% (2.75% bl-directional) of the antisense strand were distanced at +32 bp (+34 bp bl-directional) and –2 bp (+5 bp bl-directional) from the s'-ends of the genes (Fig. 2.4); we considered that this result was caused by the inclusion of many `tail-to-tail neighboring' genes in the `operon-end' category, as suggested in Table 2.1, or was due to the high sensitivity of the experimentally confirmed transcription terminations. The same procedures were repeated for every positioning pattern of the s'-ends after filtering by the GPAC test and for randomly sampled sets of 100 genes by a bootstrap test, but the results showed no marked change (data not shown). We therefore conclude that of our results were not biased by variations in the annotation accuracy of genes or by the numbers of genes in the respective categories. We conducted a bioinformatics analysis to investigate gene positioning in relation to the intrinsic termination motifs, and we discussed here the optimal positioning of bl-directional terminators in utilizing efficient terminations of head-on and non-overlapping gene pairs in a dual role and in circumventing the mis-termination of overlapping transcripts. A previous study has indicated that such structure-dependent. intrinsic terminators appear to be.
(49) OptimizedLayoutof Genes. 29. employed in only a few bacterial species, as suggested by the fact that the calculation of free energies around the s'-ends of their genes resulted in the lowest distributions in regions downstream of `to-tail neighboring' genes (Washio et al. 1998). We also suggest that our data support the concept of dynamic gene positioning by a combination of intrinsic terminators that has possibly been optimized in E. coll..
(50) Chapter. 3. Discovery. of New. Antisense. RNAs. Non-cod. ing and. In a cellin whichDNA is the geneticmaterialit is not believedthat DNA itselfcontrolsprotein synthesisdirectly. —FrancisCrick. 3.1. Introduction. Genome sequencing projects have identified numerous examples of non-coding RNA (ncRNA) genes (Eddy 2001). ncRNA molecules do not encode protein products, but are thought to have structural, regulatory or catalytic properties. Along with well-known RNA molecules, such as transfer RNAs (tRNAs) and ribosomal RNAs (rRNAs), many classes of ncRNAs have been identified by the experimental and bioinformatics approaches (Eddy 2001). Among bacteria, particularly Escherichia coll (E. coll), many studies of small RNAs (sRNAs) have focused on the intergenic regions (Wassarman et al. 1999; Argaman et al..
(51) Large-. 32. cular ScaleData Mining ofBiomole. Sequences. 2001; Carter et al. 2001; Rivas et al. 2001; Wassarman et al. 2001; Chen et al. 2002; Tjaden et al. 2002).. Recent articles have estimated that approximately 1000 sRNA. candidates of unknown function are encoded in the E. coll genome (Hershberg et al. 2003; Vogel et al. 2003). However, only 62 of these have been detected experimentally through analysis of RNA expression in E. coll. Vogel et al. performed global sRNA identification using the shotgun cloning approach known as experimental RNomics. They suggested that 5% of the final contigs mapped to the strand complementary to coding regions within the E. coll genome (Vogel et al. 2003). Although several small antisense RNAs (saRNAs) are known to be transcribed from loci which differ from their target messenger RNAs (mRNAs) in E. coll (trans-antisense) (Carpousis 2003), few specific examples transcribed in the opposite direction from the same genomic loci (cts-encoded saRNAs) have been documented (Kawano et al. 2002; Vogel et al. 2003). Moreover, all previous sRNA predictions based on the bioinformatics approach have focused only on the intergenic regions as defined by gene annotation. A bioinformatics based approach for the prediction of saRNAs has yet to be reported. In this chapter, we describe a new approach for the detection of small ncRNA which we have designated the Gapped Markov Model Index (GMMI) (Yachie et al. 2oo6a). This allows the detection of ncRNAs not only in intergenic regions, but also in the antisense strands of coding regions. The GMMI evaluates whether an RNA sequence is coding or non-coding on the basis of the Markov model. The successful identification of previously known ncRNA sequences from the total RNA sequences was used to validate the GMMI. Subsequently, the GMMI allowed the identification of novel ncRNA candidates within predicted transcription units, and some of these molecules were encoded as antisense RNAs. We detected the expression of some ncRNA candidates, including saRNAs using RT-PCR and Northern hybridization..
(52) DiscoveryofNewNon-codingRNAs. 3.2 Experimental. 33. Procedures. 3.2.1 Gapped Markov Model Index (GMMI) A novel approach designatedthe Gapped MarkovModel Index (GMMI) was developedto mathematicallydistinguish ncRNA sequencesfrom other mRNA sequences.The aim was to evaluate the specificityof a RNA sequence (`test sequence') by the certain set of RNAs (`training set') with the combinations of specificnucleotide sequence patterns located at separatepositionsof consensussequences,cod onbiasesand/or its possible structural motifs, based on the Markov model. The biochemicalfunctions of ncRNAs such as tRNA and rRNA moleculesare thought to depend on not only their sequencemotifs but also their higher order structures. As nucleotidesat separatepositions can interact with one another, RNA sequence,structure and spatial relationships, such as hydrogen bonding should be considered.Let R be the RNA sequenceto be evaluated(`test sequence'),which is presented as a string of n characters:R = il r2... rk...r,, (rk= A or C or G or U, 1 <_kn).. The segment. from r, to ti in the sequencecan be presented as: Rt; = r;r;+l...r (1 <_i s j s n). The GMMI score (G) with the constant numbers of the Markov-order(e) and the gap space parameter (g)of R is defined as the product of the conditionalprobability of observingeachnucleotide P(rkiRkf-e,kl r), given a sequencepattern composedof e ht locatedin f ht upstream (0 <f < g) divided by the frequencyof each nucleotideP(rk) in the `trainingset':. G=. P (rkIRk+e , ) P(rk). 77. (3.1).
(53) 34. Large-Scale. Data Mini. hg ofBiomolecular Sequences. The score G evaluates the likelihood of the given sequence being related to our Gapped Markov Model which is constructed using the `training set'. A score below 1 indicates that a given sequence has a specific pattern that is not observed in the training set, whereas a score above 1 indicates concordance.. 3.2.2 Sequence Data The complete E. coll genome sequence and a set of mRNAs, documented ncRNAs and sRNAs, were down loaded from GenBank via the National Center for Biotechnology Information (NCBI) ftp server. In addition, details of 62 previously identified sRNAs of E. coll K12 strain MGl6ss. were obtained from the literature (Hershberg et al. 2003; Vogel et. al. 2003). Open reading frames (ORFs) were categorized as mRNAs. The RNA list we constructed consisted of 4,311 mRNAs (ORFs) and 163 ncRNAs (86 tRNAs, 22 and 55 sRNAs). Recently, researchers have compiled a set of 62 sRNA genes in E. coll and we adopted 55 of these, excluding those from transcription units that were neither predicted nor identified experimentally (Hershberg et al. 2003; Vogel et al. 2003).. 3.2.3 Prediction of Putative Transcription Units At the genomelevelwithin E. coll K12 strain MGl6ss we initially predicted transcription units betweenthe sigmaio promoters and rho-independent terminators.The prediction of putative transcription units was performed using a recentlyreported method (Chen et al. 2002). The program pfiools2.2,obtained from the ftp server of the Swiss Bioinformatics Institute, was used to identify the putative sigmaio promoters; a profile describing the major classof E. collsigmaio promoters was included in the software.We used the reported.
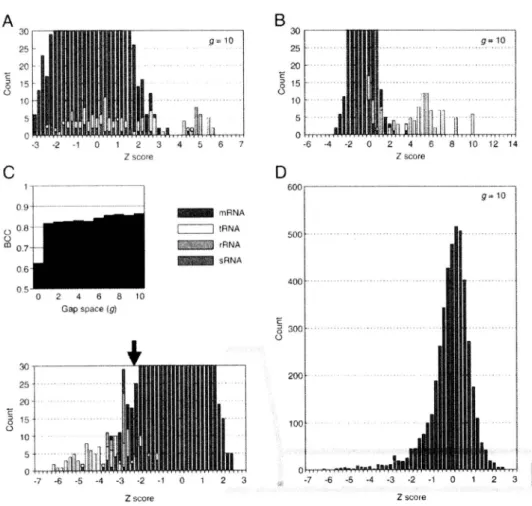
(54) Discoveryof NewNon-codingRNAs. 35. threshold of 50, which is capable of identifying approximately 70% of previously annotated promoters (Chen et al. 2002). In order to identify putative rho-independent terminators, we predicted their sequences and structural motifs using the RNAMotif software (Macke et al. 2001). The structural specifications of the motif model for the program and the optimal cut-off score were obtained from previous work (Lesnik et al. 2001).. 3.2.4 Identification. of Putative ncRNA Genes Using the GMMI. We used 4,311 ORF sequences as the training set for our model. The GMMI score was then calculated for every putative transcription unit. The size of a transcription unit was defined as the distance between the transcription start position, which is 10 ht downstream of the 3' end of the sigmaio promoter (Fig. 3.1, `start pos.'), and the transcription stop position, which is at the 3' end of the rho-independent terminator (`end pos.'). We limited the length of transcription units according to the sizes of the previously identified sRNAs at between 70 and 500 nucleotides. We extracted those having a Z score of the GMMI (e = 2 and g = 10) below the threshold —2.34 (see Results section). We then discarded candidates in which the 5' ends of the sigmaio promoters (`filtering start pos.'), or position —7with respect to the 3' ends of the rho-independent terminators (`filtering end pos.'), overlapped any ORF regions on the same DNA strand. This computational schema and the GMMI program is implemented by Perl version 5 and runs under the G-language GAE which provides a generic analysis workbench for bioinformatics (Arakawa et al. 2003). The source codes are available upon request..
(55) 36. Large-Scale. start. Data Mining. ofBiomolecular Sequences. pos.. end. pos.. 70 - soont. -3 5'. 3' +iont. -7nt. Y. a70 promoter filtering start pos.. p independent;terminator filtering end. pos.. FIGURE3.1 Transcription Unit Model. The transcription-unit model is defined as the region between the sigmaio promoter motif +10 (`start pos.') and the end of the rho-independent-terminator motif (`end pos.'), which ranges in size from 70 to 500 ht. The `f iltering start pos.', which is the original start position of the promoter motif, and the `filtering end pos.', which is 7 ht upstream from the original end of the terminator motif, are defined after filtering out those that overlapwith ORF regions on the same DNA strand..
(56) Discoveryof NewNon-codingRNAs. 37. 3.2.5 Bacterial Culture, RNA Isolation E. coll strain K12 MGl6ss. was used in this part of study. Cells were grown anaerobically at. 37 °C in L broth (10 g tryptone, 5 g yeast extract and 0.5 g NaCl/1). After an overnight incubation, 10 ml of the bacterial culture (stationary phase) was transferred to 100 ml of fresh medium and incubated to an approximate optical density of 600 nm. Cells were harvested in two different growth phases; late log (0.7 < O.D.600 < 1.0) and early stationary phase (1.0 < O.D.600 < 2.0). Total RNA for RT-PCR was isolated using the TRlzol Reagent (Invitrogen, Carlsbad, CA, USA) according to the manufacturer's instructions. For Northern blot hybridization, E. coll pellets were initially treated with the RNAprotect Bacteria Reagent (Qiagen GmbH, Hilden, Germany) for stabilizing RNA and then total RNA was isolated essentially using the RN easy Midi Kit (Qiagen), except that phenol-chloroform extraction of RNA was performed for purifying RNA instead of using the RN easyMidi column.. 3.2.6. RT-PCR. RT-PCR for the analysis candidate ncRNA expression was carried out using the ReverTra Dash Kit (TOYOBO Biochemicals, Japan). PCR was performed for 25 cycles at 98 °C (10 s), 55 °C (2 s) and 74 °C (30 s). The PCR products were separated using 3% NuSieve 3 : 1 agarose gel electrophoresis (Cambrex Bio Science Rockland, CA, USA) and stained using ethidium bromide (EtBr)..
(57) Large-ScaleData Mining ofBiomolecular Sequences. 38. 3.2.7 Northern. Blot Hybridization. Total RNA (20 g per lane) was separated by electrophoresis in 6% polyacrylamide gel containing 8 M Urea and transferred to positively charged nylon membrane Hybond+ (Amersham. Biosciences, Piscataway, NJ,. USA). by. electroblotting.. The. specific. oligonucleotide probes (45 mer) for each gene were labelled with BrightStar Psoralen-Biotin, nonisotopic labelling kit (Ambion, Austin, TX, USA). Membranes were hybridized with these probes using a NorthernMax Hybridization kit (Ambion). The washing temperature was 42 °C for genes NCOsl. and NCo6s, and 45 °C for genes NCo86 and NCog2,. respectively. Detection procedures followed the instructions of BrightStar BioDetect (Ambion), a nonisotopic detection kit. Images were visualized and analyzed with a Molecular Imager FX Pro (Bio-Rad Laboratories, Hercules, CA, USA).. 3.2.8 Oligonucleotides The oligonucleotides for RT-PCR analysis and Northern analysis were designated using Primers, which is implemented on the E. coll genome database coliBase (http://colibase. bham.ac.wk)..
Gambar


+7


Dokumen terkait
