▸ Baca selengkapnya: download 123dok free
(2)(3)Atmospheric
Monitoring
with
Arduino
ISBN: 978-1-449-33814-5 [LSI]
Atmospheric Monitoring with Arduino
by Patrick Di Justo and Emily GertzCopyright © 2013 Patrick Di Justo, Emily Gertz. All rights reserved. Printed in the United States of America.
Published by O’Reilly Media, Inc., 1005 Gravenstein Highway North, Sebastopol, CA 95472. O’Reilly books may be purchased for educational, business, or sales promotional use. Online editions are also available for most titles (http://my.safaribooksonline.com). For more infor-mation, contact our corporate/institutional sales department: 800-998-9938 or corpo [email protected].
Editors: Shawn Wallace and Brian Jepson
Production Editor: Kara Ebrahim
Proofreader: Kara Ebrahim
Cover Designer: Mark Paglietti
Interior Designer: David Futato
Illustrator: Rebecca Demarest November 2012: First Edition
Revision History for the First Edition:
2012-11-19 First release
See http://oreilly.com/catalog/errata.csp?isbn=9781449338145 for release details.
Nutshell Handbook, the Nutshell Handbook logo, and the O’Reilly logo are registered trade-marks of O’Reilly Media, Inc. Atmospheric Monitoring with Arduino and related trade dress are trademarks of O’Reilly Media, Inc.
Many of the designations used by manufacturers and sellers to distinguish their products are claimed as trademarks. Where those designations appear in this book, and O’Reilly Me-dia, Inc., was aware of a trademark claim, the designations have been printed in caps or initial caps.
Contents
Preface. . . vii
1/The World’s Shortest Electronics Primer. . . 1
What Is Arduino?. . . 1
Electronic Circuits and Components. . . 3
Programming Arduino. . . 5
First Sketch: Make an LED Blink. . . 6
Parts. . . 6
Install the IDE. . . 6
Breadboard the Circuit. . . 6
Write the Code. . . 8
Things to Try. . . 9
2/Gadget: Tropospheric Gas Detector. . . 11
How Gas Sensors Work. . . 13
Which Gases Can We Monitor?. . . 14
How This Gadget Works. . . 14
Transistorized!. . . 15
Build the Gadget. . . 16
Load the Sketch. . . 21
Displaying and Storing Your Data. . . 25
Liquid Crystal Displays. . . 25
Reading Data Off EEPROM. . . 26
Reading Data from an SD Card. . . 28
Things to Try. . . 28
Other Sensors. . . 28
Solar Powered. . . 28
GSM. . . 29
Do Not Deploy Your Gadget in Public Without Official Permission. . . 29
Get Official Permission. . . 30
Get Your Community Involved. . . 30
3/A Brief Introduction to LEDs. . . 33
What Is a Diode?. . . 33
What Is a Light Emitting Diode?. . . 34
How Are We Using LEDs in the LED Photometer?. . . 35
4/Gadget: LED Sensitivity Tester. . . 37
Mission: Inputtable. . . 37
Build the Gadget. . . 38
5/Gadget: LED Photometer. . . 51
Build the Gadget. . . 52
Load the Sketch. . . 54
Calibrate the Gadget: Air Mass, Atmospheric Optical Thickness, and Extraterrestrial Constant. . . 59
Calculating Atmospheric Optical Thickness. . . 62
Things to Try. . . 64
Detecting “Ozone Holes”: Measuring the Ozone Layer. . . 64
Add an Accelerometer. . . 65
6/Using the LED Photometer. . . 67
Atmospheric Aerosols. . . 69
Photosynthetically Active Radiation (PAR). . . 70
Water Vapor (WV). . . 70
Extracting Data from the LED Photometer. . . 71
Graphing Data in a Spreadsheet. . . 71
Sending Data to COSM. . . 72
7/Doing Science: How to Learn More from Your Atmospheric Data. . . 73
The Scientific Method. . . 73
Steps in the Scientific Method. . . 74
Observe Something in the World. . . 74
Ask an Answerable Question. . . 75
Formulate a Hypothesis. . . 75
Compare the Predicted to Actual Results, Considering the Results. . . 75
Preface
There’s a story (it’s either an old vaudeville joke
or a Zen koan) in which a fisherman asks a fish,
“What’s the water like down there?” and the
fish replies “What is water?” If the story is just
a joke, the point is to make us laugh; but if it’s
a koan, the point is that the most obvious and
ubiquitous parts of our immediate
environ-ment are, paradoxically, often the easiest to
overlook.
We as a species are probably a little bit smarter than fish: at least we know that we spend our lives “swimming” at the bottom of an ocean of air. About 4/5th of that ocean is the relatively harmless gas nitrogen. Around another 1/5 of it is the highly reactive and slightly toxic gas oxygen. The Earth’s at-mosphere also contains trace amounts of other harmless or slightly toxic gases like argon, carbon dioxide, and methane. And depending on where you live, it may contain even smaller, but much more toxic, amounts of pollutants like soot, carbon monoxide, and ozone.
Yet how many of us, like the fish in the koan, overlook the atmosphere? Who in your life can tell you the general composition of the air around them? How many people know what’s inside every breath they take? Do you? Reading this book and building these gadgets will take you on the first steps of a jour-ney toward understanding our ocean of air.
Conventions Used in This Book
The following typographical conventions are used in this book:Italic
Indicates new terms, URLs, email addresses, filenames, and file exten-sions.
Constant width
Used for program listings, as well as within paragraphs to refer to pro-gram elements such as variable or function names, databases, data types, environment variables, statements, and keywords.
Constant width bold
Shows commands or other text that should be typed literally by the user.
Constant width italic
Shows text that should be replaced with user-supplied values or by val-ues determined by context.
This icon signifies a tip, suggestion, or general note.
This icon indicates a warning or caution.
Using Code Examples
This book is here to help you get your job done. In general, if this book includes code examples, you may use the code in this book in your programs and documentation. You do not need to contact us for permission unless you’re reproducing a significant portion of the code. For example, writing a program that uses several chunks of code from this book does not require permission. Selling or distributing a CD-ROM of examples from O’Reilly books does re-quire permission. Answering a question by citing this book and quoting ex-ample code does not require permission. Incorporating a significant amount of example code from this book into your product’s documentation does require permission.
We appreciate, but do not require, attribution. An attribution usually includes the title, author, publisher, and ISBN. For example: “Atmospheric Monitoring with Arduino by Patrick Di Justo and Emily Gertz (O’Reilly). Copyright 2013 Patrick Di Justo and Emily Gertz, 978-1-4493-3814-5.”
If you feel your use of code examples falls outside fair use or the permission given above, feel free to contact us at [email protected].
Safari® Books Online
Safari Books Online is an on-demand digital library that
Technology professionals, software developers, web designers, and business and creative professionals use Safari Books Online as their primary resource for research, problem solving, learning, and certification training.
Safari Books Online offers a range of product mixes and pricing programs for organizations, government agencies, and individuals. Subscribers have ac-cess to thousands of books, training videos, and prepublication manuscripts in one fully searchable database from publishers like O’Reilly Media, Prentice Hall Professional, Addison-Wesley Professional, Microsoft Press, Sams, Que, Peachpit Press, Focal Press, Cisco Press, John Wiley & Sons, Syngress, Mor-gan Kaufmann, IBM Redbooks, Packt, Adobe Press, FT Press, Apress, Man-ning, New Riders, McGraw-Hill, Jones & Bartlett, Course Technology, and dozens more. For more information about Safari Books Online, please visit us online.
How to Contact Us
You can write to us at:Maker Media, Inc.
1005 Gravenstein Highway North Sebastopol, CA 95472
800-998-9938 (in the United States or Canada) 707-829-0515 (international or local)
707-829-0104 (fax)
Maker Media is a division of O’Reilly Media devoted entirely to the growing community of resourceful people who believe that if you can imagine it, you can make it. Consisting of Make magazine, Craft magazine, Maker Faire, as well as the Hacks, Make:Projects, and DIY Science book series, Maker Media encourages the Do-It-Yourself mentality by providing creative inspiration and instruction.
For more information about Maker Media, visit us online:
MAKE: www.makezine.com CRAFT: www.craftzine.com Maker Faire: www.makerfaire.com Hacks: www.hackszine.com
We have a web page for this book, where we list examples, errata, examples, and plans for future editions. You can find this page at http://oreil.ly/
atmospheric-arduino.
To comment or ask technical questions about this book, send email to book
For more information about our books, courses, conferences, and news, see our website at http://www.oreilly.com.
Find us on Facebook: http://facebook.com/oreilly
Follow us on Twitter: http://twitter.com/oreillymedia
1/The World’s Shortest
Electronics Primer
If you’re a DIY electronics or Arduino novice,
the information in this chapter will help you get
the most out of building and programming the
gadgets in this book.
If you’re already building your own electronics, consider this chapter a re-fresher to dip into as needed.
What Is Arduino?
Arduino is best described as a single-board computer that is deliberately designed to be used by people who are not experts in electronics, engineer-ing, or programming. It is inexpensive, cross-platform (the Arduino software runs on Windows, Mac OS X, and Linux), and easy to program. Both Arduino hardware and software are open source and extensible.
Arduino is also powerful: despite its compact size, it has about as much computing muscle as one of the original navigation computers from the Apollo program, at about 1/35,000 the price.
Programmers, designers, do-it-yourselfers, and artists around the world take advantage of Arduino’s power and simplicity to create all sorts of innovative devices, including interactive sensors, artwork, and toys.
We built each of the products in this book using the Arduino Uno (Figure 1-1 and Figure 1-2), which, at the time of writing, is the latest model. By the time you’re reading this, there may be something newer.
You don’t have to know Arduino Uno’s technical specifications to build and program the gadgets in this book, but if you’re interested, you can find them at the official Arduino website.
Figure 1-1. Front of the Arduino Uno (Rev. 3).
Electronic Circuits and Components
An electronic circuit is, as the term implies, electricity moving in a path very much like a circle. Each circuit has a beginning, a middle, and an end (which is usually very close to where it began). Somewhere in the middle, the circuit often runs through various electronic components that modify the electrical current in some way.Each device in this book is a circuit that combines Arduino with different electronic components. Some of these manage the power and path of the electricity, others sense certain conditions in the environment, and still oth-ers display output about those conditions.
Let’s take a look at some of the components we will be using in our circuits:
Light emitting diodes (LEDs)
An LED is a lamp made of various rare-earth metals, which give off a large amount of light when a tiny current is run through them. The com-position of the substances within the LED determine the particular wavelength of light emitted: you can buy green, blue, yellow, red, even ultraviolet and infrared LEDs.
Technically, the LEDs used in our gadgets are “miniature LEDs,” tiny lamps with two wire leads: one long (called the anode) and the other a bit shorter (called the cathode). These come in various useful forms (in-cluding single lamps from 2 mm to 8 mm in diameter, display bars, and alphanumeric readouts) and can serve as indicators, illuminators, or even data transmitters.
You’ll learn how to use these different types of LEDs while building the different environmental sensors in this book.
Resistors
Resistors are the workhorses of the electronics world. What do resistors do? They simply resist letting electricity flow through by being made of materials that naturally conduct electricity poorly. In this way, resistors serve as small dumb regulators to cut down the intensity of electric cur-rent.
Resistance is valuable because some electronic components are very delicate: they burn out easily if they’re powered with too much current. Putting a resistor in the circuit ensures that only the proper amount of electricity reaches the component. It’s hard to imagine any circuit work-ing without a resistor, and with LEDs, resistors are almost mandatory.
While building the projects in this book, you’ll learn various creative ways to regulate current with resistors.
Soldering
Soldering involves heating up conductive metal, called solder, and then using it to fuse other pieces of metal together. In small-scale electronics, we use an electrical tool called a soldering iron, which has a small tip, to heat up thin wires of solder and drip the solder onto the components we wish to join into the circuit.
Soldering creates a very stable circuit, and that stability can be a draw-back. Fusing together components can make it difficult to reuse or re-configure circuits. You also must be very careful to not short-circuit components while soldering. Knowing how to solder can be a very useful skill in DIY electronics. If you’re interested in learning how, this online resource is a good place to start.
The alternative to soldering is to use a solderless breadboard.
Solderless breadboards
Solderless breadboards are small plastic boards studded with pins that can hold wires (more about these next). These wires can then be con-nected to other electronic components, including Arduino.
Solderless breadboards make it much easier to design circuits, because they allow you to quickly try out various assemblies and components without having to solder the pieces together. While solderless bread-boards typically are intended for use only in the design phase, many hobbyists keep a breadboard in the final version of a device because they’re so fast and easy to use.
If you don’t feel like soldering circuit boards, solderless breadboards are the way to go. Each gadget in this book uses a solderless breadboard.
Wire
Wire is the most basic electronic component, creating the path along which electrons move through a circuit. The projects in this book use 1 mm “jumper wires,” which have solid metal tips perfectly sized to fit into Arduino and breadboard pins, and come sheathed in various colors of insulation.
We order most of our electronics components from these online retailers:
• Adafruit Industries • Eemartee
• Electronic Goldmine • SparkFun
Maker Shed, from MAKE and O’Reilly Media, sells books, kits, and tools, as well as many of the components needed to build the projects in this book including Arduino, breadboards, sensors, and basic electronic components. Maker Shed also supplies convenient bundles for many of the projects in this book (you can find more information about these bundles in the individual project chapters).
Don’t count out your friendly local RadioShack, though. While writing this book, more than once we ran out to RadioShack for a last-minute compo-nent.
For years RadioShack cut back on its electronic components inventory, ap-parently seeing a better future for the business by featuring cell phones and other consumer electronics. But the company has recently begun to em-brace the maker movement; at the time of writing, most of their stores around the country are even carrying Arduinos. We’re hopeful RadioShack is on the return path to being the hacker heaven it was years ago.
Programming Arduino
A computer program is a coded series of instructions that tells the computer what to do. The programs that run on Arduino are called sketches.
The sketches used in this book mostly tell Arduino to read data from one of the pins, such as the one connected to a sensor, and to write information to a different pin, such as the pin connected to an LED or display unit.
Sometimes the sketches also instruct Arduino to process that information in a certain way: to combine data streams, or compare the input with some reference, or even place the data into a readable format.
An Arduino program has two parts: setup() and loop().
setup()
The setup() part tells Arduino what it needs to know in order to do what we want it to do. For example, setup() tells Arduino which pins it needs to configure as input, which pins to configure as output, and which pins won’t be doing much of anything. If we’re going to use a special type of output to show our results, such as an LCD display, setup() is where we
tell Arduino how that output works. If we need to communicate with the outside world through a serial port or an ethernet connection, setup() is where we put all the instructions necessary to make that connection work.
loop()
loop() tells Arduino what to do with the input or output. Arduino runs the instructions in loop(), then goes back to the top of loop() and runs them again. And again. And again. loop() continues to loop as long as the Arduino has power.
First Sketch: Make an LED Blink
By long tradition (going back to 2006), the first Arduino sketch you will write is to make an LED blink.
Arduino pins can be used for input and output, as long as you tell the com-puter which is which. So in this sketch, we tell the Arduino to set pin 13 to be the LED OUTPUT pin, and then we alternately send electricity to pin 13 (set-ting the pin HIGH) and cut off the electricity to pin 13 (set(set-ting the pin LOW). With each alternation, the LED turns on and off.
We’ll write all the sketches in this book using the Arduino integrated devel-opment environment (IDE), which, simply put, is special software for writing and uploading code to Arduino.
Parts
1. Arduino Uno 2. Breadboard 3. LED
Install the IDE
Download the Arduino IDE, and follow the provided instructions to install it on your computer.
Once you’ve installed the software, open the IDE. You should see a screen that looks something like Figure 1-3.
Breadboard the Circuit
Figure 1-3. The Arduino IDE on a Mac.
Figure 1-4. LED long lead inserted into pin 13 on the Arduino (image made with Fritzing).
Write the Code
You can find this code in the Arduino IDE under File → Examples or on the EMWA GitHub Repository → chapter-1 → blink.
/* Blink
Turns on an LED for one second, then off for one second, repeatedly. This example code is based on example code that is in the public domain.
*/
void setup() {
// initialize the digital pin as an output.
// Pin 13 has an LED connected on most Arduino boards: pinMode(13, OUTPUT);
}
void loop() {
digitalWrite(13, HIGH); // set the LED on delay(1000); // wait for a second digitalWrite(13, LOW); // set the LED off delay(1000); // wait for a second }
Normally, you’d need to put a resistor in between the power source and the LED, so as not to burn out the LED. Arduino Unos (and later models) have a resistor built into pin 13, so that’s taken care of.
In this sketch, the code in loop() simply tells Arduino to set pin 13 HIGH— taking it up to 5 volts—for 1,000 milliseconds (one second), followed by set-ting it LOW—taking it down to 0 volts—for another 1,000 milliseconds.
Do you notice the /* … */ sections and the // lines in the example above? Those are ways to put comments into your code to explain to others (and to yourself) what the code does:
• // tells the computer that everything afterward on that line is a com-ment.
Why Comment Code?
Commenting code simply means adding explanations in plain English to your sketch that describe how the code works. Adding comments to code is a very good idea. Here’s why:
Suppose, after hours trying to get your Arduino to do something, the solution suddenly comes to you. Eureka! You hook up your Arduino, bang out your code, load it up, and voilà: it works.
Fast forward: months later, working on another project, you want your Ardu-ino to do something similar to your earlier project. “No sweat, I’ll just reuse my earlier code,” you think. But you open up the sketch and … none of it makes sense!
You wrote that earlier code in a highly creative state of mind, when your brain chemicals were flowing like a river and your ideas were flashing like summer lightning. In all the excitement, you didn’t comment your code. So now, months later, when you’re in a completely different state of mind, you can’t remember what the code does, and you have to start all over. Is that any way to live?
If you had commented your code from the beginning, you’d know exactly what each variable was used for, what each function did, and what each pin controlled. Your life would be so much more enjoyable.
In short, always take a few minutes to comment your code.
Things to Try
Modify this sketch to make the LED do something different:
1. Blink twice as quickly. 2. Blink twice as slowly.
3. Light up for half a second with a 2-second pause between blinks.
Congratulations, you’re an Arduino programmer! Now let’s have some real fun.
2/Gadget:
Tropospheric Gas
Detector
We can easily go several hours without drinking
water. We can comfortably go the better part
of a day without eating food. But try and go
more than a few minutes without breathing.
(No, don’t really try.) Understanding the
com-position of the lower atmosphere—the
tropo-sphere—is among the most important
envi-ronmental measurements we can take.
Everything floating around the troposphere—nitrogen, oxygen, carbon diox-ide, water vapor, and all sorts of pollution—winds up in our lungs, on our plants, in our food, and in our water (see Figure 2-1). It dusts our windows, our automobiles, and our buildings. For this reason, the authors (as well as organizations like the American Lung Association) believe that it’s vitally im-portant to know what’s inside every breath we take.
In the old days, when people wanted to know what was in the atmosphere, they used chemically-treated filter paper, and hung it in a breeze. The chem-icals reacted with whatever was in the air and would respond by changing color. Or they bubbled the atmosphere through water and measured the dif-ferent compounds that resulted as gas dissolved in water. This kind of work could only be performed in a dedicated chemistry lab.
Figure 2-1. This illustration shows how different chemicals and other sub-stances move into and through the troposphere. Credit: U.S. Climate Change Science Program, 2003.
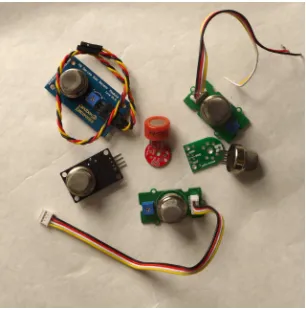
Figure 2-2. There are lots of inexpensive sensors on the market that can be used for DIY monitoring.
How Gas Sensors Work
Oxygen in the atmosphere removes electrons from the tin dioxide film, which decreases its conductivity (and increases its resistance). When other types of gases, particularly those that are chemically reducing, touch the tin dioxide film, electrons are injected into the material. This increases the conductivity (and lowers the resistance) of the tin dioxide layer. You can use your Arduino to measure that change in resistance.
It’s important to keep in mind that tin dioxide sensors tend to be broadly selective. While certain sensors may be marketed as being “alcohol” sensors or “carbon monoxide” sensors, they actually respond to more than just al-cohol or carbon monoxide, respectively; they respond to a wide family of
similar gases. Manufacturers can make the tin dioxide-based gas sensors more selective by adding various catalysts into the sensor head, or by using external filters. The datasheet provided with each sensor explains more completely how to adjust the sensitivity of each sensor for various gases.
Which Gases Can We Monitor?
There are electronic sensors for a wide range of gases. As we write this book in the summer of 2012, there are easy-to-use inexpensive sensors on the market to detect carbon monoxide, carbon dioxide, liquid petroleum gas, butane, propane, methane (natural gas), hydrogen, ethyl alcohol, benzene, volatile organic compounds, ammonia, ozone, hydrogen sulfide, and more. It’s not unreasonable to expect that it won’t be long before cheap sensors hit the market that can detect nitrogen oxides and other contaminants. All of these gases count as pollutants; in varying concentrations, all of them can be harmful.
How This Gadget Works
We’re going to use the MQ-2 and MQ-6 sensors from Hanwei, Inc. in this gadget. Both detect combustible gases: the MQ-6 detects butane and liq-uefied petroleum gas (LPG), also called propane (both hydrocarbons), while the MQ-2 is sensitive to LPG, methane (the primary component of natural gas, and a potent greenhouse gas), and smoke. We feel that both sensors together are a great way to start measuring ground-level air pollution.
What Is Smoke?
Smoke, for our purposes, is defined as a byproduct of incompletely burned carbon-based fuel. It includes solid and liquid particulate matter (otherwise known as soot), as well as some gaseous remnants of the original fuel mixed with air. Hanwei’s datasheet for the MQ-2 does not specify what “smoke” means for this sensor. But since we know that the MQ-2 detects certain hy-drocarbon gases, we’re assuming that the smoke it detects is also hydrocarbon-based: a component of automobile or truck exhaust, or the burning of natural gas.
A heating element in the electronic circuit heats the metal, making it more reactive with atmospheric gases. As the various gases react with the metal, the resistance changes in proportion to the amount of that gas present in the air exposed to the sensor. This change in resistance is measured by the Ar-duino analog port. That’s basically it.
V = .2 A). A standard Arduino pin can only reliably source 20 mA (in other words, only about 10% of the power the heater needs). We have correspond-ence from the manufacturers indicating that the heater can be powered by connecting it to the +5 V Arduino pin, but frankly, we’re skeptical. We’ve got to come up with a way to use Arduino to control the amount of power that goes to the heating units, so that the heating unit is not on constantly, without actually having Arduino provide that power.
Both these problems—providing power to the heater and controlling that power—have a single solution, probably the greatest invention of the 20th century: the transistor.
Transistorized!
Transistors are used to amplify electronic signals cheaply and efficiently, with very little noise, while giving off very little heat (Figure 2-3). Transistors also act as tiny, efficient digital switches. Since all computer activity breaks down into a series of binary “on and off” states represented by 1s and 0s, transis-tors by the millions, embedded into a silicon chip, control those on and off signals.
We really can’t overstate the importance of the transistor. We don’t have room in this book to discuss the details of how transistors work; suffice it to say that the lightweight, cheap electronic gadgets in our lives—handheld cell phones, computers, digital cameras, flat screen TVs, microwave ovens, cable television, touchtone phones, simple portable AM/FM radios, essentially anything more complicated than a flashlight—would be impossible without the transistor.
Figure 2-3. Various transistors. Source: Ulf Seifert.
The first thing you notice when you look at a transistor is that unlike almost every other electronic device we’ve seen so far, a transistor has three termi-nals. We can control the voltage between two of the terminals by applying a specific electric current or voltage to the third terminal. The three terminals are the base, the collector, and the emitter. The base is the controller; voltage applied here determines whether or not electricity flows from the collector to the emitter. The collector is the “source” of the electrical current, and the emitter is the output.
If we were to send varying levels of current from the base, we can regulate the amount of current flowing from the collector to the emitter. This is how a transistor acts as an amplifier: a very low signal coming into the base is repeated at a much larger voltage provided by the collector.
When we use a transistor as a switch, the circuitry is even simpler. A transistor switch is either fully on or fully off. A small data signal to the base determines whether the transistor is switched on or off. When it is switched on, current flows between the ground and the collector. This simple setup lets us use Arduino to turn on components that have a separate power supply.
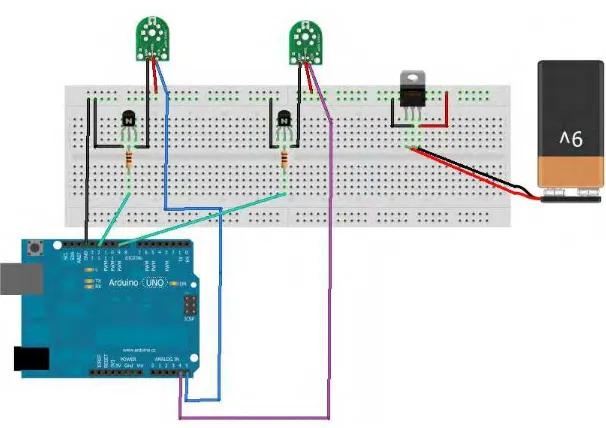
Build the Gadget
Amount Part Type Properties/(Assembly Code)
2 1 k Ω resistor Package THT; tolerance 5%; bands 4; resistance 1 k Ω; pin spacing 400 mil (R1 & R2)
1 Voltage regulator, 5 V Package TO220 [THT]; voltage 5 V (U1) 2 NPN-transistor Package TO92 [THT]; type NPN (Q1 & Q2) 1 Arduino UNO R3 (Arduino1)
1 LCD screen Character type, 16 pins (LCD1) 1 Battery block 9 V (VCC1)
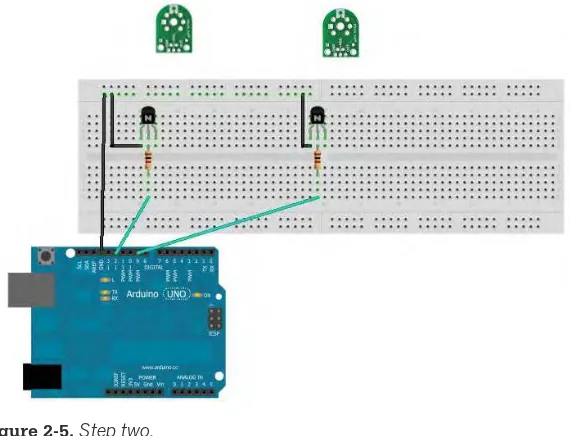
1. Connect a wire from the GND pin of Arduino to the GND rail of the bread-board. Connect the GND rail of the breadboard to the EMITTER pin of the transistor (Figure 2-4).
Figure 2-4. Step one. Source: these images were created with Fritzing.
Figure 2-5. Step two.
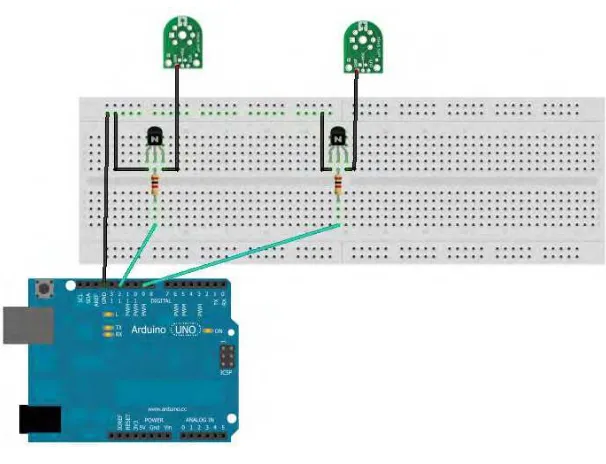
3. Connect the COLLECTOR pin of the transistor to the GND pin of the sensor (Figure 2-6).
Figure 2-6. Step three.
4. Connect the +5 (VCC) sensor pins to the breadboard’s power rail (Figure 2-7). Don’t worry; we’re going to add a power supply later. 5. Connect the data lines from the sensors to Arduino analog ports 4 and
Figure 2-7. Step four.
Figure 2-8. Step five.
6. Connect the 7805 +5 VDC voltage regulator. This regulates the voltage coming from your independent power source for the sensor heaters. Like the transistor, the voltage regulator also has three terminals: a cen-ter pin goes to GND, the pin on the left is input, and the pin on the right is output (Figure 2-9).
Figure 2-9. Step six.
Figure 2-10. Step seven.
This device takes an input current (up to 35 volts), and changes it to a stable, fixed +5 VDC. In our example, we’re using a standard 9 volt battery at the current source, but you can use just about anything: a 6 volt lantern battery, two 3.7 volt lithium polymer batteries connected in series, even a bunch of AA batteries. The total capacity of your power source should be your main determining factor: smaller batteries generally provide fewer amp-hours, meaning that the lifespan of your gadget can be cut short if you run out of power.
Don’t connect the battery until you actually need it, or add an ON-OFF switch to power it up when you’re ready to start taking readings.
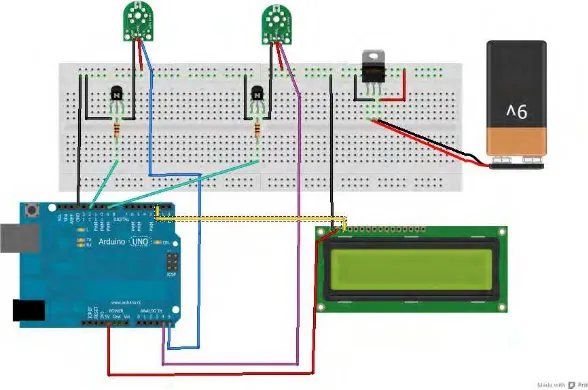
Optionally, connect the LCD. The data line is Arduino pin 2, ground goes to GND, and the power supply is Arduino’s 3.3 V pin.
Load the Sketch
You can find this sketch in the AMWA GitHub repository.
#include <SoftwareSerial.h> #include <SD.h>
#include <EEPROM.h> #include<stdlib.h>
// Liquid Crystal Display
// Define the LCD pins: We'll be using a serial-based LCD display // which only required +3.3Volts, GND, and a single data line. // databuff and displaybuff hold the data to be displayed #define LCDIn 2
#define LCDOut 5
SoftwareSerial mySerialPort(LCDIn, LCDOut);
// Data Buffers for the LCD char databuff1[16]; char databuff2[16]; char dispbuff[16]; // GAS SENSORS
// Analog input pin that reads the first gas sensor const int gasPin1 = A5;
// Analog input pin that reads the gas sensor const int gasPin2 = A4;
// The digital pin that controls the heater of gas sensor 1 const int heaterPin1 = 7;
// The digital pin that controls the heater of gas sensor 2 const int heaterPin2 = 9;
// LED connected to digital pin 13 const int ledPin = 13;
// value read from the sensor A5 int gasVal1 = 0;
// value read from the sensor A4 int gasVal2 = 0;
long warmup = 180000; // enter time for heaters to warmup, in milliseconds.
// 180,000 milliseconds = 3 minutes
long downtime = 360000; // enter delay between readings, in milliseconds.
// 360,000 milli seconds = 6 minutes
//EEPROM records require two bytes to store a 1024 bit value. //Each gas sensor returns a value from 0-1024, taking 2 bytes. //To store gas sensor data would require a record index,
//plus two bytes for the first gas sensor, two bytes for the second gas sensor
//For a total of five bytes per record.
// current EEPROM address int addr =0;
//EEPROM record length int reclen = 5;
//switch to tell if an SD card is present int SDPresent = 1;
void setup() {
// initialize serial communications at 9600 bps: Serial.begin(9600);
pinMode(heaterPin1, OUTPUT); // sets the digital pins as output pinMode(heaterPin2, OUTPUT);
pinMode(LCDOut, OUTPUT);
//reset the LCD
mySerialPort.begin(9600); mySerialPort.write(0xFE); mySerialPort.write(0x01); sprintf(databuff1,"Wakeup Test"); sprintf(dispbuff,"%-16s",databuff1); mySerialPort.print(dispbuff);
// Set up SD card, let us know if SD card is absent pinMode(10, OUTPUT);
if (!SD.begin(4)) {
SDPresent =0;
sprintf(databuff2,"NO SD CARD!!!"); sprintf(dispbuff,"%-16s",databuff2); mySerialPort.print(dispbuff); Serial.println("NO SD CARD!!!"); delay(6000); } delay(3333); } void loop() {
long scratch=0; // scratch variable
// set the timer
unsigned long counter = millis(); //turn first heater on
digitalWrite(heaterPin1, HIGH); // wait 3 minutes for heater to heat up while(millis() < (counter + warmup)) {
sprintf(databuff1,"Unit1 Activated"); sprintf(dispbuff,"%-16s",databuff1); mySerialPort.print(dispbuff);
scratch = (int)((counter+warmup - millis())/1000); sprintf(databuff2,"Countdown: %3d", scratch); sprintf(dispbuff,"%-16s",databuff2);
mySerialPort.print(dispbuff); Serial.println(scratch); }
// read the analog in value: gasVal1 = analogRead(gasPin1); sprintf(databuff1,"read unit 1"); sprintf(dispbuff,"%-16s",databuff1); mySerialPort.print(dispbuff); // shut off the first heater digitalWrite(heaterPin1, LOW);
//turn second heater on digitalWrite(heaterPin2, HIGH); sprintf(databuff2,"turning on unit2"); sprintf(dispbuff,"%-16s",databuff2); mySerialPort.print(dispbuff);
// wait 3 minutes for heater to heat up while(millis() < (counter + warmup + warmup)) {
sprintf(databuff1,"Unit2 Activated"); sprintf(dispbuff,"%-16s",databuff1); mySerialPort.print(dispbuff);
scratch = (int)((counter+warmup+warmup - millis())/1000); sprintf(databuff2,"Countdown: %3d", scratch);
sprintf(dispbuff,"%-16s",databuff2); mySerialPort.print(dispbuff); Serial.println(scratch); }
// read the analog in value: gasVal2 = analogRead(gasPin2); sprintf(databuff2,"reading unit2"); sprintf(dispbuff,"%-16s",databuff2); mySerialPort.print(dispbuff); // shut off the second heater digitalWrite(heaterPin2, LOW);
//Display on LCD
//write to SD card if(SDPresent = 1) {
writeDataToSD(databuff1, databuff2); }
//Wait downtime and start again
//to make more frequent measurements, change value of downtime while(millis() < (counter +downtime))
{ } }
void writeDataToSD(String dataString1, String dataString2) {
// open the file. note that only one file can be open at a time, // so you have to close this one before opening another. File dataFile = SD.open("datalog.txt", FILE_WRITE); // if the file is available, write to it:
if (dataFile) {
Serial.println("Hooray, we have a file!"); dataFile.print(millis()); dataFile.print(","); dataFile.print(dataString1); dataFile.print(","); dataFile.println(dataString2); dataFile.close();
// print to the serial port too: Serial.print(millis());
Serial.print(","); Serial.print(dataString1); Serial.print(",");
Serial.println(dataString2);
//Print to LCD
mySerialPort.print("Datafile written"); }
}
Displaying and Storing Your Data
You can connect Arduino to components that display data, as well as those that store data for later use.
Liquid Crystal Displays
Liquid crystal displays (LCDs) are cheap and easy ways to display data, sta-tus, warnings, and other messages from Arduino. They come in many different colors: you can buy LCDs with amber characters on a black
ground, black characters on a green background, yellow characters on a blue background, and other color combinations. Some LCDs have two rows of 16 characters, others four rows of 20 characters, and other display combina-tions are available as well. But for our uses, the biggest differences in LCDs involve the way they handle data.
The most basic (and least expensive) LCDs make you do all the data handling. They can take up as many as 10 digital data pins (most Arduinos only have 13), and might even require you to design your own characters. Some makers love doing stuff like that, but others just want to plug in a device and have it work.
For our uses, we’ve decided to go with a serial-controlled LCD, one in which a small microprocessor attached to the LCD takes care of all the data and character management. It’s more expensive, but also much easier to use. All we need to do is ground the device, give it some power, and feed it data.
Step seven of the build explains how to connect the LCD to the tropospheric gas detector.
Reading Data Off EEPROM
You might have noticed in the code that Arduino writes the data it recieves to something called EEPROM. This stands for “Electrically Erasable Pro-grammable Read-Only Memory.” This is a type of computer memory that is nonvolatile; it remains in place after Arduino is powered down, or after a new program is loaded. EEPROM is perfect for storing data that has to last a long time (a long time by Arduino standards, that is), such as months or years. Our gadget uses 5 bytes of EEPROM to store a single observation record: 1 byte for the record number, and 2 bytes apiece for each sensor’s data.
We’ve included a small program to extract tropospheric gas data from the Arduino’s EEPROM. Simply connect your Arduino to your computer via the USB cable, upload the following sketch, and then view the serial monitor.
#include <EEPROM.h>
// start reading from the first byte (address 0) of the EEPROM int address = 1;
int record = 0;
unsigned int Sensor1 = 0; unsigned int Sensor2 = 0; int q;
int m; void setup() {
Serial.begin(9600);
for(int i =0; i<=95; i++) { readData(); } } void loop() {
// There's no need for this program to loop. We know what we want to do, // and we just did it in setup().
}
void readData() {
record = EEPROM.read(address++); Serial.print(record);
Serial.print(",");
q = EEPROM.read(address++); delay(20);
m = EEPROM.read(address++); delay(20);
Sensor1 = (q*256)+m; Serial.print(Sensor1); Serial.print(",");
q = EEPROM.read(address++); delay(20);
m = EEPROM.read(address++); delay(20);
Sensor2 = (q*256)+m; Serial.print(Sensor2); Serial.print(",");
q = EEPROM.read(address++); delay(20);
m = EEPROM.read(address++); delay(20);
}
The result is a CSV display of your data, ready to be copied and pasted into your favorite spreadsheet program.
The Limits of EEPROM
EEPROM is not limitless. The Arduino Duemilanove and Uno each have a sin-gle kilobyte of EEPROM available, which (at 5 bytes per observation record) will hold about 200 observations worth of data. At 5 observations per hour, that’s enough for more than a day and a half of solid observation. Arduino Megas have 4 kilobytes of EEPROM, about enough to hold a week’s worth of atmospheric data. The old Arduino NGs, Nanos, and Diecimilas have a paltry 512 bytes of EEPROM, about 20 hours’ worth.
What do you do when your EEPROM is full? The Arduino IDE has a sketch called EEPROM_Clear. Simply run that, and it will wipe your Arduino’s non-volatile memory and make it ready for the next season’s worth of data. Of course, you will have already backed up your data to a spreadsheet, a hard drive, an SD card, or Cosm before you wipe your EEPROM, right?
Reading Data from an SD Card
If you are storing your gas detector data on the SD card, you’ll find a file called
DATALOG.TXT. That file contains your measurements in CSV (comma sepa-rated value) format. To save space on Arduino, we did not massage the data in any way. You can open this file in your favorite spreadsheet program and work with it as desired.
Things to Try
Of course, there’s not just one way to build a gas detector. There are many different configurations you can try (such as more or different sensors) that will provide more detailed data, but what changes (if any) will you have to make to the circuit to be sure it works properly? Will you need to beef up the batteries, or try a totally new power source? Here are some other ideas to make your gas detector more versatile.
Other Sensors
Does hot humid air hold more pollution than cold dry air? If you add a tem-perature/humidity sensor to the gadget, can you detect any correlations be-tween temperature/humidity and toxic gas concentration?
As we noted earlier, Hanwei and other manufacturers offer many different gas sensors, often (but not always) built around the same basic circuitry, making it relatively easy to add more sensors to a gadget, or swap new sen-sors for old ones. It might be interesting to add an MQ-131 ozone sensor to the MQ-2 and MQ-6 sensors—is there a correlation between automobile pol-lution and ozone? between temperature/humidity and ozone?
Solar Powered
One drawback to the current gadget is the batteries last only a few days. Is it possible to have the gadget work forever by powering it with the sun?
sunlight at your location, and the number of gas sensors you have. If you want to give it a try, we’d recommend starting with something like the Adafruit USB/SOLAR LiPoly charger. This device will handle all the power manage-ment for you.
The key question is the size of the solar panel: if you calculate the amount of power your Arduino and sensors use, and compare it to the net power you can expect from the solar panel/charger (taking into account your location and time of year), you can get a good idea if solar will work for your gadget.
GSM
Wouldn’t it be great if, instead of having to fetch data from your gadget, you could make your gadget send you its data? You can, with a GSM module. This device, available from all the usual suppliers like Sparkfun and Adafruit, is essentially the guts of a cell phone without the keypad, display, speaker, mi-crophone, or ringtones. By connecting it in place of (or along with) the LCD display, you can have your gadget send you text messages (or even post on Twitter!) its latest findings. You’ll need to get a separate SIM card with a data plan, but these usually cost in the range of $5 to $10 per month.
Do Not Deploy Your Gadget in Public
Without Official Permission
Now we come to the strangest part of this book: the warning not to leave your gas detector unattended, anywhere, ever. Here’s why:
In May 2012, Takeshi Miyakawa, a visual artist and furniture designer in New York City, placed a portable battery-powered light inside a translucent “I Love NY” plastic shopping bag, and hung it from a metal rod attached to a tree. When the lamp was on, the bag glowed from within. A friend of the artist said he did this “to lift people’s spirits. He was simply trying to say that he loves the city and spread that attitude around.”
Unfortunately for Miyakawa, someone in the neighborhood saw a contrap-tion with wires, batteries, and plastic boxes and called the New York Police Department’s bomb squad, which evacuated the area and took two hours to determine that a battery and a light was just a battery and a light. When the police tracked the device to Miyakawa, they arrested him and charged him with two counts of first-degree reckless endangerment, two counts of placing a false bomb or hazardous substance in the first degree, two counts of placing a false bomb or hazardous substance in the second degree, two counts of second-degree reckless endangerment, and two counts of second-degree criminal nuisance. A judge ordered him sent to Bellevue hospital for psychi-atric evaluation, as well.
All for hanging a light in a tree.
Miyakawa’s experience is not unique, unfortunately. In another case, re-searchers from Carnegie-Mellon University built similar detectors to ours, and placed them at various points around the Pittsburgh area. While the sensors were enclosed in professionally made plastic cases, and were clearly labeled as an approved research project, once again the police bomb squad was called. (The students didn’t report being arrested. However, they did say it took a great deal of negotiation with the authorities to get their equipment back.)
The US Department of Homeland Security (DHS) urges people to “be vigi-lant, take notice of your surroundings, and report suspicious items or activities to local authorities immediately.” As a result, homemade electronic gadgets that once upon a time (at least, in the lifetimes of the authors) might have been regarded as interesting curiosities are now treated as threats. Many people don’t understand hobby electronics, and are frightened by what they do not understand. Police believe they must treat every suspicious package as if it may be harmful.
The point of telling you all this is not to scare you from building monitoring devices, but to warn you that a home-built, Arduino-based gas sensor might, to the unknowing eye, look like a box of batteries and wires and a scary thing with blinking lights. Leaving something like this unattended, without permis-sion, on property you don’t own, can get you into a world of trouble.
The following subsections are a couple ideas for solving this problem.
Get Official Permission
Look into official channels through which you can deploy experimental pack-ages in public. At A.M.W.A. World Headquarters in New York City, we looked to the Parks Department, which allows researchers to leave experimental devices in some of the city’s parks. The entire application process is on the city’s website. It’s fairly extensive, requiring an explanation of the experiment and a description of the device, but can be filled out in a single sitting.
Unfortunately, processing these permits seems to take a long time. We ap-plied for one in early May 2012, and it still hadn’t arrived by the time this book went to press in November.
Get Your Community Involved
• If you’re a member of a hackerspace, have an open house. Invite mem-bers of the community to meet you in person and learn about what you’re doing. This may work wonders toward alleviating some of the public’s fear of DIY electronics.
• If you’re not a member of a hackerspace, consider joining one, or even starting one. Good online resources for finding and learning more about hackerspaces are the Hackerspace Wiki and the UK Hackspace Foundation.
3/A Brief Introduction
to LEDs
Before we start working on the LED
photome-ter, we’re going to take a brief look at why and
how the gadget’s crucial component—the light
emitting diode, or LED—can be used to
moni-tor certain properties of the atmosphere.
Even if you’ve worked with LEDs before, chances are your projects used them simply as lights or indicators of some sort, with the color choices more about aesthetics than science. By comparison, in this book we use LEDs in ways that take advantage of the physics of light.
We think you’ll get more out of building and using the LED photometer if you know more about that. But if you’re feeling impatient, skip to the project in Chapter 4, the LED Sensitivity Tester, and proceed from there.
It is essential to test your LEDs before you build the LED pho-tometer. Testing takes two forms: (1) testing to see if the LEDs light up and (2) testing the LEDs for wavelength sensitivity. The first test is easy: you can connect the short wire of an LED to Arduino GND and the long end to pin 13, and run the BLINK sketch that comes with the Arduino IDE software; if the LED blinks, it works. (An even easier way is to connect an LED to a 3 v coin cell—with the long wire on the positive side of the bat-tery. If the LED lights, it works.)
Testing the LED for wavelength sensitivity is much more com-plicated; we deal with that in Chapter 4.
What Is a Diode?
A diode is a two-terminal electronic device that lets electricity flow easily in one direction, and prevents (or resists) it from flowing in the other direction.
Many electrical components can be run “backwards”: for example, a loud-speaker can be used as a microphone, and vice versa. A motor, which turns electricity into movement, can often be used as a generator that turns move-ment into electricity.
This reversibility of electronic components is partly thanks to the fact that electricity usually has no problem flowing both ways through a circuit; it makes no difference to an electron if it flows from a battery to a motor or from a motor to a battery.
But the direction of electron flow matters if we’re designing a generator cir-cuit: we don’t want that circuit to suddenly work in reverse and start spinning like a motor! This is where diodes are useful. They work like valves that pre-vent the “backflow” of electricity, ensuring that electrons will move only in the direction we want them to.
Discovery of the Diode
The 1870s were an exciting time to be working with electricity. In America, Thomas Edison was inventing some of the devices that would define the 20th century: the light bulb, the phonograph, and an improved telephone. Mean-while in Europe, scientists were taking a more theoretical approach, seeking to understand how electricity flowed.
In 1874, a German scientist named Karl Ferdinand Braun published an ac-count of what he called “the unilateral conduction of current by natural metal sulfides.” Up to this point, scientists knew that electricity could travel along a wire in either direction. Braun discovered that a crystal of tetrahedrite (a compound of copper, antimony, and sulfur) let electricity flow through it in only one direction. This demonstration of one-way electrical flow was the first known semiconductor diode—in fact, it was the first semiconductor in history.
What Is a Light Emitting Diode?
A light emitting diode is a diode that emits light.Okay, snark aside, in 1907 a scientist named Henry Joseph Round discovered that crystals of carborundum gave off a faint yellow light when they were energized by electrons. These crystals were also diodes, and didn’t emit light when electricity tried to flow the other way. Scientists later discovered that in an LED, electrons combine with electron “holes” in the crystal, and release excess energy as photons in a very narrow range of wavelengths known as the emission band. The narrowness of this emission band is rivaled only by laser light, and explains the jewel-like purity of LED light.
(commonly thought of as the positive terminal), and the shorter lead is called the cathode (commonly thought of as the negative terminal). An easy way to remember this is that the negative terminal has something “subtracted” from it. Because an LED is a diode, electricity will only easily flow through it in one direction. So when you plug an LED into a circuit, be sure to connect the anode to the positive side of the circuit and the cathode to the negative side or ground, if you expect to make it glow.
Figure 3-1. LEDs in 8 mm, 5 mm, and 3 mm sizes.
How Are We Using LEDs in the LED
Photometer?
LEDs not only emit light; they absorb it, too. An amateur scientist discovered this capability of LEDs in the 1970s. Forrest M. Mims III, a former US Air Force officer, had been doing experiments with photocells and light since he was a boy. Understanding that many electronic devices can be run “backwards” [see “What Is a Diode?” (page 33)], Mims reasoned that since LEDs take in electricity and emit light (along that narrow emission band, remember), they should also take in light and give off electricity. A series of experiments proved him right, and by 1973 he had formalized what is now known as the Mims Effect: LEDs will absorb light along a relatively narrow band of color, and emit a small amount of electricity. These light-absorbing qualities of LEDs are what we put to work in our LED photometer.
An LED absorbs light occurring in wavelengths near its own emission band, or slightly shorter. A green LED absorbs light in the greenish-blue part of the spectrum, a red LED absorbs light in the reddish-orange part of the spec-trum, and so on. We can use this difference in the way LEDs absorb light to tell us a great deal about the atmosphere.
What Is Color?
4/Gadget: LED
Sensitivity Tester
Before building and using the LED photometer,
we first need to figure out exactly which
wave-lengths of light each of our LEDs is sensitive to.
Otherwise, we won’t be able to get good data
with the photometer. Unfortunately, no LED
datasheet that we’ve ever seen troubles itself
with listing LED input wavelength, because
LED manufacturers generally don’t think of
their products as input devices. Fortunately, we
can determine input wavelengths with a gadget
we can build ourselves: the LED sensitivity
detector.
Mission: Inputtable
Your mission, should you choose to accept it, is to determine the peak input wavelength for a series of LEDs. You will do this by shining every wavelength of visible light, from 350–700 nm, into each candidate LED, and measuring that LED’s responsive voltage. The LED that’s most sensitive to the wavelength is the one that produces the highest response voltage. Good luck.
How are we going to generate every visible wavelength of light to test our LEDs, from ultraviolet to infrared? If your answer is “use a full-spectrum LED,” you’re correct. This special type of LED is called an RGB LED and it can output red light, green light, blue light, and any combination of those colors: the full ROY G. BIV. Since it’s beyond the scope of this book to go too deeply into the science of combining light to make different colors, suffice it to say that by mixing varying intensities of red, green, and blue light, just about any color can be reproduced. (Look very carefully at the pixels of your computer screen to see this in action.)
Amount Part Type Properties/(Assembly Code)
1 Loudspeaker (SPKR1)
1 TEST LED, 5 mm 5 mm [THT]; (LED2)
1 RGB LED (com. anode, rbg) 5 mm [THT]; pin order rgb; polarity common anode; rgb RGB (LED1) 2 47 Ω resistor Package THT; tolerance ±5%; bands 4;
resistance 47 Ω; pin spacing 400 mil (R1 & R2)
1 62 Ω resistor Package THT; tolerance ±5%; bands 4; resistance 62 Ω; pin spacing 400 mil (R3)
1 Arduino UNO R3 (Arduino1)
1 LCD screen Character type 16 pins (LCD1) 1 Permanent marker in a dark
color
Build the Gadget
1. Connect the RGB LED to Arduino. Most RGB LEDs are common anode, so follow the datasheet that came with your LED to connect the anode to the +5 pin on Arduino (Figure 4-1). The R, G, and B pins should be connected to Arduino pins 8, 6, and 4, respectively. For our RGB LED, the red cathode needed a 62 ohm resistor, while the green and blue cathodes needed a 47 ohm resistor. (Your values may vary.)
Figure 4-1. Step one.
2. Connect the LCD. Connect the common ground lead on the LCD (screen display) to the GND pin on Arduino. Connect the VCC lead on the LCD to the 3.3 power pin on Arduino. Connect the DATA lead on the LCD to Arduino pin 2 (Figure 4-2).
Figure 4-2. Step two.
Figure 4-3. Step three.
4. Load the sketch. Now we need a way to translate a wavelength of light into its red, green, and blue values. Fortunately, a scientist named Dan Brunton has developed a formula that will do just that. We programmed Brunton’s algorithm into the following Arduino sketch. After setting up all the components, running this code will cause the RGB LED to emit light from 350–700 nm, the range of visible light.
You can find this sketch in the AMWA GitHub repository.
/**
* Determining RGB color from a wavelength
* The code is based on an algorithm from Dan Bruton's Color Science Page. * http://www.midnightkite.com/color.html
* by Patrick Di Justo * 2012 08 28
* **/
#include <EEPROM.h> #include <SoftwareSerial.h>
//Set up the Liquid Crystal Display #define LCDIn 3
#define LCDOut 2
SoftwareSerial mySerialPort(LCDIn, LCDOut); //LCD Display buffers
char databuff[16]; char dispbuff[16];
// Variables needed for RGB calculations float Gamma = 1.00;
int MaxIntensity = 255; float fBlue; float fGreen; float fRed; float Factor; int iR; int iG; int iB;
//Our eyes can generally see light wavelengths between 350 and 700 nanometers.
//Here, we start the RGB Led with 350 int i = 350;
//RGB is plugged into these arduino digital pins const int redOutPin = 8;
const int greenOutPin = 6; const int blueOutPin = 4;
// LED to be tested is plugged into A0 int testPin = A0;
// variables to store the value coming from the sensor int sensorValueTest =0;
int oldTest =0; int peaknm =0;
//EEPROM start data int addr=0;
//Music
int notelen = 90; int dlx = 130;
void setup() {
//Set the RGB LED pins to output
pinMode(redOutPin, OUTPUT); pinMode(greenOutPin, OUTPUT); pinMode(blueOutPin, OUTPUT);
// Initialize the LCD display mySerialPort.begin(9600); mySerialPort.write(0xFE); mySerialPort.write(0x01);
// test to see if the RGB LED works makeColor(i); analogWrite(redOutPin,255-iR); analogWrite(greenOutPin, 255-iG); analogWrite(blueOutPin, 255-iB); delay(5000); } void loop() {
// set the RGB LED to a specific color makeColor(i);
analogWrite(redOutPin, 255-iR); analogWrite(greenOutPin, 255-iG); analogWrite(blueOutPin, 255-iB); delay(500);
// read the sensitivity of the Test LED sensorValueTest= analogRead(testPin);
if (sensorValueTest > oldTest) {
oldTest = sensorValueTest; peaknm = i;
}
// Display the values on the LCD
sprintf(databuff,"CV:%3d Cnm:%3d",sensorValueTest,i); sprintf(dispbuff,"%-16s",databuff);
mySerialPort.print(dispbuff);
sprintf(databuff,"XV:%3d Xnm:%3d",oldTest, peaknm); sprintf(dispbuff,"%-16s",databuff);
mySerialPort.print(dispbuff);
writeData(); i++;
// If we've reached the upper limit of 700 nm, play a little melody if (i>700)
{
for (int f = 0; f<=100; f++) { tone(7,196,notelen); delay(dlx); tone(7,131,notelen); delay(dlx); tone(7,261,notelen); delay(dlx); tone(7,330,notelen); delay(dlx); tone(7,294,notelen); } delay(10000); } } void writeData() {
int quotient = i/256; int mod = i % 256;
EEPROM.write(addr++,quotient); EEPROM.write(addr++,mod); quotient = sensorValueTest/256; mod = sensorValueTest % 256; EEPROM.write(addr++,quotient); EEPROM.write(addr++,mod); }
void makeColor(int lambda) {
if (lambda >= 350 && lambda <= 439) {
fRed = -(lambda - (float)440.0) / ((float)440.0 - (float)350.0); fGreen = (float)0.0;
fBlue = (float)1.0; }
else if (lambda >= (float)440.0 && lambda <= (float)489.0) {
fRed = 0.0;
fGreen = (lambda - (float)440.0) / ((float)490.0 - (float)440.0); fBlue = 1.0;
}
fRed = 0.0; fGreen = 1.0;
fBlue = -(lambda - (float)510.0) / ((float)510.0 - (float)490.0);
}
else if (lambda >= (float)510.0 && lambda <= (float)579.0) {
fRed = (lambda - (float)510.0) / ((float)580.0 - (float)510.0); fGreen = 1.0;
fBlue = 0.0; }
else if (lambda >= (float)580.0 && lambda <= (float)644.0) {
fRed = 1.0;
fGreen = -(lambda - (float)645.0) / ((float)645.0 - (float)580.0); fBlue = 0.0;
}
else if (lambda >= 645.0 && lambda <= 780.0) {
fRed = 1.0; fGreen = 0.0; fBlue = 0.0; }
else {
fRed = 0.0; fGreen = 0.0; fBlue = 0.0; }
if (lambda >= 350 && lambda <= 419) {
Factor = 0.3 + 0.7*(lambda - (float)350.0) / ((float)420.0 - (float)350.0);
}
else if (lambda >= 420 && lambda <= 700) {
Factor = 1.0; }
else if (lambda >= 701 && lambda <= 780) {
Factor = 0.3 + 0.7*((float)780.0 - lambda) / ((float)780.0 - (float)700.0);
} else {
Factor = 0.0; }
iR = factorAdjust(fRed, Factor, MaxIntensity, Gamma); iG = factorAdjust(fGreen, Factor, MaxIntensity, Gamma); iB = factorAdjust(fBlue, Factor, MaxIntensity, Gamma); }
int factorAdjust(float C, float Factor, int MaxIntensity, float Gamma) {
if(C == 0.0) {
return 0; }
else {
return (int) round(MaxIntensity * pow(C * Factor, Gamma)); }
}
5. Select an LED to test. If you’ve purchased a large number of LEDs to test, they’re likely to arrive in individual plastic pouches. Neatly pull or cut open the plastic pouch containing the LED, take the LED out, and set the pouch aside; you’ll need it again soon (Figure 4-4).
Figure 4-4. Step four.
Figure 4-5. Step five.
As you test each LED, be careful to plug it into the breadboard with the proper polarity: anode to Arduino’s analog pin 0 and cathode to Ardunio’s GND pin.
7. Test the LED. For best results, enclose the test LED and the RGB LED in a single small, opaque tube, such as a piece of shrinkwrap tubing, a blackened soda straw, or even the opaque, sawed-off body of a ball point pen. Ideally, the two LEDs should be extremly close without actually touching. When everything is ready, turn on or reset Arduino.
Several things will happen. The RGB LED will start to glow, and the top line of the LCD will inform you that the RGB LED is currently displaying a particular wavelength of light ranging from 350–700 nm. At each wavelength, the test LED absorbs the light being put out by the RGB LED, and converts that to a voltage.
• Low voltage means that the test LED is not absorbing much light at that wavelength; in other words, the test LED is not very sensitive to this color. A higher voltage indicates that the test LED is more sensitive to this particular wavelength and is therefore creating more electricity from the light it absorbs.
• As Arduino works its way up the spectrum, it keeps track of the peak voltage the test LED puts out, and the particular wavelength that caused the peak voltage.
• You’ll know the test is complete when the counter reaches 700 nm, and Arduino plays a little melody.
8. Note your results. Using the permanent marker, write your data—the peak voltage and the light wavelength that caused it—on the plastic pouch that you set aside in step four. Carefully remove the test LED from the gadget and slide it back into the pouch.
9. Return to step five and hit the reset button on Arduino to repeat the sensitivity test with another LED.
In order to build an LED photometer that works properly, it’s very important to test each LED before you use it in the photometer. You need to know the particular wavelengths of light that your LEDs are detecting, because this impacts the types of gases you’ll be able to detect in the atmosphere, and how well you’ll be able to detect them.
nm? What is this nm?
Wavelengths of light are so small they are measured not in millimeters (1/1,000ths of a meter) or micrometers (1/1,000,000ths of a meter) but in nanometers (1/1,000,000,000ths of a meter). Because wavelengths of light are so small, a great many things interfere with them. Imagine that you’re inside a walk-in closet or windowless bathroom: by simply sealing the door, it would be easy to stop all light waves from entering the room. But if you had a portable radio with you (if you know what that is), or your cell phone (which is very much like a portable radio), you’d have no problem getting a radio signal even though all external light into your room was cut off—unless your closet was deep inside an underground, reinforced concrete security bunker!
light. By measuring which light waves are affected more strongly and which light waves are affected less strongly by the given particles in the atmosphere, we can get a very good estimate of the concentration of those gases or par-ticles in the atmosphere.
Table 4-1 shows some values we got with a sample of LEDs from different manufacturers. Notice that while the LED peak input value is usually lower than the output value, that’s not always the case. LEDs at the blue end of the spectrum have input wavelengths almost exactly the same as their output wavelengths. As we move down the spectrum toward the red end, the dis-tance between input and oputput wavelength grows, but not uniformly. For example, look at the two yellow LEDs giving off light with a wavelength of 592 nm. Their input values are exactly 20 nm different!
This explains why we said earlier that it is important to test your LEDs. You need to know exactly which peak wavelength your LEDs are absorbing.
Table 4-1. Frequencies of light for various LEDs by part number.
Manufacturer Mfgr Part Number Color Output nm Input nm
Jameco Valuepro LVB3330 Blue 430 429
Avago Technologies QLMP-LB98 Blue 470 471 Avago Technologies QLMP-LM98 Green 525 498
Agilent HLMP-CM39-UVCDD Green 535 505
Siemans Corporation LG5469FH Green 565 507
Valuepro LUY3833H Yellow 590 537
Valuepro BVT-5E1TT4E Yellow 592 552
Jameco Valuepro BVT-529TT8E Yellow 592 532
Valuepro LVY3333/A Yellow 595 532
Valuepro RL50-PY543 Yellow 595 517
Valuepro LUE3333 Orange 620 625
Valuepro UT9C13-86-UDC2-R Red 630 580
Jameco Valuepro BVT-5E1QT4ER Red 634 555
Valuepro RL50-PR543 Red 635 534
5/Gadget: LED
Photometer
A photometer is a device that measures one or
more qualities of light. Most photometers
con-sist of an interference filter and a photo
detec-tor. The interference filter is a colored piece of
plastic or glass that filters out nonessential
col-ors, letting through only the precise
wave-lengths of light we’re interested in studying. A
photo detector behind that filter monitors the
intensity of the light that makes it through the
filter.
In this gadget, LEDs replace both the interference filter and the photo de-tector. As Forrest Mims showed, LEDs are photodiodes: diodes that generate electrical current proportional to the light that falls on them, and they act as their own color filter. As you learned from your own experiments with the LED sensitivity tester, a blue LED is most sensitive to blue light and much less sensitive to red. By recording the amount of current from differently colored LEDs, we can learn how much of each color of the sun’s light (blue, green, and red) is getting through the atmosphere to the gadget.
The main advantage of an LED photometer is that it is relatively inexpensive. LEDs are cheap, rugged, and stable. They come in a variety of colors and a variety of spectral responses. The electronics that go with them can be pur-chased online or at any good electronics store.
A couple things to keep in mind:
• Although LEDs can work as detectors, they were not built for this pur-pose. Whereas an ideal detector for our needs would detect only a very narrow range of wavelengths, and be perfectly centered around the
wavelengths we wish to study, LEDs can detect light over a fairly wide range of wavelengths. That’s why we’ve tested the LEDs: to know their detection peaks, so that we know which wavelengths of light we’re measuring.
• Also, the current generated